Increased production of tumor necrosis
factor-
α
α
α
α
α
in whole blood cultures from
children with primary malnutrition
1Departamento de Pediatria e Laboratório de Fisiopatologia Humana, Instituto Fernandes Figueira, FIOCRUZ, Rio de Janeiro, RJ, Brasil 2Instituto de Microbiologia Professor Paulo de Góes,
Universidade Federal do Rio de Janeiro, Rio de Janeiro, RJ, Brasil 3Unité Cytokines et Inflammation, Institut Pasteur de Paris, Paris, France 4Département de l’Évaluation Scientifique de l’INSERM, Paris, France Z.M.A. Azevedo1*,
R.A. Luz1*, S.H. Victal1, B. Kurdian1, V.M. Fonseca1, C. Fitting3, F.P. Câmara2, N. Haeffner-Cavaillon4, J.-M. Cavaillon3, M.I.C. Gaspar Elsas1 and P. Xavier Elsas2
Abstract
Because low tumor necrosis factor-α (TNF-α) production has been reported in malnourished children, in contrast with high production of TNF-α in experimental protein-energy malnutrition, we reevaluated the production of TNF-α in whole blood cultures from children with primary malnutrition free from infection, and in healthy sex- and age-matched controls. Mononuclear cells in blood diluted 1:5 in endo-toxin-free medium released TNF-α for 24 h. Spontaneously released TNF-α levels (mean ± SEM), as measured by enzyme immunoassay in the supernatants of unstimulated 24-h cultures, were 10,941 ± 2,591 pg/ml in children with malnutrition (N = 11) and 533 ± 267 pg/ml in controls (N = 18) (P < 0.0001). TNF-α production was increased by stimulation with lipopolysaccharide (LPS), with maximal production of 67,341 ± 16,580 pg/ml TNF-α in malnourished children and 25,198 ± 2,493 pg/ml in controls (P = 0.002). In control subjects, LPS dose-dependently induced TNF-α production, with maximal responses obtained at 2000 ng/ml. In contrast, malnourished patients produced significantly more TNF-α with 0.02-200 ng/ml LPS, responded maxi-mally at a 10-fold lower LPS concentration (200 ng/ml), and presented high-dose inhibition at 2000 ng/ml. TNF-α production a) was signifi-cantly influenced by LPS concentration in control subjects, but not in malnourished children, who responded strongly to very low LPS concentrations, and b) presented a significant, negative correlation (r = -0.703, P = 0.023) between spontaneous release and the LPS concentration that elicited maximal responses in malnourished pa-tients. These findings indicate that malnourished children are not deficient in TNF-α production, and suggest that their cells are primed for increased TNF-α production.
Correspondence
Z.M.A. Azevedo
Unidade de Terapia Intensiva Departamento de Pediatria Instituto Fernandes Figueira FIOCRUZ
Av. Rui Barbosa, 716 22250-020 Rio de Janeiro, RJ Brasil
Fax: +55-21-2553-8094 E-mail: [email protected] [email protected]
*These authors contributed equally to this research and should be considered to be joint first authors.
Research supported by
PAPES/FIOCRUZ, INSERM (Réseau Scientifique Nord-Sud), FINEP, FINEP/BID and PRONEX, and by fellowships from CNPq (to R.A. Luz) and RHAE (to J.-M. Cavaillon).
Received February 27, 2004 Accepted October 13, 2004
Key words
Introduction
Malnutrition is associated with abnor-malities in the specific immune response and with increased susceptibility to infection (1,2). However, pro-inflammatory cytokines, including tumor necrosis factor alpha
(TNF-α), can also be produced by cells involved in natural immunity after exposure to many pathogenic microorganisms and their prod-ucts (3,4). This may occur in primary child-hood malnutrition, which, far from being an isolated medical problem occurring in a con-trolled environment, is associated with in-creased environmental exposure to infec-tious hazards due to deficient sanitation, poor hygiene standards, crowded housing, and restricted access to medical care. Hence, if malnourished children remain capable of producing pro-inflammatory cytokines to any extent, TNF-α production induced by envi-ronmental pathogens and/or their products should be detectable in tissues or cells from these patients. The weight loss, negative ni-trogen balance, skeletal muscle catabolism, and increased liver weight (5,6) induced by TNF-α and IL-1 may possibly add to the metabolic abnormalities of malnutrition.
Data from the literature do not provide a coherent picture. Several studies describe a marked deficit in TNF-α, IL-1, and IL-6 production in severe childhood malnutrition (7-10) while others have reported that star-vation increases TNF-α production (11). Furthermore, production of IL-1 and IL-6 is increased in malnourished subjects free from infection (12), and production of TNF-α and IL-1 proceeds normally in animal models of protein malnutrition (13,14). Finally, in-creased levels of soluble TNF-α receptors, which are induced by sustained increases in TNF-α receptors as part of regulatory mechanisms (15-18), have been detected in malnourished children (19), suggesting that these children are capable of significant
TNF-α production.
These discrepancies may be partly due to
differences in methodology, including: a) cytokine quantitation by immunoassays ver-sus bioassays (7,9); b) the measurement of cytokines released in the absence of known stimulation or induced by various agonists (7,9); c) the use of non-comparable patient populations, especially if one considers the differences in the clinical presentation of malnutrition between geographically and eth-nically distinct populations (20); d) the clini-cal and anthropometric criteria that define malnutrition (7,9); e) the clinical and labora-tory data used to exclude infection. Often, the study design lacks a control group of healthy children (7,9) and dose-response re-lationships for the stimulus are not reported (7,9), so that it is unclear how closely the data reflect the malnourished subjects’ en-tire potential for cytokine production. Ac-cordingly, we reassessed the production of TNF-α, both “spontaneous” and induced by a wide range of concentrations of lipopoly-saccharide (LPS), in Brazilian children with primary malnutrition as well as in a healthy control group. Every effort was made to exclude clinical or subclinical infection and parasitic infestation, which increase TNF-α
production (3,21). We report that large amounts of TNF-α are produced in whole blood cultures from malnourished children, both in the absence and in the presence of LPS.
Material and Methods
Subjects
Pedra shantytowns) with an average family income below US$80 per month, due to high unemployment rates and a large proportion of broken homes. CSGSF carries out com-munity work focused on social, nutritional and clinical aspects, and targeted on the children of the community. Children diag-nosed as malnourished by the clinical staff of CSGSF are first referred to the malnutri-tion clinic for a complete nutrimalnutri-tional and clinical evaluation, including a detailed nu-tritional history, anthropometric evaluation and a thorough physical examination by a senior pediatrician. The nutrition specialist in charge of the clinic holds monthly meet-ings with the mothers or legal representa-tives of the children, where the social and nutritional status of the patients is discussed and guidance is provided. The mothers of the children enrolled in the study were asked to sign an Informed Consent Form and to provide detailed information on social and economical history (family income, unem-ployment status, number of people per home, hygiene habits, sanitation structure, endemic and/or infectious hazards near the home), family history (family structure, number of siblings, death/disease of siblings, heredi-tary diseases), perinatal history (progress of pregnancy, birth and developmental history), immunological history (vaccinations, child-hood infections), nutritional history (dura-tion of breast-feeding, daily diet). Control (healthy) subjects were children referred to the Department of Surgery, Instituto Fernan-des Figueira, also at FIOCRUZ, Rio de Ja-neiro, for elective surgery for phimosis or inguinal hernia. The control group was se-lected on the basis of the following consider-ations: a) the mothers of well-nourished chil-dren living in the same area as the malnour-ished children did not substantially adhere to the study, since they could detect no benefit in it for children they considered to be healthy, but perceived the requirements of the study (which included several lengthy consulta-tions, parasitological treatment and blood
sampling), as a major inconvenience, in con-trast to the mothers of malnourished chil-dren, who were highly motivated, having already joined the project to seek help for children they perceived as sick, and b) in the elective surgery group, blood sampling for preoperative evaluation is mandatory, and since the surplus of these samples was used for the study, enrollment involved no addi-tional procedure, being therefore easier to accept by the consenting parents. To com-pletely rule out asymptomatic parasitic in-fections as a potential stimulus for TNF-α
production, the children in both groups were empirically treated for parasitic infection with mebendazole and metronidazole 15 days before the laboratory tests.
Nutritional assessment
mal-nourished and control children included the distribution of SD for the three indices (weight/age, height/age, weight/height), as recommended by the WHO (22,23). From triceps skinfold thickness and mid-upper arm circumference measurements, we calculated the total upper arm area, upper arm muscle area and upper arm fat area. For these indi-ces, the cut-off point was the 5th percentile of the reference population, which corre-sponds to a Z score ≤1.650 (24-26). We excluded from the study all children present-ing one or more of the followpresent-ing features: a history of prematurity, malnutrition second-ary to cancer, tuberculosis, diabetes, AIDS or HIV infection, immunological diseases, or other causes, kwashiorkor, congenital malformations or genetic diseases, chronic use of anti-inflammatory drugs (both steroi-dal and nonsteroisteroi-dal), special enteral (gluta-mine/ω3 fatty acids) or parenteral nutrition,
or infectious disease.
Laboratory tests
Children from both groups were tested for plasma triglycerides and cholesterol lev-els, total plasma protein and fractions, trans-ferrin, total and differential blood cell counts, platelet counts, mean red blood cell diam-eter, volume, and hemoglobin content, uri-nalysis and parasitological examination of the stools, and TNF production. For whole blood cultures, heparinized blood (diluted 1:5 in endotoxin-tested medium) was cul-tured in 24-well polystyreneplates (Corning Corporation, Corning, NY, USA), as de-scribed by Warren et al. (27), 0.5 ml per well in triplicate. Cultures were stimulated or not with LPS, 20 pg/ml-2000 ng/ml, for 24 h at 37ºC, in the presence of 5% CO2.
Supernatants were obtained by centrifu-gation at 450 g (10 min, 20ºC), aliquoted into 0.3-ml volumes, and stored at -80ºC before assay. Culture supernatants were as-sayed at 1:125 dilution for unstimulated cul-tures or at 1:500 dilution for LPS-stimulated
cultures for TNF-α by enzyme immunoas-say (Medgenix EASIA™ kits, Bio Source Europe S.A., Zoning Industrial B-6220, Fleurus, Belgium). The minimal detectable concentration of these cytokines was 3 pg/ ml. Absorbance was measured with a Sigma Diagnostics EIA Multi-well reader (Sigma, St. Louis, MO, USA) and cytokine concen-trations were calculated by linear regression using calibration curves covering the 15-1000 pg/ml concentration range.
Reagents
For whole blood cultures, we used endo-toxin-tested RPMI 1640 medium containing NaHCO3 but no L-glutamine (B-4800;
Bio-Whittaker, Verviers, Belgium). A stock so-lution of phenol-extracted E. coli 055:B5 LPS (Difco Europe, Grenoble, Isère, France) was prepared by sonication in deionized water, sterilized by UV irradiation, aliquoted and stored at -20ºC until use; working dilu-tions of LPS were freshly prepared from frozen aliquots in RPMI medium. Sodium heparin (stock solution of 5000 IU/ml) was from Cristália (São Paulo, SP, Brazil).
Statistical analysis
whether age was a statistically significant factor, subjects within each group were di-vided into two age classes (up to 2 years and more than 2 years) and the t-test was also applied. ANOVA with the Tukey HSD cor-rection was used to determine the differ-ences between cultures exposed to different LPS concentrations within each group. Pearson’s correlation coefficient was calcu-lated for all anthropometric measurements. The chi-square test was used to determine differences concerning categoric variables. For values below 5 in 2 x 2 tables, the P value from the Fisher exact test was used.
Results
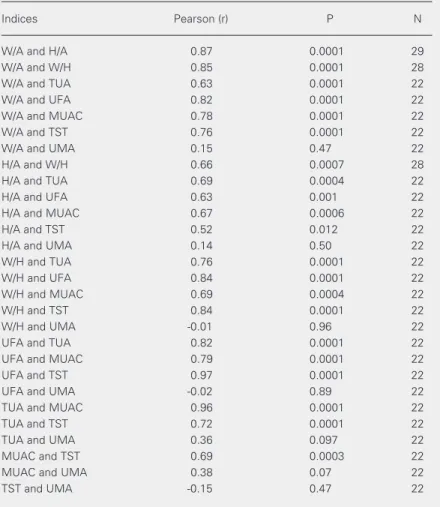
The data reported here refer to a group of 11 malnourished children who met the strin-gent criteria for absence of infection, and a group of 18 control subjects. Table 1 pre-sents the age and sex distribution of both groups. No differences in ethnic origin were detected between groups, both of which in-cluded black, white and mulatto children. As shown in Table 2, there was a significant positive correlation among the Z scores of all indices (with the single exception of up-per arm muscle area), thereby supporting the use of the established indices weight/age and height/age to characterize both groups. For all the remaining positively correlated indi-ces and measurements, differenindi-ces between the two groups were significant for the aver-age Z scores, as shown in Table 3. Taken together, these data show that the groups fulfilled the criteria for malnourished and control children, respectively, when any of a number of well-established indices and indi-cators was used.
There were no significant differences between groups regarding a) frequency of low birth weight (<2.500 g) children (P < 0.05, Fisher exact test), b) average weight at birth (P = 0.051, t-test), c) time of weaning (≤6 months; P < 0.05, Fisher exact test), d) prevalence of anorexia (P < 0.05, Fisher
Table 2. Pearson’s correlation coefficients for anthropometric measurements and indices.
Indices Pearson (r) P N
W/A and H/A 0.87 0.0001 29
W/A and W/H 0.85 0.0001 28
W/A and TUA 0.63 0.0001 22
W/A and UFA 0.82 0.0001 22
W/A and MUAC 0.78 0.0001 22
W/A and TST 0.76 0.0001 22
W/A and UMA 0.15 0.47 22
H/A and W/H 0.66 0.0007 28
H/A and TUA 0.69 0.0004 22
H/A and UFA 0.63 0.001 22
H/A and MUAC 0.67 0.0006 22
H/A and TST 0.52 0.012 22
H/A and UMA 0.14 0.50 22
W/H and TUA 0.76 0.0001 22
W/H and UFA 0.84 0.0001 22
W/H and MUAC 0.69 0.0004 22
W/H and TST 0.84 0.0001 22
W/H and UMA -0.01 0.96 22
UFA and TUA 0.82 0.0001 22
UFA and MUAC 0.79 0.0001 22
UFA and TST 0.97 0.0001 22
UFA and UMA -0.02 0.89 22
TUA and MUAC 0.96 0.0001 22
TUA and TST 0.72 0.0001 22
TUA and UMA 0.36 0.097 22
MUAC and TST 0.69 0.0003 22
MUAC and UMA 0.38 0.07 22
TST and UMA -0.15 0.47 22
W/A = weight-for-age; H/A = height-for-age; W/H = weight-for-height; MUAC = mid-upper arm circumference; TST = triceps skinfold thickness; TUA = total mid-upper arm area; UMA = upper arm muscle area; UFA = upper arm fat area.
Table 1. Age and sex distribution of the subjects in the malnourished and control groups.
Patients Age (months) Sex
Lower Median Upper Male Female age limit age age limit
Malnourished 2 56 127 63.6% (7/11) 36.4% (4/11) Control 2 23 42 72.2% (13/18) 27.8% (5/18)
0.0003, Fisher exact test), b) frequency of ingestion of animal protein other than milk (P = 0.001, Fisher exact test), and c) average family income (P = 0.001, t-test). Differ-ences in family income were associated with differences in a number of specific objective indicators, such as the type of dwelling (brick houses or wooden shacks) and access to sewage, which was not available to most malnourished patients and their families. Taken together, these data indicate that the differences in anthropometric indices are unlikely to be due to differences in prenatal development, or to anorexia, but are consist-ent with restricted protein-calorie intake af-ter birth.
TNF-ααααα production in unstimulated whole blood cultures
As shown in Figure 1, control children secreted 553 ± 267 pg/ml TNF-α(mean ± SEM) into the supernatants of unstimulated cultures, whereas malnourished children se-creted 10,941 ± 2,591 pg/ml TNF-α under the same conditions. The difference between these groups was statistically significant (P < 0.0001). These findings suggest that cells from malnourished children have already been primed for high TNF-α production in vivo, even without further in vitro exposure to LPS. We found a statistically significant inverse correlation between spontaneous re-lease of TNF-α and the weight/age (r = -0.44, P = 0.01, N = 29) and height/age (r = -0.52, P = 0.004, N = 28) indices when data from both groups were pooled. In contrast,
there was no correlation within the malnour-ished group between plasma triglyceride lev-els and spontaneous release of TNF-α (r = 0.05, P > 0.89, N = 8). Concerning spontane-ous release of TNF, no significant differ-ences were observed a) between anorectic and non-anorectic subjects within the mal-nourished (P = 0.60) or control group (P = 0.25), b) between subjects with or without anemia (P = 0.64 and P = 0.63, respectively), or c) between subjects with or without hy-pertriglyceridemia (P = 0.89 and P = 0.20).
TNF-ααααα production in whole blood cultures stimulated with LPS
When whole blood cultures from mal-nourished or control children were estab-lished in the presence of different LPS con-centrations, TNF-α production was increased in every case (see below). As shown in Fig-ure 2, maximal TNF-α production was elic-ited in 15 of 18 control children by LPS at 2000 ng/ml, the highest concentration tested. In contrast, only 4 of 11 malnourished sub-jects presented maximal TNF-α production responses to the same LPS concentration. In the remaining 7, maximal TNF-α production was elicited by LPS concentrations below 2000 ng/ml, while this occurred for only 3 of the 18 control subjects. In this case, higher LPS concentrations partially inhibited
TNF-α production (see below). These results in-dicate that malnourished children are not deficient in their ability to respond to LPS, as suggested by other studies (7,9,10), and fur-ther indicate that malnourished children have
Table 3. Z scores for the anthropometric indices.
W/A H/A W/H MUAC TST TUA UMA UFA
Malnourished -2.40±0.10 -2.17±0.16 -1.49± 0.138 -1.76±0.25 -0.6±0.12 -1.55±0.20 -1.07±0.24 -0.97±0.11
Control -0.11±0.28 -0.057±0.10 -0.090± 0.272 -0.70±0.26 0.54±0.38 -0.53±0.23 -0.97±0.16 0.22±0.29
P 0.000009 0.000014 0.00091 0.021 0.016 0.007 0.94 0.0009
increased sensitivity to lower LPS concen-trations, a point discussed in more detail below (see dose-response relationships).
Maximal TNF-ααααα production in malnourished and healthy subjects
As shown in Figure 3, the amount of TNF-α released in the presence of maxi-mally stimulatory LPS concentrations varied from subject to subject in both groups (panel A, malnourished children, panel B, control subjects). Nevertheless, the addition of LPS increased TNF-α production relative to the unstimulated cultures in every case, and the maximal response of each subject is taken to be a measure of the subject’s capacity to produce TNF-α in vitro.
As shown in Figure 4, for the control group the maximally stimulated TNF-α pro-duction was 25,198 ± 2,493 pg/ml (mean ± SEM, N = 18), while for malnourished chil-dren the corresponding values were 67,341 ± 16,580 pg/ml (mean ± SEM, N = 11). The difference between these groups was statisti-cally significant (P = 0.002). As also shown in Figure 4, large differences persisted when background TNF-α secretion (from unstimu-lated cultures) was subtracted for each pa-tient, thus allowing visualization of the LPS-dependent secretion. The difference in maxi-mally stimulated TNF-α release between these groups was still more than 23,000 pg/ ml after subtraction of spontaneous release. These data document that cells from mal-nourished subjects release larger amounts of TNF-α than those from healthy subjects when exposed to optimally stimulating LPS con-centrations.
Factors influencing TNF-ααααα production
We evaluated which identifiable factors had an effect on TNF-α production. No sta-tistically significant effect of age or sex could be demonstrated within either group. Highly significant differences could be attributed to
Figure 1. Tumor necrosis factor alpha (TNF-α) production in un-stimulated 24-h whole blood cultures of healthy controls (N = 18) and malnourished children (N = 11). Data are reported as mean ± SEM of TNF-α meas-urements in 24-h culture super-natants. P between groups <0.000 (t-test).
TNF-α
(pg/ml)
16,000
12,000
8,000
4,000
0
Control Malnourished
Frequency of maximal
responses (%)
100
80
60
40
20
0
2000 ng/ml <2000 ng/ml
Figure 2. Induction of maximal tumor necrosis factor alpha (TNF-α) production by maximal or submaximal LPS concentra-tions in 24-h whole blood cul-tures of healthy controls and malnourished children. Data are the % of total subjects in each group presenting maximal TNF-α production at the highest (2000 ng/ml) LPS concentration tested (open columns, controls, N = 18; filled columns, malnour-ished subjects, N = 11) or at lower (0.002-200 ng/ml) stimu-lus concentrations.
TNF-α
(pg/ml)
200,000
150,000
100,000
50,000
0
Unstimulated Maximal
TNF-α
(pg/ml)
100,000
75,000
50,000
25,000
0
Unstimulated Maximal
A
B
TNF-α
(pg/ml)
90,000
LPS-induced TNF Total TNF
67,500
45,000
22,500
0
Figure 4. Tumor necrosis factor alpha (TNF-α) produc-tion in maximally lipopolysaccharide (LPS)-stimulated whole blood cultures from healthy controls and mal-nourished children. Data are reported as mean ± SEM for TNF-α in 24-h culture supernatants. Open columns, controls (N = 18); filled columns, malnourished sub-jects (N = 11). On the left, total TNF-α production in maximally stimulated cultures. On the right, TNF-α production after subtracting the background (“sponta-neous”) release for each patient. Differences between these groups were statistically significant (P = 0.002, t-test).
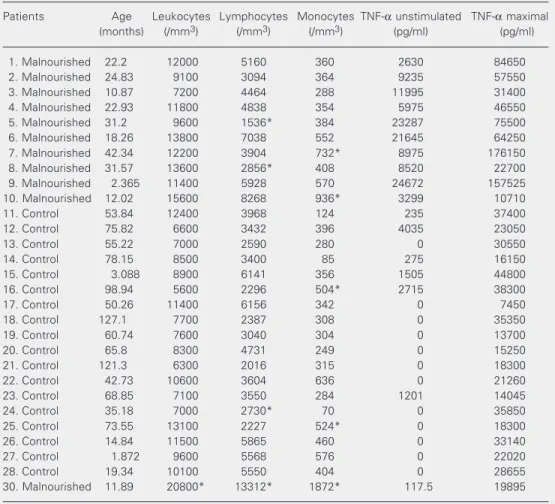
Table 4. Tumor necrosis factor alpha (TNF-α) production in 24-h whole blood cultures and total and mono-nuclear leukocyte counts for the study subjects.
Patients Age Leukocytes Lymphocytes Monocytes TNF-α unstimulated TNF-α maximal (months) (/mm3) (/mm3) (/mm3) (pg/ml) (pg/ml)
1. Malnourished 22.2 12000 5160 360 2630 84650
2. Malnourished 24.83 9100 3094 364 9235 57550
3. Malnourished 10.87 7200 4464 288 11995 31400
4. Malnourished 22.93 11800 4838 354 5975 46550
5. Malnourished 31.2 9600 1536* 384 23287 75500
6. Malnourished 18.26 13800 7038 552 21645 64250
7. Malnourished 42.34 12200 3904 732* 8975 176150
8. Malnourished 31.57 13600 2856* 408 8520 22700
9. Malnourished 2.365 11400 5928 570 24672 157525 10. Malnourished 12.02 15600 8268 936* 3299 10710
11. Control 53.84 12400 3968 124 235 37400
12. Control 75.82 6600 3432 396 4035 23050
13. Control 55.22 7000 2590 280 0 30550
14. Control 78.15 8500 3400 85 275 16150
15. Control 3.088 8900 6141 356 1505 44800
16. Control 98.94 5600 2296 504* 2715 38300
17. Control 50.26 11400 6156 342 0 7450
18. Control 127.1 7700 2387 308 0 35350
19. Control 60.74 7600 3040 304 0 13700
20. Control 65.8 8300 4731 249 0 15250
21. Control 121.3 6300 2016 315 0 18300
22. Control 42.73 10600 3604 636 0 21260
23. Control 68.85 7100 3550 284 1201 14045
24. Control 35.18 7000 2730* 70 0 35850
25. Control 73.55 13100 2227 524* 0 18300
26. Control 14.84 11500 5865 460 0 33140
27. Control 1.872 9600 5568 576 0 22020
28. Control 19.34 10100 5550 404 0 28655
30. Malnourished 11.89 20800* 13312* 1872* 117.5 19895
the presence of LPS over the entire concen-tration range tested when compared with unstimulated cultures within both groups. For control subjects, significant differences were also observed between cultures stimu-lated with different LPS concentrations. In contrast, such differences were not detected for malnourished children, which presented strong responses even at very low LPS con-centrations (see below). We did not find a significant correlation between spontaneous release and maximal response in either group. However, we did find a significant negative correlation (r = -0.703, P = 0.023) between spontaneous release and the LPS concentra-tion that induced maximal responses for malnourished (but not for control) subjects. Hence, malnourished children who presented a greater spontaneous release tended to re-spond maximally to lower LPS concentra-tions.
One important issue in this study refers to the relationship between the production of TNF-α by subjects from both groups and the number of cells present in peripheral blood, where mononuclear cells account for the bulk of TNF-α production (28,29). Because total and differential cell counts were ob-tained for all subjects, we were able to rule out the possibility that differences in TNF-α
production were due to different numbers of mononuclear cells in blood. As shown in Table 4, total leukocyte counts were within the normal range for the age of each subject in all cases (the normal limits for leukocytes, lymphocytes and monocytes for each age interval can be found in Ref. 30), with the exception of malnourished patient #30. Pa-tients #5 and 8 (malnourished) and #24 (con-trol) presented lymphopenia; patients #7 and 10 (malnourished) and #16, 22 and 25 (con-trols) presented monocytosis. In all cases, lymphopenia or monocytosis was not severe enough to affect significantly total leukocyte counts. By contrast, patient #30 (malnour-ished) had both lymphocytosis and monocy-tosis, which accounted for the leukocytosis.
Most importantly, there was no relationship between leukocyte, lymphocyte, monocyte, or mononuclear cell (lymphocytes plus mono-cytes) counts and increased TNF-α produc-tion, either spontaneous or LPS-induced. Highest TNF-α production was not associ-ated with high leukocyte counts, either total or differential, and the only patient with leukocytosis had relatively low TNF-α pro-duction.
Dose-response relationships
As shown in Figure 5, when the ability of different LPS concentrations to elicit TNF-α
production was analyzed, malnourished chil-dren, as a group, produced significantly more TNF-α than controls at all LPS concentra-tions, except 2000 ng/ml. Significant differ-ences were still found for 2, 20 and 200 ng/ ml LPS when background “spontaneous” release was subtracted for each patient (P = 0.013, P = 0.012 and P = 0.01, respectively). For the control group, TNF-α production increased dose dependently with LPS con-centration, with log increases in stimulus leading to approximately linear increases in production, and maximal production was observed at 2000 ng/ml. In contrast, the dose-response profile for the malnourished group was a more complex curve with a peak at 200 ng/ml. High-dose inhibition occurred for this group at 2000 ng/ml (the difference between output at 200 ng/ml and at 2000 ng/ml for malnourished children was significant, P < 0.001). Due to high dose inhibition in the malnourished group and to maximally stim-ulated production in control subjects, both
TNF-α
(pg/ml)
100,000
75,000
50,000
25,000
0
0.02 0.2 2 20 200 2000 LPS (ng/ml)
occurring at 2000 ng/ml, this LPS concentra-tion is the only one at which TNF-α produc-tion did not differ significantly between the two groups. These findings document that dose-response profiles covering a wide range of stimulus concentrations reveal differences that are undetectable when only single, maxi-mal doses are used.
Discussion
Despite a substantial and sustained im-provement in a number of health indicators beginning in the mid-70’s, especially infant mortality and prevalence of infectious and parasitic diseases (31), malnutrition remains an important problem in Brazil. However, the presentation of malnutrition may differ significantly depending on the country and the time of study. For instance, the use of the weight/height index to diagnose malnutri-tion in South American children has been disputed on the basis of the low incidence of wasting in this population regardless of age (20). In malnutrition due to chronic and sub-acute environmental conditions, a decrease in the height/age indices is more sensitive than a change in weight/height, even in In-dia, where changes in the latter indices are very conspicuous (22). Data from the pres-ent study confirm that the height/age index is a better parameter to be used to characterize malnutrition in Brazilian children. This indi-cates that malnutrition in today’s Brazilian children is predominantly due to chronic restriction of protein-calorie intake, which has a major impact on linear growth, espe-cially in the presence of repeated infectious episodes (32). This is consistent with the rarity of presentation of the classical pic-tures of marasmus and kwashiorkor in this population, in contrast to those described in other studies on cytokine production (7). On the other hand, our data failed to support the use of upper arm muscle area to evaluate malnutrition, since it is at variance with all the other anthropometric parameters used
here, which are highly correlated in this population.
The laboratory parameter most closely associated with malnutrition in the present study was disturbed production of TNF-α in whole blood culture. TNF-α induces ano-rexia and cachexia in humans and in animal models. Even though TNF-α has a pathoge-netic role in endotoxemia, autoimmunity and infection, its production is presumably ben-eficial to the host, because a) it is secreted by cells involved in natural immunity in re-sponse to a wide variety of microbial patho-gens and products, b) it stimulates phago-cytes and secretion of inflammatory media-tors and cytokines, and c) it is required for resistance to some infections (3,4,33,34). The evaluation of TNF-α production in mal-nourished children is important because a deficiency in TNF-α production may contri-bute to the immune deficits occurring in malnutrition; or, alternatively, excess pro-duction of TNF-α, by inducing anorexia and cachexia, may aggravate the nutritional sta-tus. This type of analysis must be carried out by studying cumulative production in whole blood cultures (27-29,35,36). This proce-dure avoids the complexities intrinsic to measurement of circulating TNF-α, which arise from its short plasma half-life, its inter-mittent release from several tissues, and its
in vivo binding to soluble TNF-α receptors, as well as from the need for extensive local production to reach important plasma con-centrations. However, this type of study re-quires a comparison of malnourished jects free of infection to normal control sub-jects who, apart from the nutritional status, closely resemble the study group.
mal-nourished children, but not in most healthy subjects (Figure 2), b) the induction of maxi-mal TNF-α production in the malnourished group by LPS concentrations 1/10 of those eliciting maximal production in the control group (Figure 5), and c) the statistically sig-nificant correlation between larger sponta-neous release and maximal stimulation by lower LPS concentrations. Furthermore, the ability to respond more intensely to LPS was detectable in malnourished children over a large concentration range (0.02-200 ng/ml). In both unstimulated and LPS-stimulated cultures, the absolute amounts of TNF-α
secreted by cells from malnourished chil-dren were very high. In contrast, the amounts of TNF-α produced by cells from healthy control children in the absence of LPS stim-ulation were very close to the values re-ported for healthy adults (27) using identical conditions, as well as the conditions reported in a study using a similar whole blood cul-ture system (28). This shows that our condi-tions for producing and measuring TNF-α
are comparable to those of other studies employing the same technique in other coun-tries. As an additional internal control, in the same assays from which the data reported here were derived we ran unrelated samples from other subjects (mostly septic patients), which yielded results strictly comparable to those reported in the literature (35). Finally, in a limited series of experiments, we meas-ured bioactivity of samples from both mal-nourished and control children. The results (not reported here) were compatible with the amounts detected by ELISA in either group. It remains to be established, however, to what extent such intense TNF-α secretion by cells from malnourished subjects depends on specific features of the whole blood cul-ture, such as the use of heparin (29) and dilution in culture medium (36), both of which have been reported to up-regulate
TNF-α production.
Taken together, the data presented here show that malnourished children are not
the other hand, direct comparison between the subjects studied by Doherty et al. (9) and ours is difficult since they used the Well-come classification while we used the Z score, which is strongly recommended by the WHO (22,23) and is being increasingly adopted because of its statistical soundness (37). A further factor may be the difference between wasting and stunting presentations, which differ in frequency among geographi-cally and ethnigeographi-cally distinct populations (20). In the present study, the presence of in-fectious and parasitic diseases, which favor TNF-α production, was ruled out on the basis of clinical and laboratory evaluation. Nevertheless, since increased “spontaneous” release of TNF-αin vitro as well as sensiti-zation to low LPS concentrations were de-tected in malnourished subjects, it is pos-sible that their blood cells had been primed
in vivo by exposure to microbial products, such as endotoxin absorbed from the gut flora, as reported by others (38,39). It is noteworthy, in this respect, that malnutrition is a risk factor for endotoxemia due to a combination of factors including bacterial superpopulation in the gut, atrophy of the
gastrointestinal mucosa, altered luminal con-tent of bile salts and free fatty acids, and abnormal clearance of absorbed endotoxin (38). One should keep in mind that these profiles reflect the potential for cytokine production by isolated cells in exvivo cul-ture (where nanogram amounts of TNF-α
can accumulate, especially after exposure to a strong stimulus), but do not imply that such levels occur in vivo. Therefore, future stud-ies should address the extent to which such priming results in increased levels of TNF-α in vivo, and what is the molecular mechan-ism of priming for increased synthesis ex vivo.
Acknowledgments
We are indebted to Dr. Paulo Boechat and the Department of Surgery, Institute Fer-nandes Figueira, FIOCRUZ, to Drs. Esther Zaborowski, Denise Barros, and Aurora Santos, and to Misses Selma Lima and Jalusy Almeida, CSGSF, FIOCRUZ, for access to patients and their families, expert assistance and laboratory studies.
References
1. Gross RL & Newberne PM (1980). Role of nutrition in immunologic function. Physiological Reviews, 60: 188-302.
2. Zaman K, Baqui AH, Yunus M, Sack RB, Chowdhury HR & Black RE (1997). Malnutrition, cell-mediated immune deficiency and acute upper respiratory infections in rural Bangladesh children. Acta Pae-diatrica, 86: 923-927.
3. Bazzoni F & Beutler B (1996). The tumor necrosis factor ligand and receptor families. New England Journal of Medicine, 334: 1717-1725.
4. Allison A & Eugui E (1995). Induction of cytokine formation by bacteria and their products. In: Brodgen KA, Roth JA, Stanton TB, Bolin CA, Minion FC & Wannemuehler MJ (Editors), Virulence Mechanisms of Bacterial Pathogens. 2nd edn. American Society for Microbiology, Washington, DC, USA.
5. Ling PR, Schwartz JH & Bistrian BR (1997). Mechanisms of host wasting induced by administration of cytokines in rats. American Journal of Physiology, 272: E333-E339.
6. Moldawer L, Andersson C, Gelin J & Lundholm KG (1988). Regula-tion of food intake and hepatic protein synthesis by recombinant derived cytokines. American Journal of Physiology, 254:
G450-G456.
7. Muñoz C, Arévalo M, López M & Schlesinger L (1994). Impaired interleukin-1 and tumor necrosis factor production in protein-calorie malnutrition. Nutrition Research, 14: 347-352.
8. Bhaskaram P & Sivakumar B (1986). Interleukin-1 in malnutrition. Archives of Disease in Children, 61: 182-185.
9. Doherty JF, Golden MH, Remick DG & Griffin GE (1994). Production and tumor necrosis factor-alpha in vitro is reduced in whole blood of severely malnourished children. Clinical Science, 86: 347-351. 10. Keenan RA, Moldawer LL, Yang RD, Kawamura I, Blackburn GL &
Bistrain BR (1982). An altered response by peripheral leukocytes to synthesize or release leukocyte endogenous mediator in critically ill, protein-malnourished patients. Journal of Laboratory and Clinical Medicine, 100: 844-857.
11. Vaisman N, Schattner A & Hahn T (1989). Tumor necrosis factor production during starvation. American Journal of Medicine, 87: 115.
of chronic disease. American Journal of Clinical Nutrition, 65: 876-882.
13. Bradley S, Vibhagool A, Kunkel SL & Kauffman CA (1989). Monokine secretion in aging and protein malnutrition. Journal of Leukocyte Biology, 45: 510-514.
14. Skerret SJ, Henderson WR & Martin TR (1990). Alveolar macro-phage function in rats with severe protein calorie malnutrition. Arachidonic acid metabolism, cytokine release and antimicrobial activity. Journal of Immunology, 144: 1052-1061.
15. Sauerwein RW, Mulder JA, Mulder L, Lowe B, Peshu N, Demacker PNM, van der Meer JWM & Marsh K (1997). Inflammatory media-tors in children with protein-energy malnutrition. American Journal of Clinical Nutrition, 65: 1534-1539.
16. Van Zee KJ, Kohno T, Fischer E, Rock CS, Moldawer LL & Lowry SF (1992). Tumor necrosis factor soluble receptors circulate during experimental and clinical inflammation and can protect against ex-cessive tumor necrosis factor α in vitro and in vivo. Proceedings of the National Academy of Sciences, USA, 89: 4845-4849.
17. Spinas GA, Keller U & Brockhaus M (1992). Release of soluble receptors for tumor necrosis factor (TNF) in relation to circulating TNF during experimental endotoxinemia. Journal of Clinical Investi-gation, 90: 533-536.
18. Shapiro L, Clark BD, Orencole SF, Poutsiaka DD, Granowitz EV & Dinarello CA (1993). Detection of tumor necrosis factor soluble receptor p55 in blood samples from healthy and endotoxemic hu-mans. Journal of Infectious Diseases, 16: 1344-1350.
19. Van Der Poll T, Jansen J, van Leenen D, von der Möhlen M, Levi M, ten Cate H, Gallati H, ten Cate JW & van Deventer SJH (1992). Release of soluble receptors for tumor necrosis factor in clinical sepsis and experimental endotoxemia. Journal of Infectious Dis-eases, 168: 955-960.
20. Victora CG (1992). The association between wasting and stunting: an international perspective. Journal of Nutrition, 122: 1105-1110. 21. Scuderi P, Sterling KE, Lam KS, Ryan KJ, Ray CG, Peterson E,
Slymen DJ & Salmon SE (1986). Raised serum levels of tumor necrosis factor in parasitic infections. Lancet, 2: 1364-1366. 22. World Health Organization (1995). Physical status: the use and
interpretation of anthropometry. WHO Technical Report Series, Geneva, Switzerland, 854-988.
23. World Health Organization (1986). Use and interpretation of anthro-pometric indicators of nutritional status. Bulletin of the World Health Organization, 64: 929-941.
24. Frisancho AR (1974). Triceps skin fold and upper arm muscle size norms for assessment of nutitional status. American Journal of Clinical Nutrition, 27: 1052-1058.
25. Frisancho AR (1981). New norms of upper limb fat and muscle areas for assessment of nutritional status. American Journal of Clinical Nutrition, 34: 2540-2545.
26. Frisancho AR (1990). Anthropometric Standards for the
Assess-ment of Growth and Nutritional Status. The University of Michigan Press, Ann Arbor, MI, USA, 9-64.
27. Warren HS, Amato SF, Fitting C, Black KN, Loiselle PM, Paternack MS & Cavaillon JM (1993). Assessment of ability of murine and human anti-lipid A monoclonal antibodies to bind and neutralize lipopolysaccharide. Journal of Experimental Medicine, 177: 89-97. 28. Wilson BM, Severn A, Rapson NT, Chana J & Hopkins P (1991). A
convenient human whole blood culture system for studying the regulation of tumor necrosis factor release by bacterial lipopolysac-charide. Journal of Immunological Methods, 139: 233-240. 29. Eggesbo JB, Hjermann I, Lund PK, Joo GB, Ovstebo R & Kierulf P
(1994). LPS-induced release of IL-1ß, IL-6, IL-8, TNF-α and sCD14 in whole blood and PBMC from persons with high or low levels of HDL-lipoprotein. Cytokine, 6: 521-529.
30. Ebel BE & Raffini L (2000). Hematology. In: Siperry GK & Iannone R (Editors), The Harriet Lane Handbook: A Manual for Pediatric House Officers. 15th edn. Mosby, St. Louis, MO, USA, 324-326. 31. Monteiro CA, Benício MHA & Freitas ICM (1997). Melhoria em
indicadores de saúde associados à pobreza no Brasil dos anos 90. Document obtained from the Internet at: [http://www.fsp.vsp.br/ ~nupens/],1-11. Accessed October, 1999.
32. Pesquisa Nacional sobre Demografia e Saúde (1996). Amamentação e Situação Nutricional de Mães e Crianças. Sociedade Civil Bem-Estar Familiar no Brasil (BEMFAM). Programa de Pesquisa de Demografia e Saúde (DHS). Macro-International Inc., DHS Program, Calverton, Huntingtown, MD, USA, 125-135.
33. Grell M (1996). Tumor necrosis factor (TNF) receptors in cellular signaling of soluble and membrane-expressed TNF. Journal of In-flammation, 47: 8-17.
34. Douni E, Akassoglou K, Alexopoulou L et al. (1996). Transgenic and knockout analyses of the role of TNF in immune regulation and disease pathogenesis. Journal of Inflammation, 47: 27-38. 35. Ertel W, Kremer JP, Kenney J, Steckholzer U, Jarrar D, Trentz O &
Schildberg FW (1995). Downregulation of pro-inflammatory cytokine release in whole blood from septic patients. Blood, 85: 1341-1347. 36. Mitov IG, Kropec A, Benzing A, Just H, Garotta G, Galanos C & Freundenberg M (1997). Differential cytokine production in stimu-lated blood cultures from intensive care patients with bacterial infections. Infection, 25: 206-212.
37. Sachdez HPS, Satyanarayana L, Kumar S & Puri RK (1992). Classifi-cation of nutritional status as “Z score” or percent of reference median - does it alter mortality prediction in malnourished children? International Journal of Epidemiology, 21: 916-921.
38. Klein K, Fuchs GJ, Kulapongs P, Mertz G, Suskind RM & Olson RE (1988). Endotoxemia in protein-energy malnutrition. Journal of Pedi-atric Gastroenterology and Nutrition, 7: 225-228.