ANA MARIA BEZERRA OLIVEIRA LOBO
FATTY ACID AND GLOBAL GENE EXPRESSION PROFILES IN BRAZILIAN HAIR SHEEP
Tese apresentada à Universidade Federal de Viçosa, como parte das exigências do Programa de Pós-Graduação em Genética e Melhoramento, para obtenção do título de Doctor Scientiae
VIÇOSA
ANA MARIA BEZERRA OLIVEIRA LOBO
FATTY ACID AND GLOBAL GENE EXPRESSION PROFILES IN BRAZILIAN HAIR SHEEP
Dissertação apresentada à Universidade Federal de Viçosa, como parte das exigências do Programa de Pós-Graduação em Genética e Melhoramento, para obtenção do título de
Doctor Scientiae.
APROVADA: 16 de dezembro de 2010.
Profª. Concepta M. M. Pimentel Prof. Fabyano Fonseca e Silva
Pesq. Marta F. Martins Guimarães Pesq. Samuel Rezende Paiva
ii “Se realmente estamos pensando em sermos os melhores, não há nada de errado nisso.
O problema é querer ser o maior. As pessoas que tentam ser as melhores, em todos os campos, vão para um lugar extremamente gratificante, que é o de ultrapassar barreiras,
ver seu esforço verdadeiro ser retribuído. Ser melhor implica disciplina, esforço, trabalho. Muitas pessoas querem ser maiores. O que normalmente implica atalho, mágica, se dar bem, tirar do caminho aqueles que são melhores. Esse sonho de ser o
maior é ilusório. Quem quer ser o maior vai descobrir a insignificância humana. Aqueles que continuam na busca da excelência verdadeira por meio do trabalho, do
estudo, não para o engrandecimento de si mesmos, mas para cumprir sua função existencial, para dar vazão aos seus dons – terão um retorno maravilhoso. O que você
conquistou em busca de sua melhor capacidade, isso é sagrado.”
iii AGRADECIMENTOS
À Universidade Federal de Viçosa e ao curso de Pós-Graduação em Genética e Melhoramento pela oportunidade de realização de um curso de alto reconhecimento.
Ao CNPq pela concessão da bolsa de estudos que tornou possível minha estadia em Viçosa.
À Embrapa Caprinos e Ovinos pelo financiamento desta pesquisa. E por ter me recebido como bolsista desde a iniciação científica.
Agradeço a minha orientadora, a professora Simone E. Facioni Guimarães; aos meus co-orientadores e aos membros da minha Banca de Tese - pelos ensinamentos, estímulo e colaborações que tornaram possíveis este trabalho.
iv CONTENTS
LIST OF FIGURES ... VII LIST OF TABLES ... IX LIST OF APPENDIX... XI RESUMO ...XIII ABSTRACT ...XV
1. FATTY ACID PROFILE ... 1
1.1. FATTY ACID PROFILE IMPORTANCE ... 1
1.2. STEAROYL-COA DESATURASE (SCD) AND TRANSCRIPTION FACTORS INVOLVED IN LIPID METABOLISM... 2
1.3. RELATIONS FATTY ACIDS AND MEAT QUALITY ... 4
1.4. REFERENCES ... 6
2. GENE EXPRESSION ANALYSIS ... 11
2.1. METHODOLOGY FOR ANALYSIS OF GENE EXPRESSION ON A LARGE SCALE - MICROARRAY... 12
2.2. GENE EXPRESSION ANALYSIS IN SHEEP USING MICROARRAY... 14
2.3. REFERENCES ... 16
CHAPTER I... 19
FATTY ACID PROFILE IN LONGISSIMUS DORSI OF LAMBS FROM FOUR GENETIC GROUPS RAISED ON IRRIGATED PASTURE... 19
v
1. INTRODUCTION ... 20
2. MATERIALS AND METHODS ... 22
2.1. ANIMALS AND DIETS ... 22
2.2. LIPID EXTRACTION, PROFILE DETERMINATION AND STATISTICAL ANALYSIS ... 22
3. RESULTS AND DISCUSSION... 23
4. CONCLUSION ... 32
5. REFERENCES ... 33
CHAPTER II ... 39
DIFFERENTIALLY TRANSCRIBED GENES IN SKELETAL MUSCLE OF LAMBS IN POSTNATAL GROWTH OF FOUR GENETIC GROUPS RAISED IN BRAZILIAN SEMI ARID ... 39
1. INTRODUCTION ... 40
2. MATERIAL AND METHODS ... 42
2.1. SAMPLING... 42
2.2. RNA ISOLATION AND LABELING... 43
2.3. MICROARRAY EXPERIMENT DESIGN ... 45
2.4. HYBRIDIZATION AND SCANNER ... 45
2.5. MICROARRAY DATA COLLECTION AND ANALYSIS ... 45
2.6. CORRELATION ANALYSIS ... 46
vi
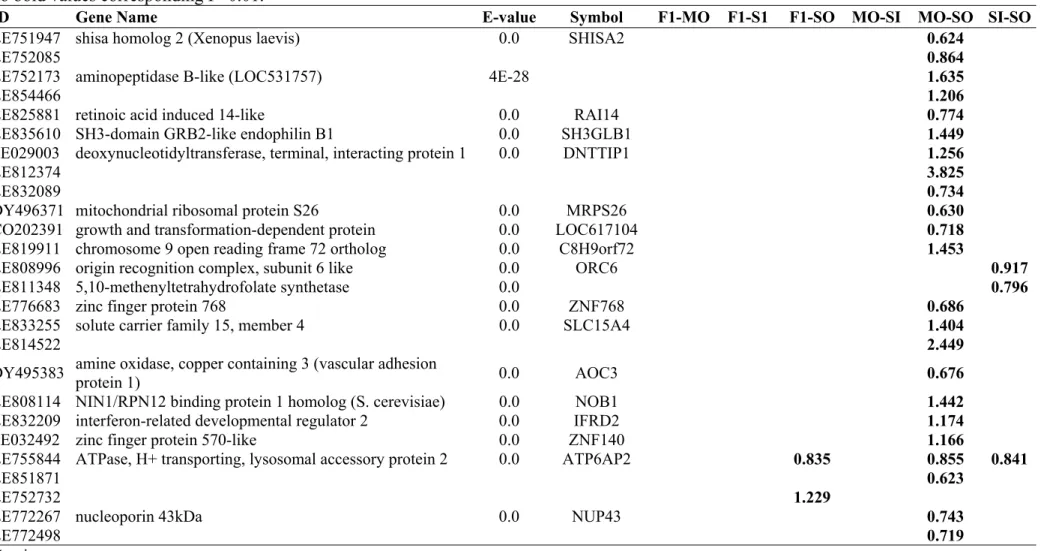
3.1. GENES DIFFERENTIALLY EXPRESSED IN COMPARISON MO-SO ... 48
3.2. GENES DIFFERENTIALLY EXPRESSED IN THE COMPARISONS F1-MO, F1-SO, F1-SI AND MO-SI ... 51
3.3. TRANSCRITS RELATED TO ENERGY AND CARBOHYDRATE METABOLISM... 53
3.4. GENES RELATED TO STRESS RESPONSE AND OTHERS ... 54
3.5. CLUSTER ANALYSIS... 56
3.6. CORRELATION BETWEEN AND PHENOTYPIC TRAITS ... 69
4. CONCLUSIONS ... 72
5. REFERENCES ... 75
vii LIST OF FIGURES
FIGURE 1. NUCLEAR MECHANISM FOR POLYUNSATURATED FATTY ACIDS (PUFA) REGULATION OF GENE EXPRESSION. FA, FATTY ACIDS; NF-Y, NUCLEAR FACTOR Y; PPAR, PEROXISOME PROLIFERATORS-ACTIVATED RECEPTOR; PPRE, PEROXISOME PROLIFERATOR-ACTIVATED RECEPTOR RESPONSE ELEMENT; SP1, STIMULATORY PROTEIN 1; SREBP-1, STEROL REGULATORY ELEMENT BINDING PROTEIN-1; TG, TRIGLYCERIDES. SOURCE: CLARKE, 2001. ... 4 FIGURE 2. SLIDE (A) MANUFACTURED BY AGILENT. THE PROBES ARE PRINTED IN SLIDE IN A DEFINED POSITION, SPOTS. THE SLIDE IS HYBRIDIZED TO A GASKET (B) CONTAINING THE BIOLOGICAL SAMPLE,
TARGET. SOURCE:
ix LIST OF TABLES
TABLE 1. LEAST-SQUARE MEANS FOR FATTY ACID COMPOSITION (% OF TOTAL) IN LONGISSIMUS DORSI OF ½ DORPER X ½ MORADA NOVA (F1), MORADA NOVA (MO), SANTA INÊS (SI) AND BRAZILIAN SOMALI (SO) LAMBS RAISED IN IRRIGATED PASTURE ... 25 TABLE 2. LEAST-SQUARE MEANS FOR FATTY ACID COMPOSITION (%) IN
x TABLE 7. SIGNIFICANT CORRELATIONS COEFFICIENTS AMONG THE EXPRESSION OF SOME GENES AND THE FATTY ACID COMPOSITION, CARCASS AND MEAT TRAITS OF LAMBS RAISED IN CULTIVATES PASTURE
xi LIST OF APPENDIX
APPENDIX 1. ELECTROPHEROGRAM – RNA INTEGRITY NUMBER (RIN) OF SOME SAMPLES USED IN THE SYNTHESIS OF RNA. ... 81
APPENDIX 2. MICROARRAYS DATA AFTER BACKGROUND CORRECTION AND NORMALIZATION. ... 82
APPENDIX 3. HEATMAP WITH 262 DIFFERENTIALLY EXPRESSED GENES. GENES THAT ARE EXPRESSED AT HIGHER LEVELS ARE ASSIGNED PROGRESSIVELY BRIGHTER OF WHITE IN THE GROUP, WHILE GENES EXPRESSED AT LOW LEVELS ARE ASSIGNED SHADES OF BLACK IN THE GROUP... 83
APPENDIX 4. HEATMAP WITH GENES DIFFERENTIALLY EXPRESSED IN THE COMPARISON F1-MO. GENES THAT ARE EXPRESSED AT HIGHER LEVELS ARE ASSIGNED PROGRESSIVELY BRIGHTER OF WHITE IN THE GROUP, WHILE GENES EXPRESSED AT LOW LEVELS ARE ASSIGNED SHADES OF BLACK IN THE GROUP. ... 84
APPENDIX 5. HEATMAP WITH GENES DIFFERENTIALLY EXPRESSED IN THE COMPARISON F1-SI. GENES THAT ARE EXPRESSED AT HIGHER LEVELS ARE ASSIGNED PROGRESSIVELY BRIGHTER OF WHITE IN THE GROUP, WHILE GENES EXPRESSED AT LOW LEVELS ARE ASSIGNED SHADES OF BLACK IN THE GROUP. ... 85
xii WHILE GENES EXPRESSED AT LOW LEVELS ARE ASSIGNED SHADES OF BLACK IN THE GROUP. ... 86
APPENDIX 7. HEATMAP WITH GENES DIFFERENTIALLY EXPRESSED IN THE COMPARISON MO-SI. GENES THAT ARE EXPRESSED AT HIGHER LEVELS ARE ASSIGNED PROGRESSIVELY BRIGHTER OF WHITE IN THE GROUP, WHILE GENES EXPRESSED AT LOW LEVELS ARE ASSIGNED SHADES OF BLACK IN THE GROUP. ... 87
APPENDIX 8. HEATMAP WITH GENES DIFFERENTIALLY EXPRESSED IN THE COMPARISON MO-SO. GENES THAT ARE EXPRESSED AT HIGHER LEVELS ARE ASSIGNED PROGRESSIVELY BRIGHTER OF WHITE IN THE GROUP, WHILE GENES EXPRESSED AT LOW LEVELS ARE ASSIGNED SHADES OF BLACK IN THE GROUP. ... 88
APPENDIX 9. HEATMAP WITH GENES DIFFERENTIALLY EXPRESSED IN THE COMPARISON SI-SO. GENES THAT ARE EXPRESSED AT HIGHER LEVELS ARE ASSIGNED PROGRESSIVELY BRIGHTER OF WHITE IN THE GROUP, WHILE GENES EXPRESSED AT LOW LEVELS ARE ASSIGNED SHADES OF BLACK IN THE GROUP. ... 89
xiii RESUMO
LOBO, Ana Maria Bezerra Oliveira, D.Sc., Universidade Federal de Viçosa, dezembro de 2010. Perfis de ácido graxo e de expressão gênica global em ovinos deslanados. Orientadora:Simone Eliza Facioni Guimarães. Co-orientadores: Samuel Rezende Paiva e Raimundo Nonato Braga Lobo.
xv ABSTRACT
LOBO, Ana Maria Bezerra Oliveira, D.Sc., Universidade Federal de Viçosa, december 2010. Fatty acid and global gene expression profiles in Brazilian hair sheep. Adviser: Simone Eliza Facioni Guimarães. Co-advisers: Samuel Rezende Paiva and Raimundo Nonato Braga Lobo.
1 GENERAL INTRODUCTION
1. Fatty acid profile
1.1. Fatty acid profile importance
Meat from ruminants is an important part of the human diet in many countries and fatty acids, being essential components of human diet, play an important role in metabolism and growth (Talpur 2007). Although there is evidence that saturated fatty acids increase serum cholesterol level in humans and thus contribute to various heart diseases, the monounsaturated and polyunsaturated fatty acids, including essential fatty acids, such as omega-3 (n-3), have beneficial effect in reducing cholesterol (Wood and Enser 1997). Therefore, the increased interest in enhancing the nutritional quality of the meat has stimulated research on manipulation of their fatty acid profiles through nutritional strategies (Diaz et al., 2011). This stimulation results from the demands of consumers in relation to meat quality, nutritional aspects of food that have been popularized in society. The study of lipid profile of meat from ruminants has been emphasized, due to the worldwide concern with the excessive consumption of unhealthy foods on human health.
2 Ruminant CLA isomers come from two sources: one from biohydrogenation in the rumen, produced during microbial biohydrogenation of dietary linoleic acid (LA; C18:2c9c12) and in the tissues through ∆9-desaturation (through of enzyme stearoyl-CoA desaturase; SCD) of the rumen-derived trans-vaccenic acid (Corl et al., 2001). However, lipids entering the rumen are acted on initially by microbial lipases, which hydrolyse ester linkages to form free or non-esterified fatty acids. Unsaturated fatty acids may then be acted on by rumen bacteria and the final product is ultimately stearic acid (C18:0). Some of the PUFAs and these intermediate products escape biohydrogenation and are incorporated into milk and body fat (Kepler et al., 1965).
In sheep, adipose tissue is the predominant site of fatty acid synthesis (lipogenesis), while the liver, rumen, abomasums and small intestine tissues combined contributed only 8% of the total fatty acids synthesized (Ingle et al., 1964). The fatty acids present in vertebrates are derived from de novo synthesis via acetate or absorbed through of diet in intestine.
Fatty acid composition of meat depends on production system and that the fat deposited is affected by several factors, such as breed, sex, age and nutrition (Smith et al., 2009). Generally the fatty acid composition in lamb meat is more favorable to human health when the animals are grazed in pasture than those fed in feedlot (Aurousseau et al., 2007). As stated by Mir et al. (2004), is necessary provides to animal an appropriate substrate to increase CLA content in muscle.
1.2. Stearoyl-CoA desaturase (SCD) and transcription factors involved in lipid
metabolism
3 9 and 10, hence its other name, delta-9 desaturase. This enzyme is responsible for some of the variation in CLA concentration in adipose tissues (Dervishi et al., 2010).
The expression of the SCD gene is regulated by dietary, especially PUFA n-6 and n-3 families, hormonal and environmental factors (Miyazaki et al., 2003) through the sterol regulatory element binding protein (SREBP; Horton et al., 2002) and peroxisome proliferator-activated receptor proteins (PPAR; Kersten et al., 2000). Thus three classes of transcriptions factors directly influence adipogenesis, they are: SREBP, PPAR and CCAAT/enhancer binding protein (C/EBP; Hirwa et al 2001). CCAAT/enhancer-binding protein (C/EBP) plays a key role in initiation of adipogenesis in adipose tissue and gluconeogenesis in liver.
4 Figure 1. Nuclear mechanism for polyunsaturated fatty acids (PUFA) regulation of gene expression. FA, fatty acids; NF-Y, nuclear factor Y; PPAR, peroxisome proliferators-activated receptor; PPRE, peroxisome proliferator-proliferators-activated receptor response element; Sp1, stimulatory protein 1; SREBP-1, sterol regulatory element binding protein-1; TG, triglycerides. Source: Clarke, 2001.
1.3. Relations fatty acids and meat quality
The analysis of fatty acids is important because they are involved in various “technological” aspects of meat quality. Because they have very different melting points, variation in fatty acid composition has an important effect on firmess or softness of the fat in meat, especially the subcutaneous and intermuscular (carcass fats) but also the intramuscular fat (marbling; Wood et al., 2003 and 2008).
5 increases with increases in dietary energy (Miller and Rice 1967; Field et al., 1978). 18:0 and 18:3 were positively correlated with overall appraisal for the grass fed lambs panel (subjective evaluation) and negatively correlated with the concentrate fed lambs panel (Sanudo et al., 2000). In cattle, the oleic acid was positively correlated with marbling score (Waldman et al., 1968) and flavor (Westerling and Hedrick, 1979).
The feeding system is one of the main factors affecting fatty acid composition in meat. Due to the particularities of the rumen, the manipulation of diet to improve fatty acid composition in meat of sheep is more difficult than in pigs, for example. Lambs fed the high energy diet had softer, yellower fat than lambs fed the low energy diet (Garton et al., 1972). Fat from lambs fed the low energy diet had higher levels of all the even-numbered fatty acids, except 12:0, while lambs fed the high energy diet had higher levels of all odd-numbered and branched chain fatty acids. The total concentration of branched chain fatty acids is a predictor of lamb fat firmness. It is known that high grain diets will increase levels of circulating propionate in lambs, and it is probable that such diets will increase the level of methylmalonate, a metabolite of proprionate (Busboom et al., 1981).
6 1.4. References
Aurousseau, B., Bauchart, D., Faure, X., Galot, A. L., Prache, S. (2007). Indoor fattening of lambs raised on pasture: (1) Influence of stall finishing duration on lipid classes and fatty acids in the longissimus thoracis muscle. Meat Science, 76, 241-252. Busboom, J. R., Miller, G. J., Field, R. A., Crouse, J. D., Riley, M. L., Nelms, G. E., Ferrell, C. L. (1981). Characteristics of fat from heavy ram and wether lambs. Journal of Animal Science, 52, 83–92.
Carta, A., Casu, S., Usai, M. G, Addis, M., Fiori, M., et al. (2008). Investigating the genetic component of fatty acid content in sheep milk. Small Ruminant Research, 79, 22-28.
Christie, W. W. (1981). Lipid metabolism in ruminant animals. 1st ed. Oxford: Pergamon Press. Oxford, New York, 452 p.
Clarke, S. D. (2001). Polyunsaturated fatty acid regulation of gene transcription: a molecular mechanism to improve the metabolic syndrome. The Journal of Nutrition, 131, 1129-1132.
Corl, B. A., Baumgard, L. H., Dwyer, D. A., Griinari, J. M. et al., The role of Delta(9)-desaturase in the production of cis-9, trans-11 CLA. (2001). The Journal of Nutricional Biochemistry, 12, 622–630.
7 Desvergne, B., and Wahli, W. (1999). Peroxisome proliferator activated receptors nuclear control of metabolism. Endocrine Reviews, 20, 649–688.
Dreyer, C., Keller, H., Mahfoudi, A., Laud, V., Krey, G., Wahli, W. (1993). Positive regulation of the peroxisomal betaoxidation pathway by fatty acids through activation of peroxisome proliferator-activated receptors (PPAR). Biology of the Cell, 77, 67–76. Diaz, M. T., Cañeque, V., Sánchez, C. I., Lauzurica, S., Pérez, C. et al. (2011). Nutricional and sensory aspects of Light lamb meta enriched in n-3 fatty acids during refrigerated storage. Food Chemistry, 124, 147-155.
Field, R. A., J, C. Williams, C. L. Ferrell, J. D. Crouse and J. E. Kunsman. 1978. Dietary alterations of palatability and fatty acids in meat from light and heavy weight ram lambs. Journal of Animal Science, 47, 858-864.
Flux, C.L. (2005). The effect of conjugated linoleic acid on lipid metabolism in the hamster and the sheep. PhD thesis, University of Nottingham, 241 p. [http://etheses.nottingham.ac.uk/1141/]
Garton, G. A., Hovell, F. D., Duncan, W. R. (1972). Influence of dietary volatile fatty acids on the fatty acid composition of lamb triglycerides, with special reference to the effect of propionate on the presence of branched chain components. The British Journal of Nutrition, 28, 409-416.
Hirwa, C.d’Andre., Wallace, P., Xu Shen, Qinghua Nie, Guanfu Yang, Xiquan Zhang. 2010. Genes Related to Economically Important Traits in Beef Cattle. Asian Journal of Animal Science, 5, 34-35.
8 Ingle, D. I., Bauman, D. E. and Garrigus, U. S. (1964). Lipogenesis in the ruminant: in vivo Site of fatty acid synthesis in sheep. The Journal of Nutrition, 102, 617-624.
Ip, C., Scimeca, J. A and Thompson, H. J. (1994). Conjugated linoleic acid—A powerful anticarcinogen from animal fat sources. Cancer, 74, 1050-1054.
Kepler, C. R., Hirons, K. P., Mcneill, J.J., Tove, S. B. (1965). Intermediates and products of the biohydrogenation of linoleic acid by butyrivibrio fibrisolvens. The Journal of Biological Chemistry, 241, 1350-1354.
Kersten, S., Desvergne, B., Wahli, W. (2000). Roles of PPARs in health and disease.
Nature, 405, 421-424.
Kuchel, H., Siebert, B. D., Bottema, C. D. K., Webb, G. C., Crawfort, A. M., Duncan, S. J. (2004). Physical mapping of the stearoyl-CoA desaturase (SCD) locus in sheep.
Animal Genetics, 35, 142-167.
McGuire, M. A. and McGuire, M. K. (2000). Conjugated linoleic acid (CLA): a ruminant fatty acid with beneficial effects on human health. Journal of Animal Science, 77, 1-8.
Miller, G. J. and R. W. Rice. (1967). Lipid metabolism in lambs as affected by fattening rations of roughage and concentrate. Journal of Animal Science, 26, 1153-1159.
Mir, P. S., McAllister, T. A., Scott, S., Aalhus, J., Baron, V., et al. (2004). Conjugated linoleic acid-enriched beef production. The American Journal of Clinical Nutrition, 79, 1207S-1211S.
9 Sañudo, C., Enser, M. E., Campo, M. M., Nute, G. R., María, G., Sierra, I., Wood, J. D. (2000). Fatty acid composition and sensory characteristics of lamb carcasses from Britain and Spain. Meat Science, 54, 339-346.
Sirtori, F., Dal Prà, A., Brajon, G., Pugliese, C., Bozzi, R. (2009). Meat quality of Suffolk and bergamasca lambs slaughtered at 90 days of age. Italian Journal of Animal Science, 8, 546-548.
Smith, S. B., Gill, C. A., Lunt, D. K., Brooks, M. A. (2009). Regulation of fat and fatty acid composition in beef cattle. Asian-Australasian Journal of Animal Sciences, 22, 1225-1233.
Steinhart, C. (1996). Conjugated linoleic acid – the good news about animal fat. Journal of Chemical Education, 73, A302-303.
Talpur, F. N. (2007). Fatty acid composition of ruminant milk, meat and dairy products of livestock in Sindh, Pakistan. Ph.D Thesis, University of Sindh, Jamshoro – Pakistan. http://eprints.hec.gov.pk/2137/1/2054.htm.
Tonotoz, P., Hu, E., Speigelman, B. M. (1995). Regulation of adipocyte gene expression and differentiation by PPARgamma. Current Opinion in Genetics and Development, 5, 571–576.
Wahli, W., Braissant, O., Desvergne, B. (1995). Peroxisome proliferator-activated receptors: Transcriptional regulators 174 of adipogenesis, lipid metabolism and more. Chemistry and Biology, 2, 261–266.
10 Wang, Y., Mu, Y., Li, H., Ding, N., Wang, Q. et al. (2008). Peroxisome
proliferator-activated receptor- gene: a key regulator of adipocyte differentiation in chickens.
Poltry Science, 87, 226-232.
Westerling, D. B. and Hedrick, H. B. (1979). Fatty acid composition of bovine lipids as influenced by diet, sex and anatomical location and relationship to sensory characteristics. Journal of Animal Science, 48, 1343-1348.
Wood, J. D. and Enser, M. (1997). Factors influencing fatty acids in meat and the role of antioxidants in improving meat quality. British Journal of Nutrition, 78, Suppl. 1, S49-S60.
Wood, J. D., Richardson, R. I., Nute, G. R., Fisher, A. V., Campo, M. M., Kasapidou, E., et al. (2003). Effects of fatty acids on meat quality: a review. Meat Science, 66, 21-32.
Wood, J. D, Enser, M., Fisher, A. V., Nute, G. R., Sheard, P. R., et al. (2008). Fat deposition, fatty acid composition and meat quality: A review. Meat Science, 78, 343-358.
11 2. Gene expression analysis
Recent changes in meat sheep production in Brazil, has stimulated the growth of activity and scientific research. Such research has focused largely on improving the productivity of livestock (Lôbo et al., 2009; Barbosa Neto et al., 2010; Oliveira et al., 2010), as well as quality and quantity of final product, the meat (Bonagurio et al., 2003; Madruga et al., 2005; Cartaxo et al., 2008). In other livestock sectors, meat-producing industries have invested in research, looking for better understanding the physiological and molecular pathways associated with skeletal muscle growth and development (Reecy et al., 2006).
Physiological changes occurring during the different stages of productive life, such as growth and tissue differentiation, exposure to different environmental factors such as nutritional factors, drugs, stress and pathogens, determine changes in gene expression patterns. Gene expression refers to the process in which a gene is used in the construction of a protein or to control the expression of other genes. In a typical cell, about 10,000 to 20,000 genes are expressed simultaneously. The level of gene expression is a number that measures the amount of protein produced (Albert et al. 2002). The techniques for analyze gene expression consist mainly in analysis of RNA obtained during the transcription, enabling to study the "commands" active in different biological states.
12 novel candidate genes and physiological pathways to target in future hypothesis-based testing (Reecy et al., 2006).
2.1. Methodology for analysis of gene expression on a large scale - Microarray
Microarray technology was introduced over a decade by Schena et al. (1995) and since then the high-density microarrays has enabled the rapid expansion of gene expression analysis. These microarrays to measure gene expression based on the intensity of the probe that corresponds to the amount of target RNA. It considers the number of mRNA molecules transcribed from a particular gene, can be considered as an approximation to the level of expression of this gene.
13 Schematically, a gene expression microarray experiment works as follows: mRNA is extracted from a sample, converted into cDNA ou cRNA, labeled with a fluorescent dye and hybridized to a platform (slide) harboring probes corresponding to genes of interest arranged in a coded template (the array; Figure 2). When the one-color platforms are used, a single sample is labeled and hybridized in each array, while in two-color platforms a pair of samples is labeled with two fluorescent dyes, such as Cy3 and Cy5 and simultaneously hybridized into array. When the microarray is scanned by a laser with a specific wavelength, the hybridized cDNA or cRNA emits fluorescence. The raw intensities of the fluorescence give an estimation of the level of gene expression (Pariset et al., 2009 and Rosa et al., 2007 are recommended readings). The underlying theory is that the greater the expression of a transcript, the greater the amount of labeled target and, hence, the greater the output signal. (Hiendleder et al., 2005).
According Schulze and Downward (2001) the microarrays can be used to investigate problems in cell biology in various manners. The different experimental approaches fall between two extremes. At one end, the investigator is interested only in finding the single change in gene expression that might be the key to a given alteration in phenotype. The authors emphasize that this is equivalent to looking for a needle in a haystack, and could be thought of as an entirely local approach to analysis of gene-expression changes. At the other extreme, the aim is to look at overall patterns of gene expression in order to understand the architecture of genetic regulatory networks, a global approach that could ultimately lead to complete description of the transcription-control mechanisms in a cell.
14 al. 2004; de Hoon et al., 2003; Shmulevich et al., 2003) and related with metabolic processes (de la Fuente et al., 2002; Mendes, 2001). In sheep, Vacuolo et al. (2007) proposed after analysis of gene expression by microarray, a model depicting the regulatory network and the main epigenetic modifications likely explain the changes in fiber types and hypertrophy that characterizes the Callipyge phenotype. Bongiorni et al. (2009) performed the KEGG www.genome.jp/kegg/pathway.html) pathways among the differentially expressed genes in two milk sheep breeds and identified the molecular differences in milk synthesis in two lactation stages.
2.2. Gene expression analysis in Sheep using Microarray
The volume of publications using the microarray technology for analyze gene expression is not significant in sheep. The main searches are designs to evaluate the resistance to gastrointestinal parasites using bovine cDNA microarray (Diez-Tascon, 2005; Mackinnon et al. (2009). Keane et al. (2006) constructed cDNA libraries from tissue of the duodenum of sheep to generate ESTs. From these sequences, the authors constructed a microarray, called Ovita ovine array (University of Otago Genomics Facility) for analyze the resistance to gastrointestinal nematodes. Bongiorni et al. (2009) built a microarray from sequences deposited in public databases to investigate the expression profile in lactating ewes of different breeds.
15 the microarray in a maskless manufacturing process, using standard DNA phosphoramidite chemistry (Beaucage and Caruthers, 1981).
The Sheep Oligo Microarray (Platform GPL10427 - http://www.ncbi.nlm.nih.gov/geo/query/acc.cgi?acc=GPL10427) used in the present study is produced using SurePrint inkjet technology. The Sheep Oligo Microarray have 15,744 sequences from public databases, which contain resources to access well-characterized genes and expressed sequence tags (ESTs) representative of genes of unknown function. About 14,600 sequences in microarray represent the ovine transcriptome. In species where the genome sequences are known, many anonymous sequences have been deposited in gene banks as a result of EST sequencing projects. Thus, the databases represent valuable knowledge that can be exploited by bioinformatics efforts to build species-specific microarray (Pariset et al. 2009).
(A) (B)
Figure 2. Slide (A) manufactured by Agilent. The probes are printed in slide in a defined position, spots. The slide is hybridized to a gasket (B) containing the biological sample,
16 2.3. References
Alba, R., Fei, Z., Payton, P., Liu, Y., Moore, S. L., Debbie P., Cohn Jonathan, et al. (2004). ESTs, cDNA microarrays, and gene expression profiling: tools for dissecting plant physiology and development. Plant Journal, 39, 697-714.
Albert, B., Johnson, A., Lewis, J., Raff, M., Roberts, K., Walter, P. 2002. Molecular Biology of the Cell, 4th ed. New York: Garland Science.
Barbosa Neto, A. C., Oliveira, S. M. P., Facó, O., Lobo, R. N. B. (2010). Efeitos genéticos aditivos e não-aditivos em características de crescimento, reprodutivas e
habilidade materna em ovinos das raças Santa Inês, Somalis Brasileira, Dorper e Poll
Dorset. Revista Brasileira de Zootecnia, 39, 1943-1951.
Beaucage, S. L. and Caruthers, M. H. (1981). Deoxynucleoside phosphoramidites – a new class of key intermediates for deoxypolynucleotide synthesis. Tetrahedron Lett, 22, 1859-1862.
Bonagurio, S., Pérez, J. R. O., Garcia, I. F. F., Bressan, C., Lemos, A. L. S. C. (2003). Qualidade da carne de cordeiros Santa Inês puros e mestiços com Texel abatidos com diferentes pesos. Revista Brasileira de Zootecnia, 32, 1981-1991.
Bongiorni, S., Chillemi, G., Prosperini, G., Bueno, S., Valentini, A., Pariste, L. (2009). A Tool for Sheep Product Quality: Custom Microarrays from Public Databases.
Nutrients, 1, 235-250.
Cartaxo, F. Q., Sousa, W. H., Cezar, M. F., Gonzaga Neto, S., Cunha, M. G. G. (2008). Efeitos do genótipo e da condição corporal sobre o desempenho de cordeiros terminados
em confinamento. Revista Brasileira de Zootecnia, 37, 1483-1489.
17 involved with nematode parasite resistance in sheep. Physiological Genomics, 21, 59– 69.
Hiendleder, S., Bauersachs, S., Boulesteix, A., Blum, H., Arnold, G. J., Fröhlich, T., Wolf, E. (2005). Functional genomics: tools for improving farm animal health and welfare. Revue Scientifique et Technique Office International des Epizooties, 24, 354-377.
Lôbo, A. M .B. O., Lôbo, R. N. B., Paiva, S. R., Oliveira, S. M. P., Facó, O. (2009).
Genetic parameters for growth, reproductive and maternal traits in a multibreed meat
sheep population. Genetics and Molecular Biology, 32, 761-770.
Keane, O. M., Zadissa, A., Wilson, T., Hyndman, D. L., et al. (2006). Gene expression profiling of Naïve sheep genetically resistant and susceptible to gastrointestinal nematodes. BMC Genomics, 7, 1-12.
MacKinnon, K. M., Burton, J. L., Zajac, A. M., Notter, D. R. (2009). Microarray analysis reveals difference in gene expression profiles of hair and wool sheep infected with Haemonchus contortus. Veterinary Immunology and Immunopathology, 130, 210-220.
Madruga, M. S., Sousa, W. H., Rosales, M. D., Cunha, M. G. G., Ramos, J. L. F.
(2005). Qualidade da carne de cordeiros Santa Inês terminados com diferentes dietas.
Revista Brasileira de Zootecnia, 34, 309-315.
18 Reecy, J. M., Spurlock, D. M., Stahl, C. H. (2006). Gene expression profiling: insights into skeletal muscle growth and development. Journal of Animal Science, 84, E150-E154.
Rosa, G. J. M., Rocha, L. B., Furlan, L. R. (2007). Estudos de expressão gênica utilizando-se microarrays: delineamento, análise, e aplicações na pesquisa zootécnica. Revista Brasileira de Zootecnia, 36, 185-209.
Schena, M., Shalon, D., Davis, R. W., Brown, P. O. (1995). Quantitative monitoring of gene expression patterns with a complementary DNA microarray. Science, 270, 467– 470.
Schulze, A., Downward, J. (2001). Navigating gene expression using microarrays – a technology review. Nat. Cell Biol.,3, E190-E195.
Oliveira, K. A. P., Lobo, R. N. B., Facó, O. (2010). Genetic evaluation of partial growth trajectory of Santa Inês breed using random regression models. Revista Brasileira de
Zootecnia, 39, 1029-1036.
19 CHAPTER I
(ARTICLE I)
Fatty acid profile in Longissimus dorsi of lambs from four genetic groups raised on
irrigated pasture
A.M.B.O. Lôboa*, S.E.F. Guimarãesa, S.R. Paivac, M.A.D. Bomfimb, O. Facób, G. A. Fernandes Júniord, M. F. Poncianob, R.N.B. Lôbob
a
Universidade Federal de Viçosa, Avenida Peter Henry Rolfs, s/n, Viçosa, MG, 36570-000, Brazil
b
Embrapa Caprinos e Ovinos, Caixa Postal 145, Sobral, CE, 62010-970, Brazil c
Embrapa Recursos Genéticos e Biotecnologia, Caixa Postal 02372, Brasília, DF,
70770-917, Brazil
d
Universidade Federal do Ceará, Avenida da Universidade, 2853, Fortaleza, CE,
60020-181, Brazil
*Corresponding author. Tel./ Fax: +55 88 3112 7487
E-mail address: [email protected]/[email protected]
Brazilian Agricultural Research Corporation - Goats and Sheep Fazenda Três Lagoas - Estrada Sobral Groaíras, Km 4
Caixa Postal 145 - CEP 62010-970 - Sobral - CE - Brazil
Abstract
20 during the same season from a single birth and weaned with an average age of 84 d were used in this study to evaluate fatty acid profiles in the Longissimus dorsi muscle. The lambs were raised on irrigated pasture and supplemented once a day with concentrate. The lambs average age and weight at slaughter were 200.18±7.54 d and 20.62±3.46 kg, respectively. The MO breed presented the highest values of CLA, PUFA and P:S. MO and F1 lambs had meat with a higher proportion of essential fatty acids (EFA). The atherogenic index and relative activity of the enzyme desaturase were similar in F1, MO and SI lambs. The SO breed showed a less desirable fatty acid profile of from a human health standpoint. Genetic differences among the groups studied were responsible for the differences in the fatty acid profiles.
Keywords: atherogenic index,CLA, desaturase, hair sheep, lipids, meat quality
1. Introduction
21 isomers are produced in the rumen during microbial biohydrogenation of dietary linoleic acid (LA; C18:2c9c12) and in tissues through ∆9-desaturation of the rumen-derived trans-vaccenic acid (trans-11–18:1; Griinari et al., 2000; Palmquist et al., 2004; Corl et al., 2001).
The distribution of CLA isomers in cheese and/or meat shows one major isomer C18:2 c9t11 (CLA9, known as rumenic acid) with nearly 84% total CLA (Steinhart, et al., 2003; and for details, Eder and Ringseis, 2010). However, the fatty acid composition of meat depends fundamentally on the composition of the diet of the animal (Enser et al., 1998). Sãnudo et al. (2000) demonstrated that the production system affects muscle fatty acid composition and the flavor of lamb meat (Spanish and British breeds). Breed, sex and nutrition are factors that affect the levels of deposited fat (Rumsey et al., 1972; Melton et al., 1982; Eichhorn et al., 1986; Huerta-Liedenz et al., 1993; Zembayashi et al., 1995).
22 ½ Morada Nova crossbreeds raised in a production system with irrigated pasture in a semi-arid region of Brazil.
2. Materials and methods
2.1. Animals and diets
The experiment was carried out using the experimental flock of Embrapa Caprinos e Ovinos, Sobral, CE – Brazil. Thirty-four unrelated male lambs of the Morada Nova (MN, n=6), Brazilian Somali (SO, n=7) and Santa Inês (SI, n=13) breeds and ½ Dorper x ½ Morada Nova (F1, n=8) crossbreeds born in the same season from a single birth and weaned at an average age of 84 days of age were used in this study. The lambs were raised on irrigated pasture composed of Tanzania grass (Panicum maximun Jacq cv. Tanzania) with free access to water and mineral salt. The lambs were free to graze and were supplemented once a day with concentrate (corn and soybean meal) at a rate of 1.5% body weight. The lambs were slaughtered at Embrapa Caprinos e Ovinos facilities at an average age and weight of 200.18±7.54 days of age and 20.62±3.46 kg, respectively. A 5-cm length of Longissimus dorsi was removed from one side of each carcass. All samples were vacuum-packed, frozen rapidly and stored at -20°C.
2.2. Lipid extraction, profile determination and statistical analysis
23 min (35 x g). After the addition of 10 mg sodium sulfatemonohydrate, the vial was recapped, mixed again for 2 min and centrifuged at same speed for 1 min. The clear supernatant was used for gas chromatography analysis.
The fatty acid profile was determined by gas chromatography according to model modified from Chilliard et al. (2006) under the following conditions: column, SP 2560 (100 m x 0.25 mm x 0.25 μm) - Supelco; patterns, Supelco 37 - Component FAME Mix (10000 μg in CH2Cl2) - Supelco cat. 47885-U, linoleic conjugated acid methyl ester - SIGMA Cat. O5632; flow of gas, injection in the split mode (1:100), 1 μL of sample, carrier gas - hydrogen (30 mL/min), synthetic air - 300 mL/min; programming temperature, temperature of injector and detector (FID) - 250°C; initial temperature - 70°C, held for 1 min; increase at 5°C/min to 100°C, held for 2 minutes; increase at 10°C/min up to 175°C, held for 40 minutes; increase at 5°C/min up to 225ºC; increase at 20°C/min to 245°C, held for 20 minutes; total run - 87.50 minutes. The analyses were performed in the Animal Nutrition Laboratory of Embrapa Caprinos e Ovinos.
The data were analyzed as a completely randomized design with a model that included breed effects and experimental error by the least-squares method using the GLM procedure of SAS Institute, Inc. (1999). The atherogenic index, calculated as (C12:0+(4*C14:0)+C16:0)/total unsaturated fatty acids (Chilliard et al., 2003), and the indices used to predict the activity of fatty acid desaturase (C18:1n9c/C18:0 and C16:1/C16:0) were also evaluated.
3. Results and Discussion
24 genetic groups were C18:1n9c (oleic acid - 28%), C18:0 (estearic acid - 25%) and C16:0 (palmitic - 24%), which represented approximately 77% of the total. Similar percentages of oleic, estearic and palmitic acids were reported in meat from culled ewes (Pelegrini et al., 2007) and lambs grazed on pasture (Enser et al., 1998). These three are the predominant fatty acids in the meat of ruminants. In general, the results demonstrated the significant effect of breed type on fatty acid profile. This effect has been well reported in the literature (Fisher et al., 2000; Choi et al., 2000; Warren et al., 2008).
25 Table 1. Least-square means for fatty acid composition (% of total) in Longissimus dorsi of ½ Dorper x ½ Morada Nova (F1), Morada Nova (MO), Santa Inês (SI) and Brazilian Somali (SO) lambs raised in irrigated pasture
Genetic groups
Fatty acids F1 MO SI SO
Capricacid (C10:0) 0.07 b 0.00 b 0.06 b 0.27 a
Lauricacid (C12:0) 1.71 a 2.56 a 2.28 a 3.22 a
Myristicacid (C14:0 ) 2.10 b 2.12 b 2.31 b 4.57 a
Myristoleic acid (C14:1) 0.00 a 0.00 a 0.04 a 0.03 a
Pentadecanoicacid (C15:0) 0.52 a 0.49 a 0.50 a 0.82 a
Palmiticacid (C16:0) 24.31 ab 23.48 b 23.20 b 27.39 a
Palmitoleicacid (C16:1) 0.66 b 0.61 b 0.65 b 1.20 a
Palmitoleate (C16:1n7) 0.00 a 0.00 a 0.08 a 0.00 a
Heptadecanoicacid (C17:0) 1.51 a 1.58 a 1.50 a 1.71 a
cis-10Heptadecanoicacid (C17:1) 0.09 a 0.04 a 1.80 a 0.18 a
Stearicacid (C18:0) 28.05 a 25.38 ab 26.57 a 20.80 b
Elaidicacid (C18:1n9t) 1.87 a 2.01 a 5.14 a 1.59 a
Oleicacid (C18:1n9c) 29.23 ab 25.80 ab 24.14 b 31.28 a
Linolelaidicacid (C18:2n6t) 0.00 a 0.00 a 0.32 a 0.02 a
Linoleicacid (C18:2n6c) 6.14 ab 10.12 a 5.16 b 3.74 b
CLA – Conjugated linoleic acid (C18:2c9T11) 0.40 b 1.28 a 0.39 b 0.57 b
Linolenicacid (C18:3n3) 0.50 a 0.47 a 0.50 a 0.31 a
Gamma-linolenic acid (C18:3n6) 0.02 a 1.22 a 0.08 a 0.02 a
Eicosenoicacid (C20:1) 0.00 a 0.00 a 0.03 a 0.00 a
cis-11, 14, 17 Eicosatrienoic acid (C20:3n3) 0.00 a 0.00 a 0.04 a 0.00 a
cis-8, 11, 14 Eicosatrienoicacid (C20:3n6) 0.00 a 0.00 a 0.01 a 0.00 a
Arachidonicacid (C20:4n6) 2.00 a 2.29 a 1.36 a 1.05 a
Eicosapentaenoicacid (C20:5n3) 0.11 a 0.33 a 0.05 a 0.00 a
Behenicacid (C22:0) 0.00 a 0.00 a 0.01 a 0.00 a
Adrenicacid (C22:4n6) 0.00 a 0.00 a 0.01 a 0.02 a
Docosahexaenoic acid (C22:6n3) 0.00 a 0.00 a 0.01 a 0.00 a
Lignocericacid (C24:0) 0.02 ab 0.08 ab 0.00 b 0.26 a
26 Table 2. Least-square means for fatty acid composition (%) in Longissimus dorsi of ½ Dorper x ½ Morada Nova (F1), Morada Nova (MO), Santa Inês (SI) and Brazilian Somali (SO) lambs raised on irrigated pasture according to classification of saturation
Genetic groups
F1 MO SI SO Mean ± SD
SFA 58.31 ± 3.18 a 55.69 ± 3.18a 56.45 ± 2.16 a 59.04 ± 2.76 a 56.93 ± 7.70 MUFA 31.86 ± 3.39 a 28.47 ± 3.39 a 31.90 ± 2.31 a 34.28 ± 2.94 a 31.79 ± 8.02 PUFA 9.19 ± 1.97 ab 15.71 ± 1.97 a 7.94 ± 1.33 b 5.75 ± 1.70 b 9.50 ± 6.21 UFA 41.05 ± 3.30 a 44.18 ± 3.30 a 39.84 ± 2.24 a 40.03 ± 2.86 a 41.30 ± 7.11 UFA/SFA 0.71 ± 0.12 a 0.82 ± 0.12 a 0.75 ± 0.08 a 0.69 ± 0.10 a 0.75 ± 0.28 P:S 0.16 ± 0.04 ab 0.30 ± 0.04 a 0.14 ± 0.03 b 0.09 ± 0.03 b 0.17 ± 0.13 n6 8,16 ± 3,91 ab 13,63 ± 7,37 a 6,95 ± 4,21 b 4,86 ± 2,06 b 8,29 ± 5,69 n3 0,61 ± 0,43 a 0,80 ± 0,72 a 0,61 ± 0,50 a 0,31 ± 0,38 a 0,58 ± 0,51 n-6/n-3 12.30 ± 1.80 a 11.86 ± 2.01 a 7.07 ± 1.34 a 6.89 ± 2.01 a 9.80 ± 5.56 EFA 6,64 ± 2,46 ab 10,59 ± 5,83 a 5,65 ± 3,39 b 4,05 ± 1,53 b 6,56 ± 4,14 IA 0,86 ± 0,28 b 0,82 ± 0,36 b 0,92 ± 0,22 b 1,24 ± 0,31 a 0,95 ± 0,32 C18:1n9c/C18:0 1,06 ± 0,30 b 1,04 ± 0,27 b 0,87 ± 0,40 b 1,55 ± 0,37 a 1,11 ± 0,43 C16:1/C16:0 0,03 ± 0,00 b 0,03 ± 0,00 b 0,03 ± 0,01 b 0,04 ± 0,02 a 0,03 ± 0,01 Means followed by different letter in the row are statistically different by t test (P<0.05);
SFA = C10:0 + C12:0 + C14:0 + C15:0 + C16:0 + C17:0 + C18:0 + C22:0 + C24:0; SFA was analyzed as SFA²;
MUFA = C14:1 + C16:1 + C16:1n7 + C17:1 + C18:1n9t + C18:1n9c + C20:1;
PUFA = C18:2n6t + C18:2n6c + C18:3n6 + C18:2c9T11 + C18:3n3 + C20:3n6 + C20:3n3 + C20:4n6 + C20:5n3 + C22:4n6 + C22:6n3; PUFA was analyzed as log10(PUFA);
UFA (total unsaturated fatty acids) = MUFA + PUFA; It was analyzed as 1/UFA; P:S = PUFA/SFA; P:S was analyzed as log10(P:S);
n-6 = C18:2n6t + C18:2n6c + C18:3n6 + C20:3n6 + C20:4n6 + C22:4n6; n6 analyzed as log10(n6); n-3 = C18:3n3 + C20:3n3 + C20:5n3 + C22:6n3; n3 analyzed as log10(n3+0.1);
n-6/n-3 was analyzed as log10(n-6/n-3);
EFA = C18:3n3 + C18:2n6c; analyzed as sqrt(EFA+0.1); IA = (C12:0 + (4*C14:0) + C16:0)/ UFA;
27 SO animals showed higher percentages of palmitic acid (C16:0) than those of the SI and MN breeds and had similar percentages to F1 animals. This similarity can be explained as the F1 is ½ Dorper, and the Dorper breed is ancestrally linked to the BlackHead Persian, the same breed that originated the SO in Brazil. Palmitic acid is one of the more common monounsaturated fatty acids present in animal tissues.
Higher percentages of myristic acid (C14:0) were also observed in the SO breed compared to the other genetic groups. SO is a fat-tailed breed that accumulates fat in its tail as a reserve for use in periods when food is scarce. The higher proportion of short-chain and saturated fatty acids can be associated with this traits. The tail adipose tissue was not analyzed here, but its content can be predicted from the intramuscular fat, as the SFA, UFA and P:S composition between meat and caudal fat is the same (Moharrery, 2009).
Despite the fact that myristic and palmitic acids are considered undesirable to human health, from the adaptation and survival viewpoint of the animal, the storage of fat in its tail is very important. Tail fat storage is an energy stock that can be mobilized when body energy requirements exceed energy intake. Thus, the fat is hydrolyzed to form glycerol and non-esterified fatty acids that can then be used to meet the energy requirements of the animal.
28 similar diets were similar in relation to lipid oxidation products (Elmore et al., 1999 and Elmore et al. 2000).
Higher percentages of oleic acid (C18:1n9c) were observed in SO, MO and F1. In beef cattle, a highly significant association was found between age and oleic content in outer-subcutaneous and intramuscular fat in Longissimus dorsi (LD). A positive correlation was also identified between LD marbling score and concentrations of oleic in outer-subcutaneous fat (Waldman et al., 1968). Relation positive between oleic acid and flavor was observed in beef cattle (Westerling and Hedrick, 1979). Here we mentioned references with other species due other ruminants such as cattle and goats have almost the same profile of sheep (Macedo et al., 2008). Agreeing with Enser et al. (1996), oleic acid was the main unsaturated fatty acid found in the Longissimus of lambs.
29 Among the main fatty acids of interest to human health, linolenic (C18:3n3), linoleic (C18:2n6), those with unsaturation at carbon 3, and conjugated linoleic acid (C18:2c9T11; CLA), can be highlighted. Linolenic acid percentage was not influenced by breed type (P>0.05). Considering all genetic groups, 6% of all the lipids in the muscle were linoleic acid. The MN breed had a higher percentage of linoleic (10.12%; P<0.05) than the SI and SO breeds. The CLA percentage was also higher in MO
longissimus (1.28%) than in other breeds (Table 1 and Figure 3). MO is an important local breed with high adaptation to the region, and this aspect will be important for its conservation and improvement.
30 type of diet (Pelegrini et al., 2007). French et al. (2000) observed that the fatty acid profile of intramuscular fat in beef cattle can be improved from a human nutrition perspective by the inclusion of grass in the animal’s diet. This aspect reinforces the results of this study with respect to animals being raised at pasture.
The main polyunsaturated fatty acids (PUFA) arachidonic acid (AA), docosahexaenoic acid (DHA) and eicosapentaenoic acid (EPA) were identified in this study. AA was present in higher proportion (Table 1). The percentage of these fatty acids were not influenced by breed type (P>0.05).
There were no significant differences between genotypes for total saturated fatty acid (SFA), monounsaturated fatty acid (MUFA), total unsaturated fatty acid (UFA), and UFA/SAT and n6/n3 ratios (Table 2). Approximately 41% of total fatty acids were present as UFA. The P:S and n6/n3 ratios are indices used to evaluate the nutritional value of fat for human consumption, as n-3 and n-6 are essential to the human diet. There was no difference in n3 across the genetic groups; however, differences in n6 were observed (P<0.05). Omega-3 and omega-6 are essential in the production of eicosanoids and are recruited as the first line of defense against infections.
31 n-6 and n-3 and their derivatives originate from linoleic acid (cis-9, cis-12) and linolenic acid (cis-9, cis12, cis-15), respectively.
Studies verified that the increase in grass intake and forage caused a linear decrease in the concentration of SFA and in the n-6/n-3 PUFA ratio and a linear increase in the PUFA:SFA ratio and the CLA concentration (Fisher et al., 2000 and French et al., 2000). This increases the importance of animals in pasture.
The analysis of essential fatty acids (Linolenic acid - C18:3n3 + Linoleic acid - C18:2n6c) demonstrated differences across genetic groups. MO lambs showed meat with higher contents of essential fatty acids (EFA), similar to that observed in the F1 crossbreeds. These fatty acids cannot be biosynthesized in animals, including humans, and are necessary for health.
In addition, the atherogenic index was similar in F1, MO and SI lambs and different in SO, which showed the highest index due to a higher concentration of C12:0, C14:0 and C16:0 (Table 2). From the human health standpoint, meat with fewer short-chain saturated fatty acids content is desirable. The atherogenic index was proposed as a measure of the tendency of the food to influence the incidence of coronary heart disease.
32 regulate the transcription of genes involved in lipid metabolism pathways and the SCD enzyme was observed in animals of this study (Lobo et al., 2010 – Article 2).
The study of fatty acids is of extreme importance, not only with respect to human health but also due their influence on the quality and acceptability of meat. Fatty acid profiles should be considered in breeding programs for sheep meat, such as they are related to quality factors of the meat, such as palatability and tenderness. According to the literature review by Wood et al. (2008), fatty acid composition determines the firmness/oiliness of adipose tissue and the oxidative stability of muscle, which in turn affects flavor and muscle color. The variation in fatty acid content among the breeds studied here can be considered an advantage because it offers opportunities to explore it in selection programs for the improvement of these breeds or in crossbreeding for the improvement of lamb meat production systems.
4. Conclusion
Genetic differences between the animals studied were responsible for the differences in the fatty acid profiles. The Morada Nova breed, which had the highest values of CLA, PUFA, P:S and EFA, showed better meat quality parameters with regard to the fatty acid profile. On the other hand, the Brazilian Somali breed exhibited the lowest meat quality, with the highest proportion of saturated and short-chain fatty acids.
33 Acknowledgements
The authors acknowledge Embrapa for the financial support. The first author thanks CNPq and Universidade Federal de Viçosa for the scholarship.
5. References
Aurousseau, B., Bauchart, D., Faure, X., Galot, A. L., Prache, S. (2007). Indoor fattening of lambs raised on pasture: (1) Influence of stall finishing duration on lipid classes and fatty acids in the longissimus thoracis muscle. Meat Science, 76, 241-252. Bernard, L., Rouel, J., Leroux, F., Ferlay, A., Faulconnier, Y., Legrand, P., Chilliard, Y. (2005). Mammalian lipids metabolism and milk fatty acid secretion in alpine goats fed vegetable lipids. Journal of Dairy Science, 88, 1478-1489.
Bligh, E. C., Dyer, W. J. (1959). A rapid method of total lipid extraction and purification. Canadian Journal of Biochemistry Physiology, 37, 911-917.
Chilliard, Y., Rouel, J., Lerox, C. (2006). Goat’s alpha-s1 casein genotype influences its milk fatty acid composition and delta-9 desaturation ratios. Animal Feed Science and Technology, 131, 474-487.
Chilliard, Y., Ferlay, A., Rouel, J., Lamberet, G. (2003). A review of nutritional and physiological factors affecting goat milk synthesis and lipolysis. Journal of Dairy Science, 86, 1751–1770.
Choi, N. J., Enser, M., Wood, J. D., & Scollan, N. D. (2000). Effect of breed on the deposition in beef muscle and adipose tissue of dietary n-3 polyunsaturated fatty acids.
34 Corl, B. A., Baumgard, L. H., Dwyer, D. A., Griinari, J. M., Phillips, B. S., Bauman, D. E. The role of 9-desaturase in the production of cis-9, trans-11 CLA. (2001). Journal of Nutritional Biochemistry, 12, 622-630.
Costa, R. G., Batista, A. S. M., Azevedo, P. S. de, Queiroga, R de C. R. E., Madruga, M. S., Filho, J. T. A. (2009). Lipid profile of lamb meat from different genotypes submitted to diets with different energy levels. Brazilian Journal of Animal Science, 38,
532-538.
Daz, M.T., Velasco, S., Caneque, V., Lauzurica, S., Ruiz de Huidobro F. et al. (2002). Use of concentrate or pasture for fattening lambs and its effect on carcass and meat quality. Small Ruminant Research, 43, 257-268.
Eder, K. & Ringseis, R. (2010). Metabolism and actions of conjugated linoleic acids on atherosclerosis-related events in vascular endothelial cells and smooth muscle cells.
Molecular Nutrition & Food Research, 54, 17-36.
Eichhorn, J. M., Wakayama, E. J., Blomquist, G. J., Bailey, C. M., Bailey, C. M. (1986). Cholesterol content of muscle and adipose tissue from crossbred bulls and steers. Meat Science, 16, 71-78.
Elmore, J. S., Mottram, D. S., Enser, M., Wood, J. D. (1999). Effect of polyunsaturated fatty acid composition of beef muscle on the profile of aroma volatiles. Journal of Agricultural and Food Chemestry, 457, 1619-1625.
Elmore, J. S., Mottram, D.S., Enser, M., Wood, J. D. (2000). The effects of diet and breed on the volatile compounds of cooked lamb. Meat Science, 55, 149-159.
35 Enser, M., Hallett, K. G., Hewett, B., Fursey, A. J., Wood, J. D., Harrington, G. (1998). Fatty acid content and composition of UK beef and lamb muscle in relation to production system and implications for human nutrition. Meat Science, 49, 329-341. Fisher, A. V., Enser, M., Richardson, R. I., Wood, J. D., Nute, G. R., et al. (2000). Fatty acid composition and eating quality of lamb types derived from four diverse breed x production systems. Meat Science, 55, 141-147.
French, P., Stanton, C., Lawless, E. G., O’Riordan, F. J. Monahan, P. J., et al. (2000). Fatty acid composition, including conjugated linoleic acid, of intramuscular fat from steers offered grazed grass, grass silage, or concentrate-based diets. Journal of Animal Science, 78, 2849-2855.
Griinari, J. M., Corl, B. A., Lacy, S. H., Chouinard, P. Y., Nurmela, K.V.V., Bauman, D. E. (2000). Conjugated linoleic acid is synthesized endogenously in lactating dairy cows by ∆9 -desaturase. Journal of Nutrition, 130, 2285- 2291.
Huerta-Leidenz, N. O., Cross, H. R., Savell, J. W., Lunt, D. K., Baker, J. F., Pelton, L. S., Smith, S. B. (1993). Comparison of the fatty acid composition of subcutaneous adipose tissue from mature Brahman and Hereford cows. Journal of Animal Science, 71,
625–630.
Jerónimo, E., Alves, S. P., Prates, J. A. M., Santos-Silva, J., Bessa, R. J. B. (2009). Effect of dietary replacement of sunflower oil with linseed oil on intramuscular fatty acids of lamb meat. Meat Science, 83, 499–505.
36 Melton, S. L., Amiri, M., Davis, G. W., Backus, W. R. (1982). Flavor and Chemical Characteristics of Ground Beef from Grass-, Forage-Grain- and Grain-Finished Steers.
Journal of Animal Science, 55, 77-87.
Mir, Z., Rushfeldt, M. L., Mir, P. S., Paterson, L. J., Weselake, R. J. (2000). Effect of dietary supplementation of either conjugated linoleic acid (CLA) or linoleic acid rich oil on CLA content of lamb tissues. Small Ruminant Research, 36, 25–31.
Moharrery, A. (2009). Effect of Docking and Diet Energy on Carcass Fat Characteristics in Fat-Tailed Baluchian Sheep. Turkish Journal of Veterinary and AnimalSciences, 33, 95-103
Nurnberg, K., Wegner, J., Ender, K. (1998). Factors effecting fat composition in muscle and adipose tissue of farm animals. Livestock Production Science, 56, 145–156.
Palmquist, D. L., St-Pierre, N. R., McClure, K. E. (2004). Tissue fatty acid profiles can be used to quantify endogenous rumenic acid syntehsis in lambs. Journal of Nutrition,
134, 2407-2414.
Pelegrini, L. F. V., Pires, C. C., Kozloski, G. V., Terra, N. N., Baggio, S. R., et al. (2007). Perfil de ácidos graxos da carne de ovelhas de descarte de dois grupos genéticos submetidos a dois sistemas de manejo. Ciência Rural, 37, 1786-1790.
Precht, D., Molkentin, J. (2000). Recent trends in the fatty acid composition of German sunflower margarines, shortenings and cooking fats with emphasis on individual C16:1, C18:1, C18:2, C18:3 and C20:1 trans isomers. Die Nahrung, 44, 222-228.
37 Rowe, A., Macedo, F. A. F., Visentainer, J. V., Souza, N. E., Matsuhita, M. (1999).
Muscle composition and fatty acid profile in lambs fattened in drylot or pasture. Meat
Science, 51, 283-288.
Rumsey, T. S., Oltjen, R. R., Bovard, K. P., Priode, B. M. (1972). Influence of widely diverse finishing regimens and breeding on depot fat composition in beef cattle. Journal of Animal Science, 35, 1069-1074.
Sañudo, C., Enser, M. E., Campo, M. M., Nute, G. R., María, G., Sierra, I., Wood, J. D. (2000). Fatty acid composition and sensory characteristics of lamb carcasses from Britain and Spain. Meat Science, 54, 339-346.
SAS Institute Inc (1996) SAS/STAT. User’s Guide,v. 6.11. 4th ed., v.2. SAS Institute
Inc., Cary, 842 pp.
Sehat, N., Kramer, J. K. G., Mossoba, M. M., Yurawecz, M. P., Roach, J. A. G., Eulitz, K., Morehouse, K. M., Ku, Y. (1998). Identification of conjugated linoleic acid isomers in cheese by gas chromatography, silver ion high performance liquid chromatography and mass spectral reconstructed ion profiles. Comparison of chromatographic elution sequences. Lipids, 33, 963-971.
Smith, S. B., A. Yang, T. W. Larsen and R. K. Tume. (1998). Positional analysis of triacylglycerols from bovine adipose tissue lipids varying in degree of unsaturation.
Lipids, 33,197-207.
Smith, S. B., Gill, C. A., Lunt, D. K., Brooks, M. A. (2009). Regulation of Fat and Fatty Acid Composition in Beef Cattle. Asian-Australasian Journal of Animal Sciences, 22,
38 Waldman, R. C., Suess, G. G., Brungardt, V. H. (1968). Fatty acids of certain bovine tissue and their association with growth, carcass and palatability traits. Journal of Animal Science, 27, 632-635.
Warren, H. E., Scollan, N. D., Nute, G. R., Hughes, S. I., Wood, J. D., Richardson, R. I. (2008). Effects of breed and a concentrate or grass silage diet on beef quality in cattle of 3 ages. II: Meat stability and flavour. Meat Science, 78, 270-278.
Westerling, D. B. & Hedrick, H. B. (1979). Fatty acid composition of bovine lipids as influenced by diet, sex and anatomical location and relationship to sensory characteristics. Journal of Animal Science, 48, 1343-1348.
Wood, J. D., Richardson, R. I., Nute, G. R., Fisher, A. V., Campo, M. M., Kasapidou, E., Sheard, P. R., Enser, M. (2003). Effects of fatty acids on meat quality: a review.
Meat Science, 66, 21-32.
Wood, J. D, Enser, M., Fisher, A. V., Nute, G. R., Sheard, P. R., et al. (2008). Fat deposition, fatty acid composition and meat quality: A review. Meat Science, 78, 343-358.
Zembayashi, M., Nishimura, K., Lunt, D. K., Smith, S. B. (1995). Effect of breed type and sex on the fatty acid composition of subcutaneous and intramuscular lipids of finishing steers and heifers.Journal of Animal Science, 73, 3325-3332.
39 CHAPTER II
(ARTICLE II)
Differentially transcribed genes in skeletal muscle of lambs in postnatal growth of
four genetic groups raised in Brazilian Semi Arid
A.M.B.O. Lôboa*, S.E.F. Guimarãesa, S.R. Paivab, F.C. Floresc, F.F. Silvaa, R.N.B. Lôbod
a
Universidade Federal de Viçosa, Avenida Peter Henry Rolfs, s/n, Viçosa, MG, 36570-000, Brazil
b
Embrapa Recursos Genéticos e Biotecnologia, Caixa Postal 02372, Brasília, DF, 70770-917, Brazil
c
Embrapa Pecuária Sul, Caixa Postal 242, Bagé, RS, 96401-970, Brazil d
Embrapa Caprinos e Ovinos, Caixa Postal 145, Sobral, CE, 62010-970, Brazil
*Corresponding author. Tel./ Fax: +55 88 3112 7487
E-mail address: [email protected]/[email protected] Embrapa Caprinos e Ovinos
Fazenda Três Lagoas - Estrada Sobral Groaíras, Km 4 Caixa Postal 145 - CEP 62010-970 - Sobral - CE - Brazil
Abstract
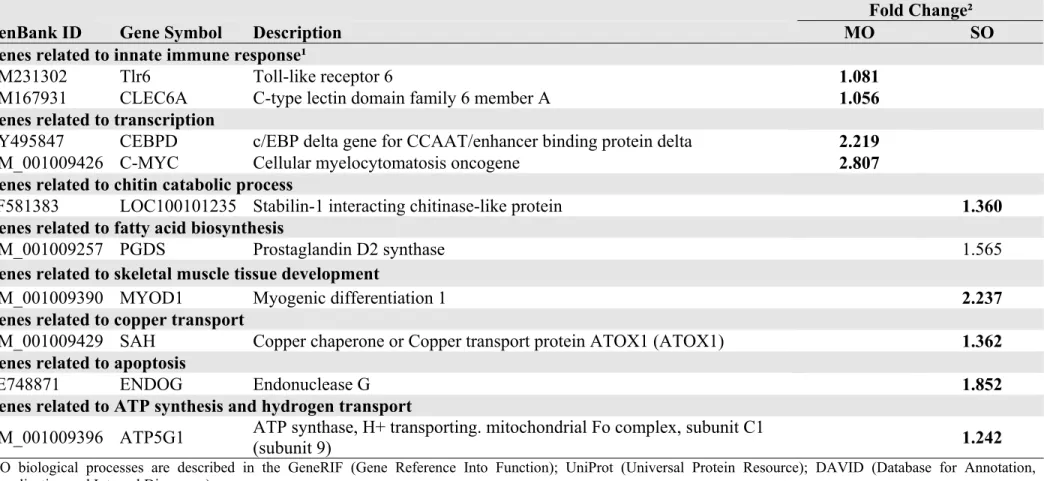
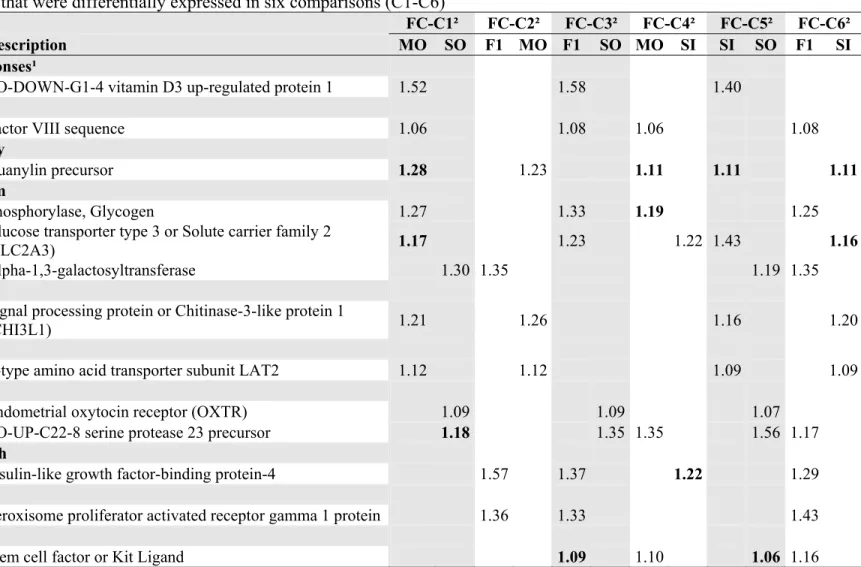
40 Somali (SO) and Santa Inês (SI) and ½ Dorper x ½ Morada Nova (F1) crossbred lambs raised on irrigated pasture in the Brazilian Semi Arid region, and thus to prospect genes responsible for phenotypic differences between these genetic groups. The lambs were unrelated and contemporaries. Over 260 transcripts were differentially expressed among the comparisons. A total of 26 genes of known function, involved in skeletal muscle development (MyoD1 and IGFBP-4), lipogenesis (C/EBPδ and PPAR ) and fatty acid biosynthesis (PGDS), were differentially expressed at least in one comparison. Clustering analysis grouped all transcripts in 6 clusters by expression similarity. This analysis also revealed groups of genes with more expression similarities between MO and SI. This same profile was observed between F1 and SO. A heatmap with all differentially expressed genes suggests more similarities among MO, SI and F1, with SO breed presenting a more distinct expression pattern. Our study provides comprehensive knowledge on global gene expression and biological functionalities of differentially expressed genes in the main hair sheep breeds raised in Brazil. This information could be used for characterization and development of markers that can be used to the improve these breeds.
Keywords: Cluster, differential expression, IGFBP-4, MyoD1, Ovis aries
1. Introduction
41 skeletal muscle is one of the most important goals in animal and meat science and is also related to particular aspects of human medicine (te Pass et al., 2004).
Myogenesis in sheep is completed between 80 and 125 days of gestation (Ashmore et al., 1972a), although some muscles are completely formed at 140 days of gestation (Finkelstein et al. 1992). However, muscle fibers (myofibers) acquire myonuclei during embryonic myogenesis from myoblasts, or during postnatal myogenesis from satellite cells (Cardasis and Cooper 1976). Sheep satellite cell-derived myotubes produce both fast and slow myosin heavy chain (Molnar and Dodson 1992). Animals born with a higher number of muscle cells have greater muscling potential. Animals in which satellite cells are more active could potentially have greater muscle mass. The majority of DNA content of the muscle is accumulated during postnatal muscle growth and development, which is the direct result of satellite cell activity (Koohmaraie et al. 2002). However, postnatal skeletal muscle growth occurs through proliferation of satellite cells followed by differentiation and fusion with existing muscle fibers (Moss and LeBlond et al., 1971).
42 In Brazil, the Northeast region is a large semi-arid area which has 54% of the Brazilian sheep population. The great majority of these animals are hair sheep, mainly from Brazilian local breeds, such as Santa Inês, Morada Nova and Brazilian Somali, as well as the recently imported Dorper. The consumption of sheep meat in this region is relatively high, mainly in rural areas. These animals are predominantly raised on native pasture (“Caatinga”) that has a low production capacity. Alternatives are being established to increase the production of sheep meat in this region such as the use of irrigated pasture. As the meat demand from these animals by human population is increasing, the evaluation of their growth potential is necessary.
Differences among the three breeds cited above are evident. There are differences in size at birth, and development and muscle growth (Figueiredo et al. 1982). The Santa Inês (SI) breed is commercially important for meat production in Brazil and commonly used in crossbreeding as maternal breed in all regions of Brazil. Brazilian Somali and Morada Nova are important genetic resources and are characterized by small body size and slow growth when compared with SI (Rajab et al. 1992). On the other hand, the Dorper breed, recently introduced into Brazil from South Africa, has been extensively used in crossbreeding aiming to increase meat production.
The objective of this study was compare gene transcription profiles of
Longissimus dorsi of lambs in postnatal growing in sheep from the Morada Nova, Brazilian Somali, Santa Inês, and ½ Dorper x ½ Morada Nova genetics groups using a
Sheep Oligo Microarray.
2. Material and methods
43 The field experiment was carried out the Experimental Research Station of Embrapa Caprinos e Ovinos, Sobral, CE – Brazil. A total of twenty-four unrelated males lambs (six of each breed) of Morada Nova (MO), Brazilian Somali (SO) and Santa Inês (SI) breeds and ½ Dorper x ½ Morada Nova (F1) born in the same season, from single births, weaned at an average of 84 d of age, were used in this study. All lambs were weaned on the same date and kept under the same feeding management on grass pasture, with efforts taken to prevent parasite infection. The lambs were raised on irrigated Tanzania (Panicum maximun Jacq cv. Tanzania) pasture with free access to water and mineral salt. The lambs were free to graze and they were supplemented once a day with concentrate (corn and soybean meal) at a rate of 1.5% of body weight. The animals underwent standard sanitary care; periodical faecal egg counts and the Famacha method were used to control gastrointestinal nematodes. Anthelmintic treatments were used when necessary. The experimental design was completely randomized. The conditions analyzed here seek to simulate the present conditions of production system for lambs in Brazil, where animals are exposed to various challenges such as rain, heat, parasites, etc. We seek to identify expressed markers for commercial production of meat.
The lambs used in this study were slaughtered at Embrapa Caprinos e Ovinos facilities with average of 200.18±7.54 days of age (young immature lambs) and 20.62±3.46 kg. Samples of tissue from Longissimus dorsi (LD) muscle (approximately 3 g) were collected immediately post slaughter and conserved in RNA stabilization solution (RNA Holder, BioAgency).
44 The samples of tissue were kept in the RNA stabilization solution at 4°C overnight, thereafter excess solution was removed and stored at -20°C. After that, they were sent on dry ice to Laboratório de Biotecnologia Animal, at the Universidade Federal de Viçosa for processing. Total RNA was obtained using the RNeasy Miniprep kit (Qiagen Inc., Valencia, CA), according to the instructions of the manufacturer. Purified total RNA samples were stored at -80ºC for microarray experiments. RNA quality and integrity were determined using the Eukaryote Total RNA Nano 6000 assay (Agilent RNA 6000 Nano LabChip® Kit) on the Agilent Technologies 2100 Bioanalyzer and quantified by measuring A260nm on a UV/Vis spectrophotometer. Only samples with RNA Integrity Number (RIN) above 7.0 (Appendix 1) were used. Fifty nanograms (ng) of total RNA were reverse-transcribed to cDNA with a T7 sequence. T7 RNA polymerase-driven RNA synthesis was used for the preparation and labeling of RNA with Cy3 dye (AgilentTechnologies).
45 2.3. Microarray experiment design
As the main objective of this experiment was to identify which transcripts were differentially expressed among the genetic groups (MO, SO, SI and F1) a design was used to provide six different comparisons: F1-MO, F1-SI, F1-SO, MO-SI, MO-SO, SI-SO. Six 8x15K slides were used and each array was considered as a block (48 arrays in total). Each slide contained all genetic groups, so the microarray design was randomized complete-block. Six biological replicates and two technical replicates were provided in each comparison. The total RNA collected from each sample (animal, n=6) of each genetic group (n = 4) were hybridized in two slides (technical replicates). Each array of one slide (8 per slide) was considered one block.
2.4. Hybridization and scanner
Equal amounts (600 ng) of Cy3 labeled cRNA probes were hybridized on an 8x15 K Sheep Agilent array (GEO accession: G4813A). The Agilent Gene Expression Hybridization Kit was used to hybridize fluorescently-labeled cRNA to microarrays. The hybridized slides were washed using a commercial kit package (Agilent Technologies, Palo Alto, CA, USA) and scanned using Agilent's DNA microarray scanner. To extract data from the probe, the Agilent Feature Extraction Software (www.agilent.com/chem/fe) was used.
2.5. Microarray data collection and analysis
46 were log2-transformed. Quality control was carried out using a plot density tool. Spots from duplicate probes were averaged and the normalized data were analyzed using R version 2.11.1 with MAANOVA package (Bioconduction, R/ MAANOVA). The microarray analysis of variance (MAANOVA; Kerr et al. 2000) for detecting genes with differential expression was implemented. The model used was:
Yijk = μ + ggi + sj + eijk
where is μ is overall mean, ggi is the fixed effect of genetic group (i=1 to 4), sj is the random effect of sample (j=1 to 24) and eijk the random residual effect.
The t test was used to estimate the significant differences for each transcripts in each comparison, where P<0.05 was considered as statistically different. The Fs statistic, based on the James-Stein shrinkage estimates of the error variance, was used. The false discovery rate was considered by the multiple test adjustment approach (FDR, Benjamin and Hochberg, 1995). The null versions of the test statistics was simulated by 1000 permutations with sample shuffling.
Heatmaps and clusters images were developed using specific functions of R and MAANOVA.
2.6. Correlation Analysis
47 3. Results and Discussion
The slaughter weight was highest in SI lambs (P<0.05) and similar to F1 lambs (P>0.05). F1 lambs had similar slaughter weight to SO lambs and MO lambs had the lowest slaughter weight (SI≥F1≥SO>MO; Table 3).
Table 3. Least-square means for slaughter weight (kg) of ½ Dorper x ½ Morada Nova (F1), Morada Nova (MO), Santa Inês (SI) and Brazilian Somali (SO)
Genetic groups Mean ± Standard Error
½ Dorper x ½ Morada Nova 20,82 ± 1,31 ab
Morada Nova 14,38 ± 1,41 c
Santa Inês 23,98 ± 0,96 a
Brazilian Somali 19,54 ± 1,31 b
Means followed by different letter in the row are statistically different by t test (P<0.05);
The genome-wide expression profiling of each element (probe) was assigned to six different comparisons F1-MO, F1-SI, F1-SO, MO-SI, MO-SO, SI-SO. Gene expression analyses were performed using 39 array post background correction and normalization of raw data set (Appendix 2).