November, 2015
Alexey Koshkin
Bachelor Degree in Mathematics
Application of metabolic systems biology to the
production of cell- and virus-based therapeutics
Dissertation to obtain Master Degree in Biochemistry
Supervisors:
Dr. Ana Margarida Palma Teixeira,
IBET/ITQB-NOVA
Dr. Maria Margarida de Carvalho Negrão Serra,
IBET/ITQB-NOVA
Jury:
Presidente: Prof. Dr. Carlos Alberto Gomes Salgueiro Examiner: Prof. Dr. Moritz von Stosch Supervisor: Prof. Dr. Ana Margarida Palma Teixeira
I
Copyright
Application of metabolic systems biology to the production of cell- and virus-based therapeutics
Alexey Koshkin FCT-UNL
III
Acknowledgements
I would like to acknowledge all the people directly or indirectly involved in this thesis.
To Dr. Paula Alves, for giving me the opportunity to do my master thesis at the Animal Cell Technology Unit at ITQB/IBET, for the good working conditions offered and for being a strong example of leadership and professionalism.
To Dr. Ana Teixeira, for her professionalism, for inviting me to Animal Cell Technology Unit, for giving me a chance to apply my mathematical background to crucial branch of human knowledge – biology. Especially for the opportunity to do my master thesis in two exceptionally interesting fields: stem cell biology and adenoviruses.
To Dr. Margarida Serra, for warmly receiving me in stem cell lab. For her professionalism, kindness, encouragement, constant support and trust.
To Dr. Nuno Carinhas, for his professionalism and his knowledge of metabolism and matlab.
To Daniel Pais to friend, who showed me the interesting world of adenovirus, metabolomics, GC-MS, and especially for his positive mood and good companionship.
To Daniela Sequeira, for showing me traditional Portuguese food, juice, for let the “F = d(mv)/dt” and for being a good friend during this year.
To Dr. Mada Carido, for being my company on coffee break every morning. For her sense of humor, support and for being a good friend.
To Marcos, for his constant good mood. To Ricardo, for the good music and companionship on weekends. To Ana Margarida, for being a friend and for her interest in GC-MS, even during the summer. To all stem lab folks. To Bàrbara, for showing me what is downstream. To all my friends and colleagues in TCA, for the good working environment, friendship, interesting discussion topics and good mood.
To professor Pedro Tavares, Alice Pereira and Ricardo Franco.
Especialmente, quero agradecer, à Cláudia Correia, quem me ensinou quase tudo que conheço sobre stem. Por ser uma bom amiga. Por me sempre dar força, motivação, e por me sempre ajudar a estar animado. Obrigado por apoio e confiança em mim. Esta tese não podia ter sido feita sem ti.
Queria agradecer meus pais. Por toda a apoio, por sempre me ajudar e acreditarem em mim. Хотел воспользоваться этой возможностью для того, чтобы искренне поблагодарить Вас за всё тепло и заботу. За то что помогли мне добиться всего в этой жизни. Этот тезис такой же Ваш как и мой. Спасибо.
V
Preface
The current master thesis was performed at the Animal Cell Technology Unit (ACTU), IBET / ITQB-NOVA, within the scope of the projects “Probing adenovirus-host cell interactions: a systems biotechnology approach to improve production of gene delivery vectors“ (Ref. PTDC/EBB-BIO/119501/2010, funded by Fundação para a Ciência e a Tecnologia (FCT)), “CAREMI - Cardio Repair European Multidisciplinary Initiative” (Ref. HEALTH-F5-2010-242038, funded by the European Union) and “CARDIOSTEM- Engineered cardiac tissues and stem cell-based therapies for cardiovascular applications” (Ref. MITP-TB/ECE/0013/2013, funded by FCT).
Part of the work of this thesis has been submitted for publication and presented as oral and poster
communications at national and international conferences.
Submitted Articles:
Nuno Carinhas#, Daniel AM Pais#, Alexey Koshkin, Paulo Fernandes, Ana S Coroadinha, Manuel
JT Carrondo, Paula M Alves, Ana P Teixeira.“Parallel 13C labeling and isotopic nonstationary metabolic flux analysis of MDCK cells during growth and canine adenovirus vector production”
(submitted to Biotechnology and Bioengineering, October, 2015)
Cláudia Correia, Madalena Carido, Alexey Koshkin, Nuno Espinha, Tomo Saric, Pedro A. Lima, Margarida Serra, Paula M. Alves. “Effective Hypothermic storage of human pluripotent stem cell derived cardiomyocytes compatible with global distribution of cells for clinical applications and toxicology testing” (submitted to STEM CELLS Translational Medicine, September, 2015)
Oral Presentation:
Cláudia Correia, Alexey Koshkin, Madalena Carido, Marcos Sousa, Ana Teixeira, Margarida Serra,
Paula M Alves. Integrated strategies for the production, maturation and storage of functional cardiomyocytes derived from human pluripotent stem cells. 9th International Meeting of the
Portuguese Society for Stem Cells and Cell therapies, October 2015. Oeiras, Portugal.
Poster Presentations:
Daniel AM Pais, Alexey Koshkin, Paulo Fernandes, Carina Silva, Ana S Coroadinha, Paula M
Alves, Ana P Teixeira. Studying the impact of adenovirus infection on cell metabolism using 13C-labelled glucose and glutamine. ESACT 24th, June 2015. Barcelona, Spain.
Cláudia Correia, Alexey Koshkin, Nuno Espinha, Madalena Carido, Marcos Sousa, Catarina Brito,
VI
for the production and storage of functional cardiomyocytes derived from human pluripotent stem
cells. ESACT 24th, June 2015. Barcelona, Spain.
Cláudia Correia, Alexey Koshkin, Nuno Espinha, Madalena Carido, Marcos Sousa, Catarina Brito,
Manuel Carrondo, Tomo Saric, Ana Teixeira, Margarida Serra, Paula M Alves. Integrated strategies for the production and storage of functional cardiomyocytes derived from human pluripotent stem
VII
Abstract
The main aim of this thesis was to apply systems biology tools, namely metabolomics, 13C-MFA and gene
expression profiling, to study the production processes of two promising advanced-therapy medicinal
products: i) adenovirus vectors (AdVs) for gene delivery and ii) human induced pluripotent stem cell-derived cardiomyocytes (hiPSC-CMs) for cardiac cell-based therapy.
To deliver improved yields of adenoviral vectors, deeper knowledge on how they manipulate the metabolic
network of the host cell to supply energy and macromolecule components for their replication is needed. In this thesis, the metabolism of a human amniocyte-derived cell line (1G3) was studied in non-infected and
AdV infected cultures through parallel labeling experiments with [1,2-13C]glucose and [U-13C]glutamine.13C data revealed a greater percentage of labeled TCA cycle metabolites from glutamine,
highlighting the anaplerotic role of this amino acid. Upon infection, glucose consumption and lactate production rates were significantly increased, as well as the majority of amino acid rates. Arresting cell
growth before infection significantly lowered AdV replication compared to infection of exponentially growing cells, while triggering an even more pronounced stimulation of metabolism. These results portray
a metabolic blueprint of human adenovirus infection and highlight the requirement of a favorable cellular environment for its replication.
Improved knowledge on the complex cellular metabolic programs involved in cardiomyogenesis and CM
maturation is needed to bring hiPSC-CMs closer to the clinic/industry. The second part of the thesis focused on the identification of phenotypic, structural and metabolic alterations during CM differentiation and
maturation, using different culture medium compositions. Our results show that the metabolism of early differentiated hiPSC-CMs do not significantly differ from hiPSC when cultured in glucose-rich medium,
both relying on glycolysis. Nonetheless, hiPSC-CMs displayed metabolic plasticity being able to consume not only glucose but also lactate and fatty acids. Noteworthy, when cultured in glucose-depleted medium
supplemented with fatty acids, hiPSC-CMs showed a more mature structure and gene expression profiles and used fatty acid as energy source, a typical feature of adult CMs.
Collectively, the generated knowledge may be applied for bioprocess optimization of AdV production and for improving CM differentiation and maturation processes.
Key Words: System biology, metabolomics, metabolic flux analysis, adenovirus vector, viral infection, human induced pluripotent stem cells, human induced pluripotent stem cells derived cardiomyocytes,
IX
Resumo
O principal objectivo desta tese consistiu na utilização de ferramentas de biologia dos sistemas, tais como metabolómica, 13C-MFA e perfil de expressão génica para estudar os processos de produção de dois
produtos com relevância terapêutica: i) vectores de adenovírus (ADVS) para entrega de genes em terapia génica e ii) cardiomiócitos derivados de células estaminais pluripotentes humanas induzidas (hiPSC-CM) para aplicação em terapia celular cardíaca.
De modo a melhorar os rendimentos da produção de vectores adenovirais é necessário aprofundar o conhecimento sobre o modo como estes vectores manipulam a rede metabólica da célula hospedeira para obter energia e macromoléculas necessárias para sua replicação. Nesta tese, o metabolismo de uma linha celular humana derivada de amniócitos (1G3) foi estudado em culturas não-infectadas e infectados por AdV, usando experiências paralelas com dois substratos marcados: [1,2-13C]glucose e [U-13C ]glutamine. Estas
experiências demonstraram que a glutamina apresenta uma maior contribuição na formação de intermediários do TCA em comparação com a glucose, destacando assim o papel anaplerotic da glutamina. Após a infecção, as taxas de consumo de glucose e produção de lactato aumentaram significativamente/consideravelmente, assim como as taxas de consumo da maioria dos aminoácidos. A paragem no crescimento celular antes da infecção reduziu consideravelmente a replicação de AdV em comparação com a infecção das células em crescimento exponencial e provocou uma estimulação mais pronunciada do metabolismo. A combinação destes resultados originou um modelo metabólico de infecção por adenovírus humano que evidencia as condições de um ambiente celular mais favorável para a sua replicação.
X
XI
Abbreviation list
ACL ATP citrate lyaseACTC1 encodes cardiac muscle alpha actin.
Ad2 adenovirus type 2
Ad5 adenovirus type5
AKG alpha-ketoglutarate
AKGDH aKG dehydrogenase
ALT alanine aminotransferase
BMC bone marrow-derived cells
BMP bone morphogenic protein
Bry T T brachyury transcription factor
BSA bovine serum albumin
CACNA1C gene encoding Calcium channel, voltage-dependent, L type, alpha 1C subunit protein
CAR coxscackie and adenovirus receptor
CHD coronary heart diseases
CMs cardiomyocytes
c-Myc Myc
CPC cardiac progenitor cells
CVD cardiovascular diseases
DKK1 dickkopf homolog 1
DMEM Dulbecco modified Eagle medium
DMSO Dimythyl sulfoxide
EDP Entner-Doudoroff pathway
EMP Embden-Meyrhof-Parnas
EMU elementary metabolic unit
FBS fetal bovine serum
FGF fibroblast growth factors
FSG fish skin gelatin
G6P glucose-6-phosphate
GAPDH Glyceraldehyde-3-Phosphate Dehydrogenase
GATA4 Transcription factor GATA-4
GC-MS Gas chromatography–mass spectrometry
GDH glutamate dehydrogenase
GFP green fluorescent protein
GLUT1 Glucose transporter 1
GLUT3 Glucose transporter 3
hCMs human cardiomyocytes
HCN4 hyperpolarization activated cyclic nucleotide-gated potassium channel 4
hESCs human embryonic stem cells
hESC-CMs human emrionic pluripotent stem cell derived cariomyocytes
hiPSCs human induced pluripotent stem cells
hiPSC-CMs human induced pluripotent stem cell derived cardiomyocytes
ICM inner cell mass
IDH isocitrate dehydrogenase
IgG immunoglobulin G
IgM immunoglobulin G
ISL-1 Insulin gene enhancer protein ISL-1
XII
IWR inhibitors of Wnt response
KDR Kinase insert domain receptor
KLF 4 Kruppel-like factor 4
LDH lactate dehydrogenase
Lin28 Lin-28 homolog A
MDH malate dehydrogenase
MEF mouse embryonic fibroblast
MFA metabolic flux analysis
MI myocardial infraction
MLP major late promoter
MSCs mesenchymal stem cells
MYH6 gene encoding myosin heavy chain, α isoform protein MYH7 myosin, heavy chain 7
MYL2 myosin light chain 2 (myosin regulatory light chain 2, ventricular/cardiac muscle isoform)
MYL7 myosin regulatory light chain 2 (myosin regulatory light chain 2, atrial isoform (MLC2a))
NANOG transcription factor critically involved with self-renewal of undifferentiated embryonic stem cells
NKX-2.5 Homeobox protein Nkx-2.5
NMR Nuclear magnetic resonance
NPC nuclear pore complex
Oct4 transcription factor octamer 4
OXPHOS oxidative phosphorylation
PC pyruvate carboxylase
PDGFRα platelet-derived growth factor receptor α
PDH pyruvate dehydrogenase
PFA paraformaldehyde
PK pyruvate kinase
PPP pentose phosphate pathway
R5P ribose-5-phosphate
RCA replication complement adenovirus
ROS reactive oxygen species
RT-qPCR real time-quantitative polymerase chain reaction SIRPα/β signal-regulatory protein alpha/betta
SMs skeletal myoblast
Sox2 SRY (sex determining region Y)-box 2
SSEA-1 stage-specific embryonic antigen-1
SSEA-4 stage-specific embryonic antigen-4
TCA citric acid cycle
TGF-β transcription growth factor β TNNT2 Cardiac muscle troponin T
TRA-1-60 the human embryonal carcinoma marker antigen
TP terminal protein
VCAM1 vascular cell adhesion molecule 1
VEGF vascular endothelial growth factor
XIII
Contents
1. Introduction ... 1
1.1 Metabolism and metabolic flux analysis ... 1
1.1.1 Metabolism ... 1
1.1.2 Metabolomics, isotopic studies and metabolic flux analysis (MFA) ... 2
1.2 Gene therapy ... 4
1.2.1 Vectors for gene therapy ... 5
1.2.2 Adenoviruses ... 6
1.2.3 Viral particles structure ... 7
1.2.4 Viral genome and adenovirus vectors ... 7
1.2.5 Infection cycle ... 8
1.2.6 Adenovirus effect on production cell line ... 10
1.3 Stem cell differentiation toward cardiomyocytes ... 10
1.3.1 Impact of cardiovascular diseases on humanity ... 10
1.3.2 Embryonic Stem Cells ... 12
1.3.3 Induced Pluripotent Stem Cells ... 13
1.3.3 CM Differentiation - A developmental perspective ... 14
1.3.4 Current methods for CM differentiation of PSC ... 15
1.3.5 Metabolic Dynamics during Development ... 17
1.3.6 Main metabolic differences between PSC and differentiated cells ... 18
1.3.7 Human Stem Cell derived Cardiomyocytes Enrichment by sodium L-Lactate ... 19
1.3.8 Maturation of CMs derived from hPSC ... 20
2.Aim of the Thesis ... 23
3. Materials and methods... 25
3.1 Adenovirus particles production ... 25
3.1.1 Cell line and maintenance ... 25
3.1.2 AdV5 production and titration... 25
3.1.3 Poly-D-Lysine coating procedure ... 26
3.1.4 Isotopic tracer experiments and sampling ... 26
3.2 Stem cells differentiation toward cardiomyocytes ... 27
3.2.1 hiPSCS differentiation toward hCMs ... 27
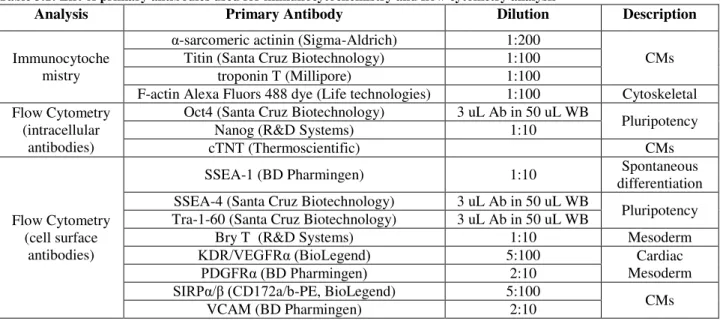
3.2.2 Structural characterization ... 27
3.3 Culture and metabolism characterization tecniques ... 30
3.4 Statistical analysis ... 34
4. Results and Discussion ... 35
4.1 Metabolc characterization of 1G3 cells for AdV production ... 35
4.1.1 Cell density profile and viral particles production ... 36
4.1.2 13C-Labeling dynamics of intracellular metabolites from [1, 2-13C]glucose tracer ... 39
4.1.3 13C-Labeling dynamics of intracellular metabolites from [U-13C]glutamine ... 42
4.1.4 Metabolic network, model representation and flux estimation. ... 44
4.2. Characterization of differentiation of hiPSC into hiPSC-CMs. ... 47
4.2.1 Directed CM differentiation of human PSC ... 47
4.2.3 Comparison of hiPSC and hiPSC-CMs in terms of growth and metabolic performance ... 50
4.2.3 Enrichment of hiPSC-CMs ... 52
4.2.4 hCM maturation ... 52
4.2.5 Labeling experiment in hCM maturation ... 58
5. Conclusion ... 65
XIV
XV
List of Figures
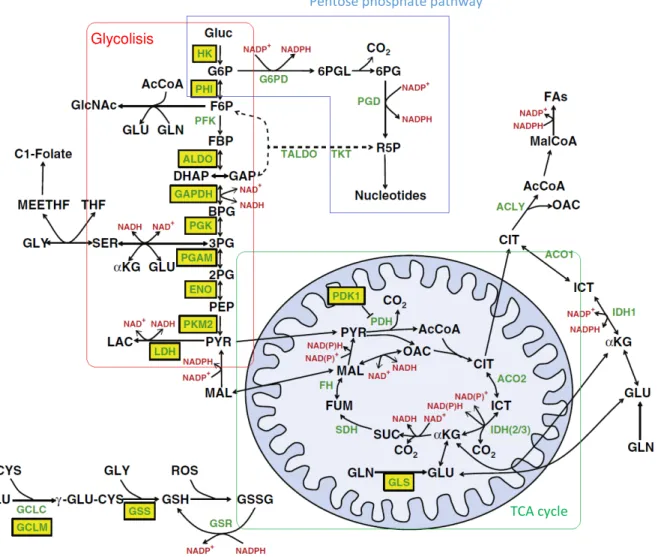
Figure 1.1: Map of central metabolic pathways occurring in mammalian cells ... 2
Figure 1.2: Structure of adenovirus ... 7
Figure 1.3: Schematic representation of wild-type AdV genome and first generations of AdV... 8
Figure 1.4: AdV infection cycle ... 9
Figure 1.5: The 10 leading causes of death worldwide in 2012 ... 11
Figure 1.6: Derivation of hESCs ... 13
Figure 1.7: Schematic representation of factors involved in hPSCs cardiac differentation ... 15
Figure 1.8: Metabolic profile during embryo development ... 18
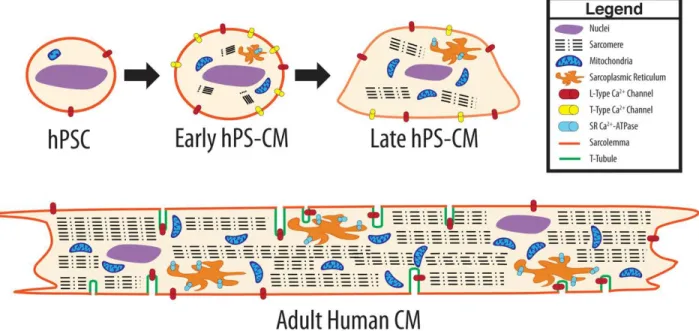
Figure 1.9: Differences between proliferated cells (PSCs) and differentiated/quiescent cells emtabolism .19 Figure 1.10: A visual comparison of early hPSC-CM, late hPSC-CM and adult CM morphology………21
Figure 2.1: Thesis aim and strategies ... 23
Figure 4.1: Experimental setup for 13C tracer cultures of 1G3 cells infected or mock-infected with Ad5, during exponential growth or growth-arrested conditions. ... 35
Figure 4.2: Cell growth profiles of 1G3 cells mock-infected and infected with an Ad5 viral vector ... 36
Figure 4.3: Specific uptake/secretion rates of amino acids for mock-infected and infected 1G3 cells, under GA and EG ... 38
Figure 4.4: Time profiles of isotopic labeling of intracellular metabolites after the introduction of [1, 2-13 C]glucose in mock-infected EG condition. ... 40
Figure 4.5: Percentage of glucose-derived carbon in intracellular metabolites during exponential growth (mock infection) conditions ... 41
Figure 4.6: Atom transitions from [1, 2-13C]glucose and [U-13C]glutamine tracers…….. ... 41
Figure 4.7: Time profiles of isotopic labeling of intercellular metabolites for mock-infected EG condition, after the introduction of [U-13C]glutamine. ... 42
Figure 4.8: Percentage of glutamine-derived carbon in intracellular metabolites during exponential growth (mock infection) ... 43
Figure 4.9: Time profiles of isotopic labeling in PEP, 3PG, Alanine and lactate after the introduction of [U-13C]glutamine under exponential growth conditions. ... 43
Figure 4.10: Overview of metabolic flux distributions during mock- and virus-infected 1G3 cells, under EG and GA conditions ... 45
Figure 4.11: Flow cytometry analysis confirming the pluripotency state of hiPSC before differentiation . 47 Figure 4.12: Characterization of the directed differentiation of hiPSC towards hCMs ... 49
Figure 4.13: Cell growth profiles of hiPSC-CMs and hiPSC-CMs... 50
Figure 4.14: Specific transport rates of metabolites for hiPSCs and hiPSC-CMs ... 51
Figure 4.15: CM enrichment after culture in glucose depleted media supplemented with lactate. ... 52
Figure 4.16: Effect of different feeding strategies on cell phenotype ... 54
Figure 4.17: Effect of different feeding strategies on gene expression of hiPSC-CMs ... 55
Figure 4.18: Specific metabolite transport rates and ratio Lac/Glc in hiPSC-CMs cultured in CMM, LacM and FAM, from day 15 until day 35. ... 56
Figure 4.19: Effect of the presence of fatty acids in medium on hiPSC-CM metabolism and on the expression of genes related with fatty acid metabolism. ... 62
Figure 4.20: Specific transport rates of amino acids determined by HPLC ... 58
Figure 4.21: Time profiles of isotopic labeling of glycolysis metabolites after the intrudiction of [1,2-13C]glucose ... 59
Figure 4.22: Time profiles of isotopic labeling of glycolysis metabolites after the intrudiction of [1,2-13C]glucose ... 60
XVI
Figure 4.24: Time profiles of isotopic labeling of glycolysis metabolites after the intrudiction of
[3-13C]lactate ... 62 Figure 4.25: Percentage of labeled intracellular metabolites from lactate at day 15 and day 25 of culture. ... 62
Figure 7.1: Intracellular 13C-labelling dynamics during growth (mock infection) from [1,2-13C]glucose...…83 Figure 7.2: Intracellular 13C labelling dynamics during growth (mock infection) from [U-13C]glutamine.
……… ………..……….84
XVII
List of Tables
Table 1.1: Radioisotope studies with parallel labeling experiments.. ... 3
Table 1.2: Stable-isotope studies with parallel labeling experiments. ... 4
Table 1.3: Principal deliverly vectors, advantage and limitations. ... 6
Table 1.4: Methods for reprogramming somatic cells to iPSCs ... 14
Table 1.5: Examples of factors and molecules with observed effects on CM differentiation ... 16
Table 1.6: Different approaches for hPSC differentiation towards CMs ... 17
Table 3.1: List of primary antibodies used for immunocytochemistry and flow cytometry analysis ... 28
Table 4.1: Molar ratio YLac/Glc ... 37
Table 7.1: Metabolic flux analysis for mock- and virus-infected cells results using combined 13C-MFA of [1,2-13C]glucose and [U-13C]glutamine parallel labeling experiments at the exponential phase ... 77
1
1. INTRODUCTION
There is significant pressure to bring the next generation of cell culture-derived therapies (virus- and stem cell-based products) to market at lower costs. The “black-box” approach currently prevailing during early stage development of cell culture-based products can be reduced in the era of omics technologies. More efficient production requires deeper understanding of cellular metabolism and its regulation, which provides the building blocks and energy for cell growth and virus production, and is known to play a pivotal role in
dictating cell fate with key metabolic pathways differently activated in stem cells as compared to restricted progenitor and differentiated cells. A metabolic systems biology approach was pursued in this thesis to gain
insights on the production processes of two biomedical relevant products: i) replication of adenoviral vectors in human cell lines, with applications on gene therapy and vaccination and ii) cardiomyocytes differentiation
from pluripotent stem cells.
1
.
1 Metabolism and metabolic flux analysis
1.1.1 Metabolism
Metabolism (from the Greek μεταβoλή, i.e., transition, transformation) is the sum of all chemical processes occurring within living cells and organisms, and consists of two main types of reactions, catabolic and
anabolic. Catabolic reactions involve the breaking down of organic substrates (metabolites) by their oxidation to provide energy (e.g. ATP) (de Bolster, 1997a). Anabolism is the process of synthesizing
macromolecules from low molecular weight precursors using the energy generated in catabolism (de Bolster, 1997b).
Most metabolic studies involving estimation of fluxes in different cells and culture conditions are focused on central carbon metabolism, i.e. glycolysis, tricarboxylic acids (TCA) cycle, oxidative phosphorylation (OXPHOS), pentose phosphate pathway (PPP) and amino acids metabolism (Figure 1.1) (Vacanti and
Metallo, 2013). Glycolysis is a series of reactions that catabolize one glucose molecule into two molecules
of pyruvate or lactate, generating ATP. The TCA (or Krebs) cycle is a set of oxidation, decarboxlation, isomerization and condensation reactions that take place in the mitochondria with the purpose of energy generation in the form of reducing equivalents (NADH, FADH2), while releasing CO2. OXPHOS is a set of
electron transport reactions occurring in the inner mitochondrial membrane that generate a proton gradient that is channeled to produce ATP by phosphorylation of ADP in the presence of O2. The proton donors for
the gradient formation are the NADH and FADH2 moieties generated in the TCA cycle and potentially
glycolysis. PPP converts glycolytic intermediates (glucose-6-phosphate (G6P)) into pentose phosphates that
2
Figure 1.1: Map of central metabolic pathways occurring in mammalian cells (adapted from (Vacanti and Metallo, 2013)).
1.1.2 Metabolomics, isotopic studies and metabolic flux analysis (MFA)
The metabolites involved in biochemical reactions and processes can be identified and quantified using new
metabolomic technologies (Smith et al., 2006; Sreekumar et al., 2009). Analysis of the metabolome, the complete set of small-molecule chemicals, can provide information on the metabolic flux distributions
occurring in the cell, which by turn are a function of gene expression, protein modifications and interactions at different levels (Nielsen, 2003; Nöh and Wiechert, 2011). Comparing with regulatory networks composed of protein-DNA and protein-protein interactions, where there are still many unknown components,
metabolic networks consisting of all metabolic reactions occurring in cellular metabolism can be described and predicted using mathematical models (Price et al., 2003). However, accurate estimation of metabolic
fluxes can only be presently achieved in representative networks of central metabolism using a combination of computational, intra-metobolomic (intracellular metabolites) and extra-metabolomic (extracellular
metabolites, that is, present in the cell culture medium) techniques, including isotopic tracing studies (using
Glycolisis
Pentose phosphate pathway
3
substrate molecules in which one or more of the atoms is replaced by a different isotope) (Kelleher, 2004;
Oldiges et al., 2007).
Isotopic tracers have been used since the inception of metabolism investigation in the 20th century. These
were firstly radioactive species (e.g. 14C, 3H) administered to cells in small quantities followed by the
measurement of radioactivity in end products and other metabolites (Gibbs et al., 1954; Kelleher, 2001).
The use of parallel radioisotope experiments allowed the determination of structures, precursors and activities of pathways such as PPP, TCA cycle, anaplerosis, gluconeogenesis and fatty acid metabolism
(Table 1.1).
Table 1.1: Radioisotope studies with parallel labeling experiments. Notes:[1]gluc denotes[1-14C]gluc, unless stated otherwise. The semicolon‘‘;’’ denotes parallel experiments (Crown and Antoniewicz, 2013).
More recently, advances in stable isotope (e.g. 13C, 2H, 15N) measurement through nuclear magnetic
resonance (NMR) and mass spectrometry (MS) have replaced the use of radioactive isotopes in metabolic
4
metabolic network described by high dimensional system of differential equations; thus, fitting of simulated
data requires significant computational power, which until has hindered the application of these tools. Fortunately, increasing computational resources combined with algorithms for metabolic network
decomposition, namely the elementary metabolic unit (EMU) method (Antoniewicz et al., 2007), have allowed deeper characterization of cellular metabolism in different biological systems and under different
conditions.
1.2 Gene therapy
Gene therapy can be defined as the transfer of nucleic acid to the somatic cells of a patient with resulting therapeutic effect (Ylä-Herttuala S, 2003). It is based on the modification of the genetic material of living
5
cells, by correcting genetic defects or overexpressing therapeutic proteins and is able to modify the biology
and phenotype of target cells, tissues and organs (Coura and Nardi, 2008). Gene therapy is a promising method to cure a number of diseases, such as cancer, autoimmune disorders, cardiovascular and infection
diseases (Bouard et al., 2009).
There are two ways of therapeutic gene introduction intro the target cells: ex vivo or in vivo. The ex vivo
method consists in removal of target cells from a patient, their transduction with a viral vector and further re-introduction into the patient. This technique limits the cellular target population to be transduced thus
increasing vector concentration and minimizing immunogenic responses. Advantages of the ex vivo approach include a higher efficiency of gene transfer and the possibility of cell propagation in vitro, thus generating a higher cell dose. However, this method is limited by high costs of manufacturing,
quality-control difficulties and low number of target cell types and diseases (Aiuti et al., 2002; Bouard et al., 2009; Räty et al., 2008). Alternatively, in vivo gene therapyis based on delivering the selected gene directly into target cells in the patient. This approach is less expensive but the major challenge is lack of efficient, non-toxic gene delivery systems capable of transducing only the target cells in the whole organism (Bouard et
al., 2009).
Despite recently successful gene therapy applications in clinical trials, further understanding of the
molecular basis of how viruses and viral vectors interact and influence the host cells are urgently required (Bouard et al., 2009; Räty et al., 2008).
1.2.1 Vectors for gene therapy
There are two main types of gene-delivery vectors: viral and non-viral. Viruses are highly evolved biological
machines that efficiently gain access to host cells and exploit the cellular machinery for their needs, thus being effective candidates for usage as vector for gene therapy (Räty et al., 2008). Viral vectors have also
disadvantages, such as limitation on the size of the therapeutic gene inserted in the viral DNA, possible immunological responses by the patient’s organism, and difficulties in viral vector production and purification. On the other hand, non-viral vectors (DNA, liposomes, cationic lipids, etc) avoid to a great extent these limitations, but have demonstrated an extremely low efficiency, and hence have not enjoyed
widespread use.
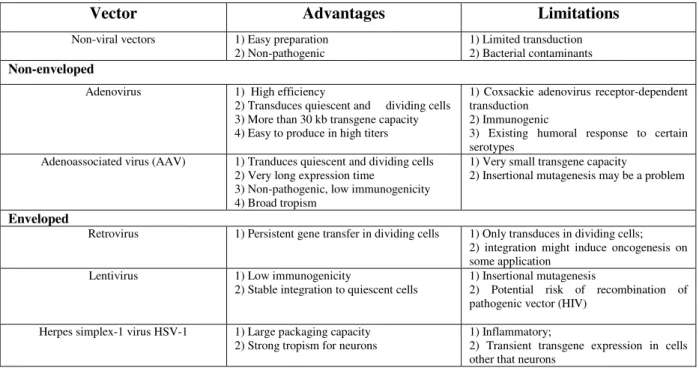
Five classes of viral vectors are used today for clinical application: retroviruses, lentiviruses, adenoviruses, adeno-associated viruses (AAVs) and herpes simplex-1 virus (HSV-1s) (Thomas et al., 2003). Advantages
and disadvantages of each class as a viral vector delivery system are summarized in Table 1.3. Depending on the purpose, different viral vectors are preferable. However, currently, adenoviruses are the dominant
6
As an example, the first gene therapy products to be developed (SiBiono GeneTech’s GendicineTM in 2003
and Sunway Biotech´s OncorineTM in 2006) were based on adenoviral vectors (J.K. Raty, J.T . Pikkarainen,
2008).
Table 1.3: Principal deliverly vectors, advantage and limitations. (adapted (Bouard et al., 2009; J.K. Raty, J.T . Pikkarainen, 2008; Thomas et al., 2003)
Vector Advantages Limitations
Non-viral vectors 1) Easy preparation 2) Non-pathogenic
1) Limited transduction 2) Bacterial contaminants
Non-enveloped
Adenovirus 1) High efficiency
2) Transduces quiescent and dividing cells 3) More than 30 kb transgene capacity 4) Easy to produce in high titers
1) Coxsackie adenovirus receptor-dependent transduction
2) Immunogenic
3) Existing humoral response to certain serotypes
Adenoassociated virus (AAV) 1) Tranduces quiescent and dividing cells 2) Very long expression time
3) Non-pathogenic, low immunogenicity 4) Broad tropism
1) Very small transgene capacity
2) Insertional mutagenesis may be a problem
Enveloped
Retrovirus 1) Persistent gene transfer in dividing cells 1) Only transduces in dividing cells; 2) integration might induce oncogenesis on some application
Lentivirus 1) Low immunogenicity
2) Stable integration to quiescent cells
1) Insertional mutagenesis
2) Potential risk of recombination of pathogenic vector (HIV)
Herpes simplex-1 virus HSV-1 1) Large packaging capacity 2) Strong tropism for neurons
1) Inflammatory;
2) Transient transgene expression in cells other that neurons
1.2.2 Adenoviruses
Adenoviruses are pathogenic, non-enveloped, double-stranded DNA viruses, capable of infecting a wide range of mammalian species, including monkeys, mice, birds and humans (Chen et al., 2011), and can infect
the majority of cells, including post-mitotic cells, skeletal muscle, lung, brain and heart (Russell, 2000). In humans, they can induce infection in the eye (acute conjunctivitis) (Jawetz, 1959), in membranes of the
respiratory track, intestines or urinary tract. Cytopathic effects in cell cultures derived from human adenoids were firstly observed in 1953 by Rowe and colleagues (Rowe et al., 1953). There have been identified over
50 serotypes, divided into six species (A-F) based on their capacity to agglutinate erythrocytes(Walker and Ditor, 2004). Two serotypes, Ad2 and Ad5, belonging to subgroup C, are the most common used in clinical
trials due to low occurrence of severe pathologies in human (Parks et al., 1999) and to the absence of integration into the host cell genome, decreasing the risk of mutagenesis (Gómez-Navarro and Curiel, 2000).
7
1.2.3 Viral particles structure
X-ray crystallography and cryoelectron microscopy image reconstruction have provided knowledge the
structural composition of adenovirus icosahedral particles. The three principal proteins of the icosahedral capsid are: hexon, penton base and fibre (Figure 1.2). The capsid is covered by 240 hexons and 12 vertices,
each comprise one penton base, with one fiber on it (Russell, 2009). In addition, adenoviruses are composed by other structural proteins: 7 proteins are present on the capsid (II, III, IIIa, IV, VI, VIII, IX) and 4
additional proteins are packaged with the linear double-stranded DNA in the core of the viral particle (V, VII, mu and terminal protein).
1.2.4 Viral genome and adenovirus vectors
The adenovirus genome is comprised of a double-stranded, linear DNA molecule with a terminal protein (TP) attached covalently to its 5´termini, which have inverted terminal repeats (ITRs) (Rekosh, 1977). Adenovirus genes can be divided in two groups according to its expression chronology: early (E) and late
(L) genes (Figure 1.3). There are eight units for RNA polymerase II-mediated transcription. Early transcriptional units, E1 (E1A, E1B), E2 (E2A, E2B), E3, E4 and E5, are expressed before viral replication. The first region of transcription is E1, producing the protein E1A which changes the host cell’s metabolism and genetic expression, facilitating transcription of the viral genome. E1 deregulates cell-cycle control by
increasing the stability of p53 and promotes apoptosis through p53-dependent and independent mechanism. However, induction of cellular apoptosis can negatively affect virus replication, so adenovirus should have
mechanism to decrease p53 activity. Protein E1B cooperates with protein E1A, providing preservation of cell viability by blocking apoptotic pathways: inhibition of p53 tumor suppressor, TNF and Fas ligand cell
death pathways, thus gaining time for successful viral production (Chinnadurai, 1998; Farson et al., 2006). E1B also turns off host cell protein synthesis. DNA-binding proteins and a polymerase are encoded in the
8
E2 region, being essential for viral replication (Tatsis and Ertl, 2004). The E3 region encodes proteins which
inhibit pathways of cell death induced by the host innate immune response to the infected cell. The E4 transcription unit encodes seven proteins affecting viral transcription and cell functions, including cell
proliferation and apoptosis, partially by promoting degradation of p53. Two units (IX and IVa2) are expressed with a delay after initiation of viral replication and are essential for nuclear export of viral RNA
(Tatsis and Ertl, 2004). The product of the IX gene is a transactivator and increases virion stability, while the IVa2 protein is needed for assembly of adenovirus and packing of viral DNA. The last unit (“Late unit”,”L”) is divided in five genes (L1-L5) that are only expressed after replication of viral DNA. They encode 45 different species of RNA and are involved in the production of different structural components required for viral particle incapsidation and viral capsid formation and maturation (Russell, 2000).
Adenovirus vector construction aims to avoid vector replication during therapy, controlling the genome
replication by removing the E1 region (Dormond et al., 2009). The E1 region is responsible for encoding proteins necessary for the expression of the other early and late genes and initiating the virus life cycle (Figure 1.3). Thus, deletion of E1 suppresses the replication properties of adenoviruses. Also, depletion of
the E3 region, which is not essential for viral replication in vitro, provides an additional 3.5 kb of space for alternate expression cassettes (Kovesdi and Hedley, 2010). This first generation of adenovirus vectors
allows to incorporate a transgene capacity up to 8 kb (Dormond et al., 2009). To increase capacity for transgene incorporation in the viral genome, the third generation adenovirus vectors had the E1, E2A, E4
and E3 regions deleted.
Figure 1.3: Schematic representation of wild-type AdV genome and first generations of AdV. Genomes are divided into 100 map units (28 to 38 kb). E1 to E4: early transcriptunits, L1 to L5: late transcript units, ITR: inverted terminal repeats, MLP: major latepromoter, ψ: packaging signal (adapted from (Dormond et al., 2009))
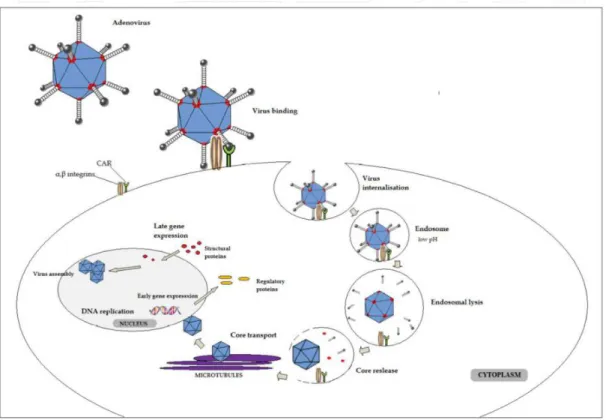
1.2.5 Infection cycle
AdV5 has a lytic cycle of infection, culminating with the disruption of the host cell and new viral particles
release. Firstly, the virus engages with the cell surface through affinity between the protruding domain of the fiber protein and the Coxscackie and Adenovirus Receptor (CAR), which serves as receptor for all
9
interaction between the pentose base protein with cell membrane integrins (Bil-lula and Ussowicz, 2010) (Bil-lula and Ussowicz, 2010). Integrins are heterodimeric transmembrane proteins consisting of α and β subunits and serve important host cell functions, such as cell attachment, migration, growth and
differentiation.
Figure 1.4: AdV infection cycle. An interaction between penton base and integrins induces internalization of viral particle into the host cell. Intra-endosomal mechanisms lead to disintegration of virion shell. Viral DNA is transported into the cell nucleus roviding material for DNA replication. The early phase of replication includes expression of the “early genes” (E1-E4) acting as regulatory factors and facilitating virus replication. Second phase of AdV replication leads to expression of L1-L4 encoding mainly structural proteins determining virus assembly and maturation (Bil-lula and Ussowicz, 2010).
Adenovirus particles enter through the membrane via clathrin-coated pits and vesicles (Patterson and Russell, 1983). Previous investigations of adenovirus internalization, performed on Hella cells showed that
clathrin/receptor-mediated endocytosis is the main pathway of AdV5 infection (Wang et al., 1998). After AdV internalization, the next step involves disruption of the early endosome allowing virion release to the
cytosol (Meier and Greber, 2003). Different studies show that the release of AdV is triggered by mildly acidic conditions (pH~6) that activate the viral encoded cysteine protease (Blumenthal et al., 1986; Greber et al., 1996). By the time the AdV is delivered to the cytoplasm, it has lost the fiber penton, peripentonal
hexon proteins and the capsid stabilizing proteins (proteins IIIa, VIII, and IX) (Figure 1.2) (Saphire et al., 2000). In the cytosol, the virion is transported to the nucleus by microtubules (Suomalainen et al., 1999) in
10
nucleus through aqueous channels that span the nuclear envelope – Nuclear Pore complex (NPC) (Saphire
et al., 2000). The nucelocapsid, resulting from rearrangements in the AdV during its transport to the nucleus, docks with NPC where it undergo further disassembly, allowing the DNA to enter the nuclear interior (Saphire et al., 2000). After the viral genome enters the host cell’s nucleolus, the cell starts to express viral genes, resulting in the production of viral particles. When the concentration of viral particles reaches a
certain level, the host cell membrane disrupts releasing the viral particles (Figure 1.4).
1.2.6 Adenoviral vector production cell lines
First generation AdVs with E1 and E3 deleted regions are replication deficient due to absence of E1A expression (Dormond et al., 2009). Thus, production of AdVs is performed by infection of modified cell
lines allowing the complementation intrans of genes lacking in the viral genome for its replication. For that purpose, the human embryonic kidney HEK293 cell line is mostly used. HEK293 cells were developed in the 1970’s by insertion of E1A and E1B sequences from nucleotides 1 to 4344 (Graham et al., 1977). Since AdVs have a deletion in the E1 region approximately between nucleotides 400 and 3500, overlap between the E1 sequences in the production cell line and AdV can cause homologous recombination between
sequences and occurrence of replication-complement adenovirus (RCA) contamination (Hehir et al., 1996). Thus, a strategy to prevent RCA occurrence is to delete the overlap between the E1 sequence in the
production cell line and the AdV (Fallaux et al., 1998). Recently, cell lines derived from human amniocytes were proposed as an alternative cell source for recombinant vector production. Absence of sequence overlap
between the integrated E1 region and vector DNA excludes the generation of RCA avoiding disadvantages of using HEK293 cells. One of these promising cell lines derived from amniocytes, 1G3, was generated by
immortalization of primary human amniocytes with plasmid pSTK146 containing the E1 region of AdV from 505 to 3522nt. To avoid RCA, the E1B intron, the E1B splice acceptor (SA) and the 3’ UTR (overlapping with the protein IX gene) were replaced with the corresponding elements from SV40, i.e. intron, SA and polyA signa. The derived cell line had a reduced number of homologous nucleotides and
consequently extremely low probability of occurrence of homologous recombination (Silva et al., 2015).
1.3 Stem cell differentiation towards cardiomyocytes
1.3.1 Impact of cardiovascular diseases on humanity
Heart diseases have a huge impact on the human population. According to the World Health Organization
11
(World Health Organization, 2011). From these, 6.2 million deaths were due to stroke and 7.3 million to
coronary heart diseases (CHD) (Heart Federation, 2011).
Figure 1.5: The 10 leading causes of death worldwide in 2012 (adapted from World Health Organization, Fact Sheet N 310).
The costs associated to CVD treatments are very high. A report of the World Economic Forum and the
Harvard School of Public Health divided the costs of CVD into five groups: screening, primary prevention, secondary prevention, acute hospital care and lost productivity: in 2010, it was about US$ 863 billion (an average per capita cost of US$ 125), and it is estimated to rise to US$ 1,044 billion in 2030 – an increase of 22% (Bloom et al., 2011).
One of the main reasons of the CVD is atherosclerosis, in conjunction with thromboembolism, may result in blood vessels blockage, and consequently in ischemia (Qin et al., 2014). Ischemia represents a restriction
of blood supply of the tissue, which cause cells necrosis and apoptosis (Birbrair et al., 2014) by annihilating substrate delivery to cells (infraction)(Baines, 2014; Jennings and Steenbergen, 1985), causing myocardial infraction (MI) better known as “heart attack” (Chang and Towbin, 2006). After acute heart attack, up to 109 cardiomyocytes (CMs) died while human heart contain approximately 3 billion CMs (Eefting et al.,
2004; Tirziu et al., 2010). Injured heart tissue are then replaced by fibroblasts, which form scar tissue, entailing loss of contractility (Chang and Towbin, 2006) and overload of the surviving myocardium,
ultimately resulting in heart failure (Segers and Lee, 2008).
The regenerative capacity of the human myocardium is not adequate to compensate the drastic loss of heart muscle (Segers and Lee, 2008). An experimental approach to regenerate heart tissue may be to utilize the
1.1 millions 1.3 millions 1.5 millions 1.5 millions 1.5 millions 1.6 millions
3.1 millions 3.1 millions
6.7 millions 7.4 millions
0 1 2 3 4 5 6 7 8
12
emerging technologies of stem cells, cell therapy and tissue engineering to repopulate the injured heart with
new CMs. Different type of stem cells have been proposed as promising candidates namely: i) human adult stem cells including bone marrow-derived cells (BMCs) (Orlic, 2005), bone marrow-derived mesenchymal
stem cells (MSCs) (Zimmermann et al., 2006), skeletal myoblast (SMs) (Dowell et al., 2003) and cardiac progenitor cells (CPC) (Leri et al., 2011) as well as ii) human pluripotent stem cells (hPSC) namely,
embryonic (hESCs) and induced pluripotent (iPSCs) stem cells.
Over the last years, PSCs have emerged as an attractive candidate stem cell source for obtaining hCMs. The
inherent capacity to grow indefinitely (self-renewal) and to differentiate into all mature cells of the human body (pluripotency), makes hPSCs the only cell source that can provide, ex-vivo, an unlimited number of functional hCMs suitable for cell therapy (Améen et al., 2008; Zhang et al., 2009).
1.3.2 Embryonic Stem Cells
ESCs were isolated for the first time in 1981, from mouse embryos, more specifically from the inner cell mass (ICM) of blastocyst (Figure 1.6). Blastocyst is a pre-implantation embryo that develops 5 days after the fertilization. It is composed by the ICM that differentiate into the specialized cell types of the body and
the outer cells (trophoblast/trophectoderm) that originate the placenta (Landry and Zucker, 2004). Seventeen years later, Thomson generated the first hESCs, by separation of the ICM, using immunosurgery and by
plating the ICM on irradiated mouse embryonic fibroblast (MEF) feeders (Thomson et al., 1998). To maintain hESC colonies, high serum containing Dulbecco´s modified Eagle´s medium was used. hESC colonies originated from ICM were mechanically dissected from old MEFs, and transferred to freshly inactivate MEFs. A hESC line was established by repeated mechanical dissection is subsequent passages
(Bongso and Tan, 2005).
Traditionally 1 to 3 day old frozen embryos left after in vitro fertilization (UVF) treatment are used for that
purpose (Bongso and Tan, 2005). Despite the promising applicability of hESCs in regenerative medicine, there is a set of limitations that hampers their clinical application. These include restrict number of available
13
Figure 1.6: Derivation of hESCs (Terese Winslow, 2006).
1.3.3 Induced Pluripotent Stem Cells
In 2006, Yamanaka and co-workers have reprogrammed mature cells to a pluripotent state (O’Malley et al., 2009). The reverted cells were called induced pluripotent stem cells (iPSCs) and were generated by the
induced expression of specific reprogramming factors (Nakagawa et al., 2008). In this case, human induced pluripotent stem cells, were derived from human dermal fibroblast, by addition of four transcription factors:
Oct4, Sox2, Klf4 and c-Myc, using a retroviral vector (Takahashi et al., 2007). In 2012, Yamanaka was awarded with Nobel Prize in Physiology of Medicine for this discovery. As c-Myc and Klf4 are oncogenes
capable to cause tumor formation, other combinations of transcription factors were investigated (Huangfu et al., 2008; Nakagawa et al., 2008). Yu et al showed that the combination of Oct4, Sox2, Nanog and LIN28
transcription factors, delivered by lentivirus vectors, can also efficiently reprogram human somatic cells to pluipotency (Yu et al., 2007). Nevertheless, it was shown that LIN28 can activate endogenous Myc proteins by enhancing translation of insulin-like growth factor-2 (Nakagawa et al., 2008). Consequently, strategies
for nuclear reprogramming independent of c-Myc are being explored. There are different methods to introduce transcriptional factors into somatic cells, namely via integrating, excisable, non-integrative
14
1.3.3 CM Differentiation - A developmental perspective
During embryonic development, one of the most essential and earliest process is cardiogenesis (Srivastava,
2006). Cardiac development is a dynamic process controlled by sequential expression of multiple signal transduction proteins and transcription factors. Decades of research allowed to understand the main
molecular pathways and genes which are responsible for cellular differentiation in mouse model systems, however human heart development is still poorly understood (Musunuru and Domian, 2014). Despite of the
differences in the mouse and human heart, investigation on mouse cardiogenesis has provided valuable knowledge/information about key signaling pathways involved in PSC differentiation to CMs (Garbern et
al., 2013).
hPSC cardiomyogenesis consists of six major steps i) epithelial to mesodermal transition (day 0); ii) from mesodermal progenitor cells to precardiac mesoderm cells (day 2); iii) specification of the precardiac
mesoderm do the cardiac mesoderm (day 3-4); iv) cardiac specification in which the cardiac mesoderm
further develops into cardiac progenitor cells (day 5-6); v) from cardiac progenitor cells to immature CM
*OSKM and similar factor names represent combinations of reprogramming factors: K, KLF4; L, LIN28; M, c-MYC; N, NANOG; O, OCT4; S, SOX2; and VPA, valproic acid. (Robinton and Daley, 2012).
15
(day 7); vi) maturation of CMs (extended time in culture). At each stage of differentiation, cells can be
characterised, by the expression of a different set of markers (transcriptional factors, surface marker). The steps of hPSC cardiomyogenesis as well as the markers expressed by cells at each differentiation stage are
illustrated in Figure 1.7.
The main signalling pathways involved into cardiac induction are: wingless/INT (WNTs) (Marvin et al.,
2001), nodal (Brennan et al., 2001)), bone morphogenic proteins (BMPs) (Univer-, 1995) and fibroblast growth factors (FGFs) (Mima and Fischman, 1995). During gastrulation (formation of gastrula in early embryonic development) signals mediated through WNT/β-catenin and transcription growth factor β (TGF-β) family members promote differentiation of PSCs into mesoderm (Murry and Keller, 2008). However, following mesodermal induction, WNT/β-catenin signaling inhibits cardiac differentiation and may redirect cells to alternative mesodermal fates. Therefore, at this stage WNT/β-catenin signaling need to be blocked by specific inhibitors to effectively induce heart development. The biphasic role of the WNT/β-catenin pathway during cardiac differentiation (either promoting or inhibiting cardiogenesis depending on timing), highlights that the concentration and timing of addition of specific growth factors/small molecules are
crucial and must be carefully addressed in order to efficiently drive PSCs to a cardiac cell fate.
Figure 1.7: Schematic representation of factors involved in hPSCs cardiac differentation (Burridge et al., 2012) Factors that influence the progression through each of the six major steps of hPSC cardiomyogenesis: epithelial to mesenchymal transition, mesoderm differentiation, mesoderm speciation, cardiac specification, cardiomyocyte differentiation, and electrical maturation. Below are the markers associated with each of the seven cell types during differentiation; surface markers are marked with an asterisk.
1.3.4 Current methods for CM differentiation of PSC
16
differentiation strategies (induced by growth factors and/or small molecules) (reviewed in (Dierickx et al.,
2012)).
Guided/directed differentiation with growth factors and small molecules
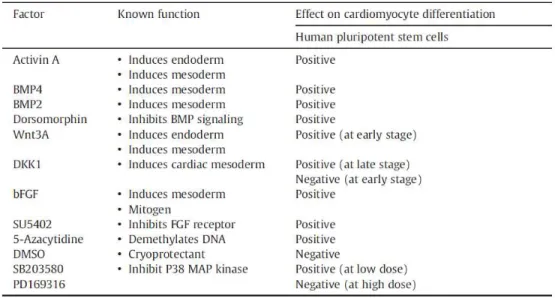
Several growth factors/small molecules have been used to induce mesoderm formation and cardiomyogenesis in PSC cultures. Some of these factors are listed in Table 1.5. Activin A, a member of TGF-β family, has been demonstrated to promote cardiomyogenesis in human PSCs (reviewed in (Habib et al., 2008)). BMPs, also members of the TGF-β family, play a key role in promoting mesoderm formation
and specifying myocardial lineage commitment during differentiation (Filipczyk et al., 2007; Habib et al., 2008).
Table 1.5: Examples of factors and molecules with observed effects on CM differentiation (adapted from Xu, 2012).
It has been shown that sequential addition of these two growth factors (at specific concentrations) can generate spontaneous contracting areas within 10 days and 30% of differentiated CMs within three weeks, (Laflamme et al., 2007). The WNT family, namely the WNT/β-catenin pathway, has stage dependent effects on cardiac differentiation. Activation of this pathway at the beginning of differentiation and inhibition at
later stages, after mesoderm formation, with IWR/IWP factors enhance cardiomyogenesis (Paige et al., 2010). FGFs have also been described to influence survival and proliferation of cardiac precursors (Mercola
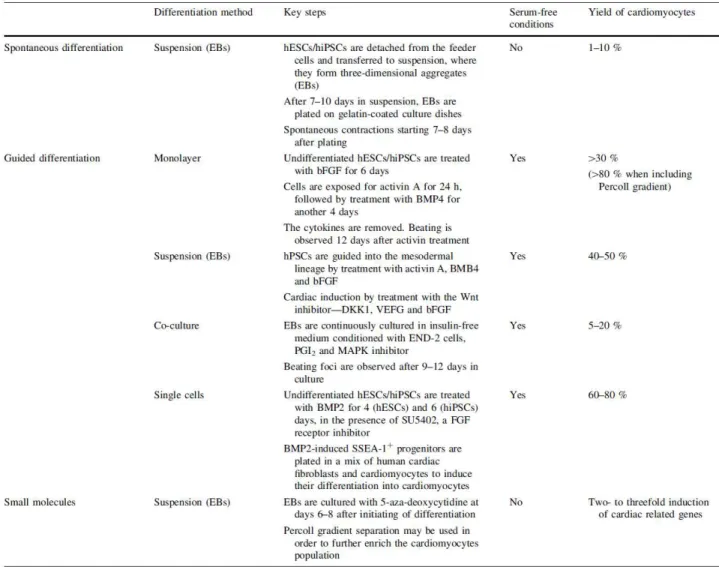
et al., 2011). During the last years several directed differentiation protocols have been published, each one using a different combination of growth factors/small molecules added into culture medium at specific time
points (Xu, 2012). Table 1.6 highlights some of these protocols as well as the major outcomes obtained in terms of CM yields. For example, the sequential addition of activin A, BMP4, basic fibroblast growth factor
17
et al., 2008). Despite usually assuring the production of CMs with higher yields and purities, the directed
differentiation protocols are normally associated with high costs (e.g. requires the use of expensive inductive factors) that compromises process scalability (Mummery et al., 2012).
1.3.5 Metabolic Dynamics during Development
Zygote development to multicellular organism requires higher cell growth, comparing with already formed
adult tissue. Though, it is reasonable to expect, that metabolic profiles would differ throughout the embryo development. Figure 1.8 describes the stages of mouse embryo development as well as the main metabolic
phenotype associated to each stage. In the first stage of embryo development, from one cell embryo (i.e. zygote) to morula formation, glycolysis rates are very low and pyruvate oxidation is the predominant
18
the mitochondria number (Folmes et al., 2012). During morula compaction, the first round of differentiation
occurs, and cells segregate to trophectoderm, which will originate the placenta, and to the pluripotent ICM (Shyh-Chang et al., 2013). At morula stage of embryogenesis, glucose uptake increases gradually,
accompanied by upregulation of GLUT1 and GLUT3 glucose transporters (Pantaleon and Kaye, 1998). At blastocyst stage, glycolysis rates become higher than pyruvate oxidation (Johnson et al., 2003).
Mitochondrial segregation among daughter cells occurs until implantation phase (until day 6, Egg Cyclinder, Figure 1.8). Following the implantation, mitochondrial replication increases enabling the
transition from glycolysis to a more oxidative metabolism (Johnson et al., 2003).
Figure 1.8: Metabolic profile during embryo development (Folmes et al., 2012).
1.3.6 Main metabolic differences between PSC and differentiated cells
Genome integrity is protected in hESCs through maintenance of low level of reactive oxygen species (ROS). This is achieved due to the combination of limited production of ROS molecules and due to increase ROS
removal capacity of ESCs (Armstrong et al., 2010). Limited production of reactive oxygen species is a consequence of low number of mitochondria located in embryonic stem cells (Facucho-Oliveira and St John, 2009). Therefore, it was remained unclear if hiPSCs produced from fibroblasts extra mitochondria and
possess the same ROS defense mechanism as hESCs. Recent findings suggest that mitochondria
(Facucho-19
Oliveira and St John, 2009), somatic cells mostly use mitochondrial oxidative phosphorylation to produce energy (ATP’s) (Folmes et al., 2011). PSCs have unlimited self-renewal capacity and thus to maintain high level of proliferation, these cells should balance energetic and biosynthetic needs (Zhang et al., 2012).
Glycolysis is the main source of energy and biomass precursors required for rapid proliferation of PSCs, while OXPHOS is preferentially used by quiescent cells (Zhang et al., 2012) (Figure 1.9).
Figure 1.9: Differences between proliferated cells (PSCs) and differentiated/quiescent cells metabolism (adapted from (DeBerardinis et al., 2008)). Energy metabolism shifts from glycolysis to OXPHOS with differentiation or from OXPHOS to glycolysis with reprogramming to pluripotency. Glycolytic flux is elevated in PSCs (right panel) to provide ATP and intermediate metabolites through the pentose phosphate pathway for nucleotide and lipid biosynthesis. Pluripotent cells rely more on glycolysis for energy because respiration is lower and less coupled to energy production than in differentiated cells. The TCA cycle in PSCs provides intermediate metabolites such as citrate and a-ketoglutarate that are siphoned for lipid and amino acid biosynthesis (Zhang et al., 2012).
1.3.7 Human Stem Cell derived Cardiomyocytes: Enrichment by Lactate
Different genetic and non-genetic methods have been applied to purify cardiomyocytes derived from hPSCs, such as percoll separation, flow activated cell sorting using mitochondrial dyes or specific surface markers. One recent and very simple method was to culture the cells in glucose-free lactate-containing media
20
(Tohyama et al. 2013). It is known that fetal heart can exploit lactate rich environment created by placenta
and use lactate as a major source of energy (Fisher et al., 1981). Based on this, Tohyama et al (2013) tested different cell lines under glucose-depletion condition (with or without lactate), and confirmed that CMs
survive in this culture medium whereas other cell types, such as primary peripheral lymphatic, primary fetal neurons, primary mouse embryonic fibroblast (MEFs), C2C12 cells, hepatocytes and renal cells (HEK293)
died. (Tohyama et al., 2013). With this strategy, CM purity increased up to 98% (Tohyama et al., 2013).
1.3.8 Maturation of CMs derived from hPSC
Several studies have shown that hPSC-derived CMs are immature and display fetal- and, in some cases,
embryonic-like phenotype, structural, metabolic and functional properties. Mature hCMs, better reflect the physiology of the adult heart and therefore could be more useful in disease modelling and drug testing.
Learning how to mature human CMs may also provide important clues about how our own heart matures in postnatal life. Additionally, since mature CMs present electric and mechanical properties more similar to native myocardium, it is expected that these cells will display less arrhythmic risk and have enhanced
contractile performance after transplantation and engraftment (Yang et al., 2014a). CMs maturation can be expressed by changes in cells morphology, metabolism, contractile properties and mitochondrial activities.
1.3.8.1 Morphology
While adult human CMs are rod shaped with lengths in the 100 μm range, hPSC-CMs are smaller in size (10 to 20 μm in diameter) and often round (Yang et al., 2014a). These cells tend to increase in size with prolonged time in culture; however, the shape of these cells remains round or oblong (Robertson et al., 2013;
21
Figure 1.10: A visual comparison of early hPSC-CM, late hPSC-CM and adult CM morphology. Early phase hPSC-CM, define the contractile cells, with some proliferative capacity and with embryonic like electrophysiology (i.e., small negative membrane potential and small action potential amplitude), and late phase hPSC-CM define CMs without proliferative capacity and with more adult-like electrophysiology (Robertson et al., 2013).
1.3.8.2 Contractile Apparatus
The sarcomere is the fundamental unit for CM contraction. Tracing of expression levels of sarcomeric proteins, such as cardiac troponin T, cardiac troponin I, α-actinin and β-myosin heavy chain, provides information about hiPSC-CMs assessment of specialization and maturation. Sarcomeric length is also
considerably shorter than that found in adult CMs.
1.3.8.3 Mitochondria and metabolic substrate
Mitochondrial structural and functional changes are critical components of maturation during heart development. In immature CMs, mitochondria distribute throughout the cytoplasm in a reticular network
23
2. AIM OF THE THESIS
The main aim of this thesis was to apply system biology tools to:
i) Comprehensively characterize the metabolism of the 1G3 trans-complementing cell line after
adenovirus vector infection;
ii) Elucidate phenotypic, structural and metabolic alterations during hiPSC differentiation towards CMs and maturation, and evaluate the impact of different culture media compositions on hPSC-CM
enrichment and maturation.
In the first part of the work, parallel labeling experiments and 13C-MFA were used for determination of
intracellular flux distributions in 1G3 cells under exponential growth and growth arrest conditions, both with and without AdV infection. The metabolomics techniques used in this part were YSI, HPLC and
GC-MS. In the second part of the thesis, metabolic characterization (including parallel labelling experiments and associated metabolomics techniques) was performed in combination with other tools to fully elucidate
phenotypic and functional alterations associated with hiPSC differentiation and CM maturation. Additional analytical techniques were used for phenotypic and structural characterization such as immunofluorescence
microscopy, flow cytometry, qRT-PCR and Transmission Electron Microscopy (TEM). The thesis aims and strategy used are schematically illustrated in Figure 2.1.
25
3. MATERIALS AND METHODS
3.1 Adenovirus particles production
3.1.1 Cell line and maintenance
The 1G3 cell line has been previously established at our lab (Silva et al., 2015) by immortalization of primary human amniocytes with the plasmid pSTK146UBE2I (Schiedner et al., 2000). Cells were maintained in Dulbecco´s Modified Eagle Medium (DMEM, Gibco, Paisley, UK) supplemented with 1% (v/v) Fetal Bovine Serum (FBS, Gibco), using T-225 flasks in a humidified atmosphere at 37°C with 5% CO2. Sub-culture was performed twice a week. For cell harvesting, the monolayer was washed with
phosphate buffered saline (PBS) and incubated with 0.05% trypsin-EDTA (Invitrogen, UK) until cell detachment.
3.1.2 AdV5 production and titration
The viral vector consisted of an E1-deleted HAdV-5 with an enhanced green fluorescent protein (eGFP) as transgene (HAdV5-GFP). The vector is based on the plasmid pGS66 that contains HAdV-5 sequences from nt 1 to 440 and from nt 3523 to 25935 (Schiedner et al., 2000; Silva et al., 2015).The expression cassette
consisting of the hCMV immediate early promoter, a cDNA coding for the eGFP protein and the SV40
polyA signal replace the E1 region in the pGS66 plasmid (Silva et al., 2015). N52.E6 cells were transfected with DNA plasmid, cleaved by SwaI (flanking the adenovirus ITRs), providing production of the HAdV5-GFP vector, which was followed by a purification step with CsCl gradients (Silva et al., 2015).
A viral stock was prepared by infecting HEK293 cells at 80-90% confluence in DMEM with 10% (v/v) FBS. Infection was performed with a multiplicity of infection (MOI) of 5 infection particles per cell. 40 h
after infection, cells were trypsin-harvested and the cell pellet was lysed with 0.1% (v/v) Triton X-100 (Sigma-Aldrich, Steinhein, Germany) in 10 mM Tris-HCl buffer at pH=8. Intracellular infectious particles were collected after centrifuging resuspended cells in lysis buffer for 10 min at 3000 g, 4°C. A desalting step was then performed on an AKTA system using a HiPrep 26/10 Desalting Column (GE Healthcare,
USA) to change the previous buffer with 10 mM Tris-HCl, 2 mM MgCl2, 0.5 M trehalose, pH=8. Aliquots
of viral stock were stored at -85°C.
Quantification of infectious particles was performed by Flow Cytometry as described in (Ferreira et al., 2009). Briefly, HEK293 cells (ATCC CRL-1573) were seeded at 0.25×10⁶ cells/well and infected 12 h (hpi)
![Table 1.1: Radioisotope studies with parallel labeling experiments. Notes: [1]gluc denotes[1-14C]gluc, unless stated otherwise](https://thumb-eu.123doks.com/thumbv2/123dok_br/16479624.732349/25.918.114.797.400.834/table-radioisotope-studies-parallel-labeling-experiments-notes-denotes.webp)
![Table 1.2: Stable-isotope studies with parallel labeling experiments. Notes: [1]gluc denotes [1-13C]gluc, unless stated otherwise](https://thumb-eu.123doks.com/thumbv2/123dok_br/16479624.732349/26.918.118.790.374.950/table-stable-isotope-studies-parallel-labeling-experiments-denotes.webp)