ACPD
9, 18985–19008, 2009Impacts of electronically photo-excited NO2
J. J. Ensberg et al.
Title Page
Abstract Introduction
Conclusions References
Tables Figures
◭ ◮
◭ ◮
Back Close
Full Screen / Esc
Printer-friendly Version
Interactive Discussion
Atmos. Chem. Phys. Discuss., 9, 18985–19008, 2009 www.atmos-chem-phys-discuss.net/9/18985/2009/ © Author(s) 2009. This work is distributed under the Creative Commons Attribution 3.0 License.
Atmospheric Chemistry and Physics Discussions
This discussion paper is/has been under review for the journalAtmospheric Chemistry and Physics (ACP). Please refer to the corresponding final paper inACPif available.
Impacts of electronically photo-excited
NO
2
on air pollution control strategies in
the South Coast Air Basin of California
J. J. Ensberg1,*, M. Carreras-Sospedra1, and D. Dabdub1
1
Department of Mechanical and Aerospace Engineering, University of California at Irvine, Irvine, California, USA
*
now at: The California Institute of Technology, Pasadena, California, USA
Received: 8 August 2009 – Accepted: 26 August 2009 – Published: 11 September 2009
Correspondence to: D. Dabdub ([email protected])
ACPD
9, 18985–19008, 2009Impacts of electronically photo-excited NO2
J. J. Ensberg et al.
Title Page
Abstract Introduction
Conclusions References
Tables Figures
◭ ◮
◭ ◮
Back Close
Full Screen / Esc
Printer-friendly Version
Interactive Discussion
Abstract
A new path for hydroxyl radical formation via photo-excitation of nitrogen dioxide (NO2)
and the reaction of photo-excited NO2with water is evaluated using the UCI-CIT model
for the South Coast Air Basin of California (SoCAB). Two separate studies predict dif-ferent reaction rates, which differ by nearly an order of magnitude, for the reaction of
5
photo-excited NO2 with water. Impacts of this new chemical mechanism on ozone
and particulate matter formation, while utilizing both reaction rates, are quantified by simulating a two-day summer episode. In addition, sensitivity simulations are con-ducted to evaluate the uncertainty in the rate of reaction of photo-excited NO2 with
water reported in the literature. Results indicate that the addition of photo-excited NO2
10
chemistry increases peak 1-h average ozone concentrations by up to 20.6%. Also, the new chemistry leads to moderate increases in particulate matter concentrations of up to 2.9%.
The importance of this new chemistry is then evaluated in the context of pollution control strategies. A series of simulations are conducted to generate isopleths for
15
ozone and particulate matter concentrations, varying baseline nitrogen oxides (NOx)
and volatile organic compounds emissions. Results show that including NO2 photo-excitation increases the sensitivity of ozone concentration to changes in NOx
emis-sions. Namely, increasing NOx when NO2 photo-excitation is included, while utilizing
the higher reaction rate, leads to an increase in ozone concentration of up to 38.7%
20
higher than a case without photo-excited NO2. Ozone and particulate matter control
strategies rely heavily on the variation of NOx and VOC emissions and the addition of
the new chemical mechanism increases peak ozone and 24-h average PM concentra-tions in all locaconcentra-tions under all NOxand VOC scaling factors while utilizing both reaction
rates. Therefore, three-dimensional air quality models should be modified to include
25
this new OH production mechanism, especially if used to develop emission controls strategies.
ACPD
9, 18985–19008, 2009Impacts of electronically photo-excited NO2
J. J. Ensberg et al.
Title Page
Abstract Introduction
Conclusions References
Tables Figures
◭ ◮
◭ ◮
Back Close
Full Screen / Esc
Printer-friendly Version
Interactive Discussion
1 Introduction
The hydroxyl radical (OH) is one of the most important oxidants in the troposphere during daylight hours. It oxidizes volatile organic compounds (VOCs) and participates in the catalytic cycle of ozone formation. In remote areas, OH is produced via pho-tolysis of ozone (O3) in the presence of water. In polluted atmospheres, OH is also
5
formed by the photolysis of nitrous acid (HONO) and hydrogen peroxide (H2O2). In
ad-dition, OH is formed through reaction of hydroperoxy radical (HO2) and nitrous oxide. Hence, sources of HO2are eventual sources of OH. All these reactions have been long
recognized as the major formation paths of OH and ozone.
O3+hυ→O(1D)+O2 (R1)
10
O(1D)+H2O→2OH (R2)
HONO+hυ→OH+NO (R3)
H2O2+hυ→2OH (R4)
HO2+NO→NO2+OH (R5)
where h is Planck’s constant and isυ a photon of light with wavelength λ. A recent
15
study by Li et al. (2008) suggested that an additional source of OH could contribute significantly to OH formation. The new OH production mechanism is as follows:
NO2+hυ→NO∗2 (R6)
NO∗2+H2O→HONO+OH (R7)
NO∗2+M →NO2 (R8)
20
ACPD
9, 18985–19008, 2009Impacts of electronically photo-excited NO2
J. J. Ensberg et al.
Title Page
Abstract Introduction
Conclusions References
Tables Figures
◭ ◮
◭ ◮
Back Close
Full Screen / Esc
Printer-friendly Version
Interactive Discussion
the yield of Reaction (R7), and suggested that this new mechanism has a limited im-pact on the OH formation. In contrast to these results, the study by Li et al. (2008) reported a reaction rate for Reaction (R7) to be an order of magnitude higher than that found by Crowley and Carl (1997). Despite the ambiguity as to the appropriate reac-tion rate to associate with Reacreac-tion (R7), both Li et al. (2008) and Crowley and Carl
5
(1997) show that Reactions (R6–R8) have the potential to increase the amount of OH which is produced in the troposphere. Given the dependence of ozone production on OH concentrations in urban areas, the increase in OH due to Reaction (R7) must be considered when simulating ozone formation and formulating ozone control strategies. Traditional control strategies for ozone focus on reducing NO and NO2 (together
10
known as NOx) as well as VOC emissions. In conjunction with sunlight, OH, NOx and VOC mixing ratios play a key role in the amount of ozone that is produced throughout the day. Ozone control strategies are based on previous experimental and numerical studies and most, for the South Coast Air Basin of California (SoCAB), focus on reduc-ing VOC emissions more aggressively than NOx emissions (Chock et al., 1999; Meng
15
et al., 1997; Milford et al., 1994). Some studies that analyzed weekday to weekend differences in NOx, VOC, and ozone levels suggest that in areas where NOxemissions are high, such as the SoCAB, decreasing NOx emissions may even have negative
effects on peak ozone concentrations. This is due to the inability of the termination reaction of NO2 with OH to produce nitric acid and remove OH from the system (Qin
20
et al., 2004; Blanchard and Tanenbaum, 2003; Chinkin et al., 2003; Fujita et al., 2003). However, no study, to date, has included Reactions (R6–R8) into a three-dimensional air quality model to assess their impacts on emission control strategies.
The first objective of this study is to analyze the effect of including NO2
photo-excitation processes in a three-dimensional air quality model. A statistical analysis
25
is performed to quantify the improvement in air quality model performance due to the addition of the new chemistry. The second objective of this study is to determine how the addition of Reactions (R6–R8) affects potential air pollution control strategies. The results of this study demonstrate not only the positive effects NO∗2 has on model
ACPD
9, 18985–19008, 2009Impacts of electronically photo-excited NO2
J. J. Ensberg et al.
Title Page
Abstract Introduction
Conclusions References
Tables Figures
◭ ◮
◭ ◮
Back Close
Full Screen / Esc
Printer-friendly Version
Interactive Discussion
curacy, but also show the impacts of NO∗2on current ozone control strategies and the direction future strategies should follow. Several statistical norms are presented to verify model accuracy and the validity of ozone concentration predictions.
2 Methodology
Three dimensional air-quality models have become the status quo for determining the
5
impacts of newly discovered chemical reactions on pollution control strategies. Numer-ical simulations for this study are performed using the UCI-CIT Airshed Model (Harley et al., 1993). The UCI-CIT model was developed at the California Institute of Tech-nology and continues to be upgraded by the Computational Environmental Sciences Laboratory (CESLab) at the University of California, Irvine. The modeling domain used
10
for this study is presented in Fig. 1.
2.1 Model evaluation for new chemical mechanism
The scientific literature reports two different reaction rates associated with Reac-tion (R7), which are shown in Table 1. Therefore, this study explores the impacts of both reaction rates on ozone formation. Three simulated cases are compared to
mete-15
orological and air quality data measured by the California Air Resources Board (ARB) on 27–28 August 1987. Data were collected as part of the Southern California Air Quality Study (SCAQS) and have been used extensively to validate air quality models in other studies (Meng et al., 1998; Griffin et al., 2002). In addition, Zeldin et al. (1990) indicated that 28 August 1987 is representative of the meteorological conditions in the
20
South Coast Air Basin of California, which makes it suitable for modeling an air quality episode. Hence, meteorological and air quality data for 27–28 August are used as the basis for the assessment of the impact of the photo-excitation processes on ozone and particulate matter control dynamics.
The three simulated cases include: (i) the UCI-CIT Airshed Model’s base case, which
ACPD
9, 18985–19008, 2009Impacts of electronically photo-excited NO2
J. J. Ensberg et al.
Title Page
Abstract Introduction
Conclusions References
Tables Figures
◭ ◮
◭ ◮
Back Close
Full Screen / Esc
Printer-friendly Version
Interactive Discussion
do not include Reactions (R6–R8), (ii) a case which includes the new chemistry while utilizing Li et al.’s high reaction rate for Reaction (R7), hence referred to as the “high reaction rate case”, and (iii) a case which includes the new chemistry while utilizing Crowley and Carl’s low reaction rate case for Reaction (R7), hence referred to as the “low reaction rate case”. The three simulated cases are summarized in Table 1.
5
Model performance for the three cases is evaluated using the following statistical norms, as described by Russell and Dennis (2000), which were used previously to assess the performance of the UCI-CIT Airshed Model and its representation of sec-ondary organic aerosols (Griffin et al., 2002):
Normalized bias, D
10
D= 1
N
XN
i=1
(Cp(xi, t)−Co(xi, t))
Co(xi, t)
, t =1,24. (1)
Gross error,Ed (for hourly observed values of O3>60 ppb)
Ed =
1 N
XN
i=1
|Cp(xi, t)−Co(xi, t)|
Co(xi, t) , t =1,24. (2)
Unpaired peak prediction accuracy,Au
Au =Cp(x, t)max−Co(x
′
, t′)max Co(x′, t′)max
×100%. (3)
15
Total Unpaired peak prediction accuracy,Au
Au,total=
1 N
XN
i=1
Cp(x, t)max,i−Co(x′, t′)max,i
Co(x′, t′)
max,i
×100%. (4)
whereN is the number of monitoring stations,xi is the location of the monitoring
sta-tion i, Co(xi, t) is the observed value at monitoring station i for hour t, Cp(xi, t) is the predicted value at monitoring stationi for hourt,Co(x′, t′)max is the maximum 1 h
20
observed concentration over all hours and monitoring stations,Cp(x, t)max and is the
ACPD
9, 18985–19008, 2009Impacts of electronically photo-excited NO2
J. J. Ensberg et al.
Title Page
Abstract Introduction
Conclusions References
Tables Figures
◭ ◮
◭ ◮
Back Close
Full Screen / Esc
Printer-friendly Version
Interactive Discussion
maximum 1 h predicted concentrations over all hours and surface cells. The statistical analysis is based on the measured values by the air quality monitoring network existing during that episode, which included 30 monitoring stations.
2.2 Evaluation of emission control strategies
Previous studies have attempted to quantify the effects of altering NOx and VOC
emis-5
sion scaling factors on the formation of aerosol pollutants and the reduction of ozone (Winner et al., 1995; Meng et al., 1997; Nguyen and Dabdub, 2002). In this study, multiple day summer smog episodes are simulated while accounting for all feasible combinations of NOx and VOC emission ratios. In all three cases, the emissions of NOx and VOC emissions are amplified by factors of 0.0, 0.4, 0.8, 1.0, 1.2, 1.6, 2.0,
10
throughout the domain of the model. Pollutants are calculated for each combination of NOx and VOC emission scaling factors, which results in 49 emission profiles per case. Simulation results are illustrated in isopleth charts to illustrate the dynamics of emission reductions. This study focuses on isopleths constructed for each of the three cases using the peak ozone concentration and 24-h average PM10 concentration at
15
selected locations. The impact of the new chemistry on emission control strategies is then evaluated by calculating the difference between isopleths resulting from including Reactions (R6–R8) at specific locations and the base case.
3 Results
3.1 Baseline air quality simulations
20
ACPD
9, 18985–19008, 2009Impacts of electronically photo-excited NO2
J. J. Ensberg et al.
Title Page
Abstract Introduction
Conclusions References
Tables Figures
◭ ◮
◭ ◮
Back Close
Full Screen / Esc
Printer-friendly Version
Interactive Discussion
this technique reduces irregularities caused by initial conditions up to 90% after 2 days of simulation (Nguyen and Dabdub, 2002).
Since NO2 photolyzes throughout the day to produce NO, it is important to analyze
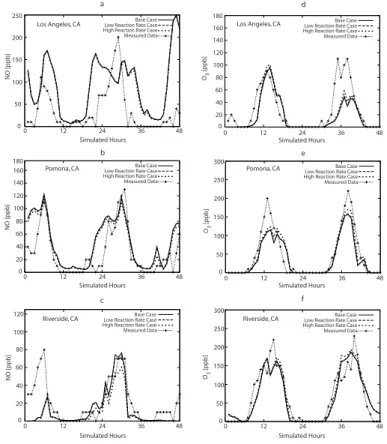
NO2 and NO separately and not as NOx. Figure 2a–c shows the 1-h NO
concentra-tions, resulting from the simulated cases together with measured concentrations in the
5
cities of Los Angeles, Pomona, and Riverside for 27–28 August, 1987. Figure 2d–f shows the simulated and measured 1-h average ozone concentrations for the same cities and period of time. Simulated results shown in Fig. 2 correspond to the three cases described above. The corresponding NO2concentration plots (not shown) also
present substantial increases of peak NO2concentrations which are also amplified by
10
the use of the high reaction rate as opposed to the low reaction rate. This is due to NO2 molecules which become excited, but do not react with H2O, and later become
quenched during peak concentration hours.
The incorporation of Reactions (R6–R8) results in a decrease in NO for Riverside throughout the two-day simulation. The maximum decrease in NO is 20 ppb, which
15
occurs at hour 30 in the high reaction rate case. Similar trends in NO decreases occur in Los Angeles, although the differences are considerably smaller, with maximum decreases in NO concentrations less than 1–2 ppb. Pomona also exhibits similar trends in NO reduction with the inclusion of Reactions (R6–R8). The maximum decrease results at hour 41 and is close to 10 ppb. These decreases are due to the inability of
20
NO∗2 to dissociate into NO and O(3P) until it is quenched to its ground-state, NO2, by
either O2 or N2. This observation is further confirmed by the decreases in NO being
larger for the high reaction rate case than for the low reaction rate case.
Ozone is one of the main pollutants of interest, and the resulting increases in ozone concentrations presented in Fig. 2d–f merit significant attention. In Los
An-25
geles, Fig. 2d, the second simulated peak concentration, for both simulated cases are much lower than the measured values. However, the maximum increases in simu-lated ozone concentration due to Reactions (R6–R8) still occur at the peaks and are equal to 20 ppb. Measured ozone concentrations in Pomona, Fig. 2e, during the first
ACPD
9, 18985–19008, 2009Impacts of electronically photo-excited NO2
J. J. Ensberg et al.
Title Page
Abstract Introduction
Conclusions References
Tables Figures
◭ ◮
◭ ◮
Back Close
Full Screen / Esc
Printer-friendly Version
Interactive Discussion
peak are close to 100 ppb higher than any predicted concentrations. The maximum dif-ferences between simulated concentrations and measured concentrations during the second peak decrease to 50 ppb, although there is a much stronger similarity in shape among all four cases. Similar trends in ozone increases occur in Riverside, Fig. 2f. By including Reactions (R6–R8) into the simulation, an increase in ozone production
5
occurs during all daylight hours. The high reaction rate results in the largest increases in ozone, with the maximum differences being approximately 10 ppb and occurring at the two peaks (hour 16 and hour 39). Although the simulated peak concentrations are significantly less than the measured peak concentrations at this location, there is still much overlap in the shape between all four cases throughout the 48 h simulation.
10
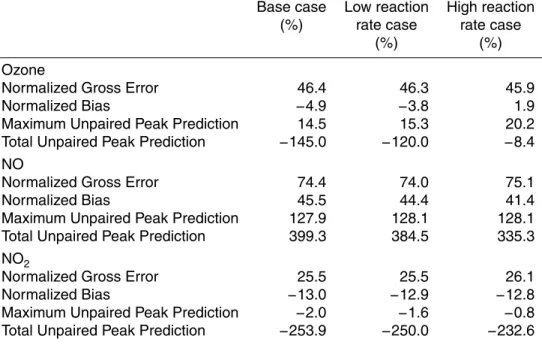
The model performance results for the base case and the cases with the addition of Reactions (R6–R8) are summarized in Table 2. Total normalized error and bias in the low reaction rate case decrease by 0.1% and 1.2%, respectively, in relation to the base case. Total normalized error and bias in the high reaction rate case decrease by 0.5% and 2.0%, respectively, in relation to the base case. The most substantial
15
improvement in the UCI-CIT Airshed Model performance occurs for its total unpaired peak predictions of ozone concentrations. This norm shows that the predicted peak ozone concentrations become substantially closer to the measured peak ozone con-centrations at each measuring location. Note that positive errors cancel negative errors when matching peak predictions with measured concentrations using the total unpaired
20
peak prediction norm. This statistical measure is quite significant when formulating ozone control strategies because if peak concentrations are within acceptable limits, then concentrations at other hours will be consequently within acceptable limits.
3.2 Impacts of excited nitrogen dioxide on ozone control strategies
Los Angeles and Riverside have been the focus of several studies due to their
notori-25
ously poor air quality and high levels of NOx and VOC emissions. Due to its location
ACPD
9, 18985–19008, 2009Impacts of electronically photo-excited NO2
J. J. Ensberg et al.
Title Page
Abstract Introduction
Conclusions References
Tables Figures
◭ ◮
◭ ◮
Back Close
Full Screen / Esc
Printer-friendly Version
Interactive Discussion
Isopleths created using peak ozone concentrations in Los Angeles are considerably different than those for Riverside. This is primarily due to the differences in emissions between the two cities.
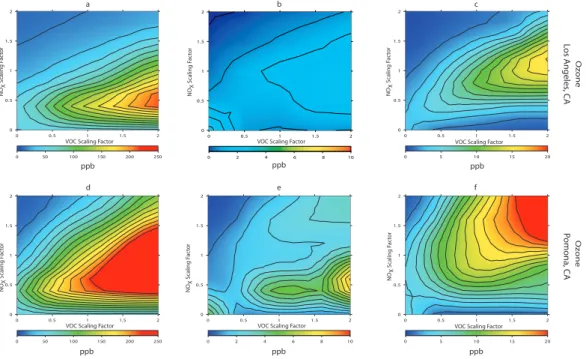
The resulting peak 1-h average ozone isopleths for Los Angeles are shown in Fig. 3a–c. Figure 3b shows the differences in ozone concentrations in Los Angeles
5
between the low reaction rate case and the base case, whereas Fig. 3c presents the differences between the high reaction rate case and the base case. Although the two figures have somewhat similar shapes, the high reaction rate case results in much larger increases in ozone concentrations (12–15 ppb). The largest peak 1-h average ozone concentration in Fig. 3a occurs at VOC factor equal to 2 and NOx factor equal
10
to 0.4. However, the differences in peak ozone concentrations due to Reactions (R6– R8) steadily increase with increasing VOC factors, but reach a maximum increase at NOx equal to 1.2, and then begin to decrease. The existence of this maximum
il-lustrates the change from NOx-limited conditions to VOC-limited conditions, which is determined by the VOC to NOx ratio present in that particular location. The
impor-15
tance of VOC to NOxratios, which relates ozone sensitivity to NOxand VOC emission
changes, is discussed in the following section. The inclusion of Reactions (R6–R8) not only results in an∼8% increase in peak ozone concentrations, but also causes the in-crease to occur in an isopleth regime – pair of VOC and NOxemissions scaling factors
– that does not coincide with peak ozone concentrations in the base case as shown in
20
Fig. 3a. The differences between peak ozone concentrations in cases with and with-out the new chemistry distort the shape of the isopleths in the high and low reaction rate cases with respect to the base case, suggesting the need for re-evaluation of the dynamics of ozone and particulate matter control strategies.
The evaluation of isopleths based on Los Angeles alone merits reconsidering how
25
aggressively NOxand VOC emissions should be controlled to reduce peak ozone
con-centrations. This is further confirmed by evaluating results in Pomona and Riverside. Pomona is the location for which peak ozone concentrations in the high and low reac-tion rate cases differ the most. Figure 3d shows the isopleths composed of the peak
ACPD
9, 18985–19008, 2009Impacts of electronically photo-excited NO2
J. J. Ensberg et al.
Title Page
Abstract Introduction
Conclusions References
Tables Figures
◭ ◮
◭ ◮
Back Close
Full Screen / Esc
Printer-friendly Version
Interactive Discussion
ozone concentrations in Pomona for the base case. Figure 3e presents the differences in ozone concentration between the low reaction rate case and the base case, and it indicates that the greatest increase in ozone (8 ppb) due to Reactions (R6–R8) oc-curs at NOx equal to 0.5 and VOC equal to 2.0. Conversely, Fig. 3f indicates that the
increase in ozone due to the high reaction rate scales nearly equal with increasing
5
NOx and VOC factors. The largest increase in ozone for the high reaction rate case
in Pomona is 25 ppb and occurs at NOx equal to 2 and VOC equal to 2. Therefore,
Pomona illustrates the necessity to clarify what reaction rate should be used in Reac-tion (R7). Instead of the variaReac-tions in peak ozone concentraReac-tions being a funcReac-tion only of whether or not Reactions (R6–R8) are included in the UCI-CIT model, as is the case
10
in Los Angeles and Riverside, they are now strongly a function of which reaction rate is used. Given the increased accuracy of the model in the high reaction rate case, it is believed that the differences present in Fig. 3f should be used more extensively when formulating ozone control strategies.
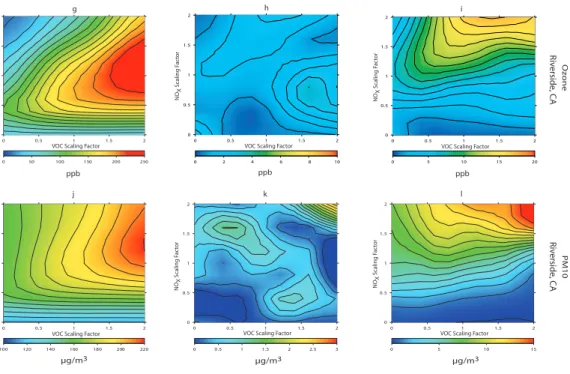
The resulting peak 1-h average ozone isopleths for Riverside are shown in Fig. 3g–
15
i. Figure 3g shows the peak 1-h average ozone concentrations for the base case conditions, whereas Fig. 3h–i show the difference between the base case and the low and high reaction rate case, respectively. By including Reactions (R6–R8), Fig. 3h shows increases of 1–2 ppb for most of the grid. There is a small region, centered at NOx equal to 0.8 and VOC equal to 1.6, which results in increases between 2–4 ppb.
20
The differences present in Fig. 3h are negligible when compared to the base case concentrations (∼0.8%). Figure 3i, which corresponds to the high reaction rate, shows significantly larger differences in ozone production. The peak ozone concentrations steadily increase with increasing NOxand VOC. Ozone concentrations increase by up
to 18 ppb and these increases occur in the region above NOx equal to 1.2 and VOC
25
ACPD
9, 18985–19008, 2009Impacts of electronically photo-excited NO2
J. J. Ensberg et al.
Title Page
Abstract Introduction
Conclusions References
Tables Figures
◭ ◮
◭ ◮
Back Close
Full Screen / Esc
Printer-friendly Version
Interactive Discussion
3.3 Importance of VOC/NOxRatio
Ozone control strategies rely primarily on the variation of NOx and VOC emissions to abate ozone production. OH reacts with both NOx and VOC which is directly emitted
or transported from upwind, to produce ozone. The ratio of VOC to NOx determines
which process is likely to be initiated by an OH molecule. At high VOC to NOx ratios,
5
OH primarily reacts with VOC which enhances the formation of ozone. At low VOC to NOx ratios, the reactions between NOx and OH dominate, which is a termination
reaction for ozone formation.
OH+NO2+M→HNO3+M . (R9)
There is a specific VOC to NO2ratio above which Reaction (R9) results in the
termi-10
nation of OH and NO2from the system, which decreases the rate of ozone production. Seinfeld and Pandis (2006) examined a simplified mechanism and found this ratio to be 5.5 to 1. Results indicate that the transitional VOC to NOx ratio for the UCI-CIT
Air-shed Model is closer to 15 to 1. Therefore, below this limit, increasing NOx emissions results in the removal of OH from the system and the overall decrease in ozone
produc-15
tion. In addition, NOx acts as a sink for ozone through direct titration (Reaction R10).
NO+O3→O2+NO2. (R10)
In the South Coast Air Basin of California, baseline NOx emissions are generally
high, providing atmospheric conditions under low VOC to NOx ratios. Under these conditions, decreasing NOx alone leads to increases in ozone concentrations. For
20
instance, it is well recognized that a major cause for having statistically higher ozone concentrations of ozone during the weekends in the South Coast Air Basin of California is the lower emissions of NOx with respect to weekdays, which reduces the yield of
Reactions (R9–R10) (Qin et al., 2004; Blanchard and Tanenbaum, 2003; Chinkin et al., 2003; Fujita et al., 2003). The isopleths presented in Fig. 3a, d and g show that a
25
ACPD
9, 18985–19008, 2009Impacts of electronically photo-excited NO2
J. J. Ensberg et al.
Title Page
Abstract Introduction
Conclusions References
Tables Figures
◭ ◮
◭ ◮
Back Close
Full Screen / Esc
Printer-friendly Version
Interactive Discussion
ozone concentration, whereas moderate decreases in VOC emissions alone reduce ozone concentrations immediately. In general, the higher the emissions of NOx, and
the lower VOC to NOx ratios, the more difficult is to reduce ozone by controlling NOx
emissions alone. For example, in Los Angeles, with total NOx emissions of up to 6.59 t/day and VOC/NOx equal to 6.79, a reduction in NOx emissions of 60% would
5
increase ozone concentration by 244%. Total NOxemissions in Pomona and Riverside
are 1.57 t/day and 1.02 t/day, and respective VOC to NOxratios are 7.71 and 11.5. A decrease in NOx emissions of 60% in Pomona results in a 41.1% increase in ozone
concentrations, whereas the same decrease will result in an 8.29% decrease in ozone concentrations in Riverside.
10
The incorporation of Reactions (R6–R8) increases peak ozone concentrations in all locations under all NOx and VOC scaling factors. The increases in ozone
concen-trations occur because the mechanism inactivates a molecule of NO2 through
photo-excitation, that otherwise could react with OH and would terminate the ozone produc-tion. The OH produced by the reaction of photo-excited NO2with water can then
par-15
ticipate in the oxidation of another VOC molecule, increasing ozone production. This deactivation of NO2 increases the effective VOC to NOx ratio, and as a result, ozone increases in greater extent than if photo-excitation of NO2 is not included. However,
the extent of the ozone increases due to the new mechanism varies from location to location, as a function of the baseline NOx emissions and the resulting VOC to NOx
20
ratios. This variability in the impacts of NO2photo-excitation is more evident in the high
reaction rate case.
As shown in Fig. 3c, in Los Angeles, the maximum increases in ozone concentration occur at NOx scaling factors of 1–1.2. At higher NOx scaling factors, the contribution
of NO2photo-excitation to ozone production diminishes because the overall ozone
for-25
mation is limited by the high emissions and the low VOC to NOx ratios. Conversely, in Pomona and Riverside, the contribution of NO2photo-excitation to ozone formation
increases with the increase in NOx scaling factors (Fig. 3f and i), because in these
ACPD
9, 18985–19008, 2009Impacts of electronically photo-excited NO2
J. J. Ensberg et al.
Title Page
Abstract Introduction
Conclusions References
Tables Figures
◭ ◮
◭ ◮
Back Close
Full Screen / Esc
Printer-friendly Version
Interactive Discussion
in ozone production due to the new mechanism is not offset by the high level of NOx emissions, and hence, ozone concentrations in the high reaction rate case increase with respect to the base case, as the scaling factor for NOx increases. It should be
noted that the increases in ozone concentration in Riverside tend to occur at higher NOx scaling factors and lower VOC scaling factors than in Pomona, because VOC to
5
NOxratio is higher in Riverside. Despite both areas having comparable emissions, the
VOC to NOxratio in Riverside is significantly higher than in Pomona. These differences are attributed to upwind concentrations. Pomona, which is downwind from Los Ange-les, is affected by the upwind high NOx levels that limit the formation of ozone at high
NOx scaling factors. On the other hand, Riverside is farther downwind from Pomona,
10
which lowers the sensitivity to NOxemissions from Los Angeles.
3.4 Impacts of excited nitrogen dioxide on PM concentrations
Although ozone control strategies are the main consideration of this study, there are several other pollutants whose production is strongly connected to ozone production. These pollutants, such as particulate matter whose diameter is less than 10 µm (PM10)
15
and particulate matter whose diameter is less than 2.5 µm (PM10), are strongly affected
by including Reactions (R6–R8) into the UCI-CIT model. Figure 3j shows isopleths of the 24-h average concentrations of PM10 in Riverside for the base case on 28
Au-gust, 1987. As discussed by Nguyen and Dabdub (2002), in the regime of low NOx
scaling factors, formation of secondary particles increases linearly with the increase
20
in NOx emissions. This increase is tightly related to the increase in ozone
concen-tration shown in Fig. 3g. Increasing ozone concenconcen-tration increases the formation of OH, via Reactions (R1–R2), which in turn can react with NO2to form nitric acid which eventually produces aerosols via Reaction (R11):
HNO3(g)+NH3(g)⇋NH4NO3(p). (R11)
25
Under a regime of high NOxand low VOC scaling factors, NOxends up removing O3,
ACPD
9, 18985–19008, 2009Impacts of electronically photo-excited NO2
J. J. Ensberg et al.
Title Page
Abstract Introduction
Conclusions References
Tables Figures
◭ ◮
◭ ◮
Back Close
Full Screen / Esc
Printer-friendly Version
Interactive Discussion
ozone concentrations are the highest, producing high levels of OH and particles. In addition, in this regime of high NOxand VOC, formation of particles also has significant
contributions from the formation of N2O5 at night by the reaction of ozone with NOx
(as suggested by Nguyen and Dabdub, 2002). N2O5can then react with water to form nitric acid, which leads to the formation of particles.
5
As with ozone, the low reaction rate case results in small (∼1.0%) increases in peak 1-h average PM10concentrations for all NOxand VOC scaling factors. Figure 3k shows a complementary relationship between NOx and VOC emission scaling factors which
causes PM10 to increase at high NOxand low VOC as well as low NOxand high VOC.
The largest increase in PM10 concentrations occur for NOx and VOC factors equal to
10
2.0 and are equal to 1.4%.
In the high reaction rate case (see Fig. 3l), the addition of Reactions (R6–R8) leads to increases in 24-h average PM10 concentrations of up to 8.0%. Also, the differences
in PM10 concentrations are almost entirely dependent on NOx scaling factors below 1.8. There are two main mechanisms that explain this behavior. First, the increase in
15
NOx increases the potential formation of photo-excited NO2, which can then form OH
molecules that will end up forming aerosols. Second, particulate matter formation is tightly related to ozone, as more ozone photolyzes during the day to produce OH, or it reacts with NOxat night to produce N2O5.
Previously, Nguyen and Dabdub (2002) found that PM10 formation in the SoCAB
20
is significantly more sensitive to changes in ammonia emissions than to either VOC or NOxemissions. The results presented in this article, however, suggest that the addition
of NO2photo-excitation could increase the sensitivity of particle formation to changes in NOx emissions. Namely, a decrease in NOx emissions would achieve a higher
de-crease in particle formation if photo-excitation of NO2were included. Therefore,
Reac-25
ACPD
9, 18985–19008, 2009Impacts of electronically photo-excited NO2
J. J. Ensberg et al.
Title Page
Abstract Introduction
Conclusions References
Tables Figures
◭ ◮
◭ ◮
Back Close
Full Screen / Esc
Printer-friendly Version
Interactive Discussion
4 Conclusions
This study is the first to incorporate a new alternative path of hydroxyl radical formation via electronic photo-excitation of NO2 into the chemical mechanism of a three
dimen-sional air quality model. This study includes the analysis of uncertainty associated with the reaction rate of electronically excited NO2with water to form OH, based on studies
5
performed by Li et al. (2008) and Crowley and Carl (1997). Results are used to assess the effects of the new mechanism on model accuracy and its impacts on ozone control strategies in the South Coast Air Basin of California.
The sensitivity of ozone and particulate matter formation to the new chemical path are quantified by simulating a two-day summer episode. The resulting simulated
con-10
centrations for the high reaction rate case (based on Li et al. 2008), the low reaction rate case (based on Crowley and Carl, 1997), and the UCI-CIT base case are then compared statistically to measured concentrations. Results indicate the largest im-pacts of NO2photo-excitation on ozone concentrations occur at the peaks for all cases.
Results also show that model predictions of peak ozone concentrations improve upon
15
including the new chemical mechanism into the UCI-CIT model. In particular, substan-tial improvements occur for peak ozone predictions at each location in the high reaction rate case.
Results of emission control strategies indicate that the impacts of NO2
photo-excitation are most evident in the high reaction rate case. In areas with high NOx
20
emissions and low VOC to NOx ratios, such as Los Angeles, the highest increases in
peak ozone concentrations due to the new mechanism occur for moderate increases of NOx emissions. In downwind cities with low NOx emissions and high VOC to NOx ratios, such as Pomona and Riverside, the impacts of the new chemical mechanism are strongest with high NOxemissions. Ozone concentrations in these three locations
25
experience little change in sensitivity to VOC emissions. Moderate increases in 24-h average PM10 concentrations result in the high reaction rate case. Also, at NOxscaling
factors below 1.8, the differences in PM10 concentrations are almost entirely
ACPD
9, 18985–19008, 2009Impacts of electronically photo-excited NO2
J. J. Ensberg et al.
Title Page
Abstract Introduction
Conclusions References
Tables Figures
◭ ◮
◭ ◮
Back Close
Full Screen / Esc
Printer-friendly Version
Interactive Discussion
dition of NO2photo-excitation increases the sensitivity of ozone and particle formation to changes in NOxemissions above that which previous studies report.
Ozone and particulate matter control strategies rely heavily on the variation of NOx
and VOC emissions and the addition of the new chemical mechanism increases peak ozone concentrations in all locations under all NOx and VOC scaling factors while
uti-5
lizing both reaction rates. Therefore, three-dimensional air quality models should be modified to include this new OH production path. The UCI-CIT air quality model’s abil-ity to predict accurately ozone and particulate matter formation in urban areas depend largely on which reaction rate is used in the new chemical mechanism. Based on model performance, strategies deduced from the high reaction rate case results should be
10
used more extensively when formulating ozone and particulate matter control strate-gies. However, there is still a large uncertainty as to what the true reaction rate is. Consequently, further experimental work must be conducted to reduce uncertainty in the reaction rate of Reaction (R7).
Acknowledgements. The authors would like to thank the Undergraduate Research
Opportuni-15
ties Program (UROP) at the University of California at Irvine for their support with this research project.
References
Blanchard, C. L. and Tanenbaum, S. J.: Differences between weekday and weekend air pollu-tant levels in southern California, J. Air Waste Manage., 53, 816–828, 2003.
20
California Air Resources Board: Air Quality Data Statistics. Aerometric Data Analysis and Man-agement system, http://www.arb.ca.gov/adam/welcome.html, last accessed 2008.
Chinkin, L. R., Coe, D. L., Funk, T., Hafner, H., Roberts, P., Ryan, P., and Lawson, D.: Weekday versus weekend activity patterns for ozone precursor emissions in California’s South Coast Air Basin, J. Air Waste Manage., 53, 829–843, 2003.
25
ACPD
9, 18985–19008, 2009Impacts of electronically photo-excited NO2
J. J. Ensberg et al.
Title Page
Abstract Introduction
Conclusions References
Tables Figures
◭ ◮
◭ ◮
Back Close
Full Screen / Esc
Printer-friendly Version
Interactive Discussion
Crowley, J. N. and Carl, S. A.: OH formation in the photoexcitation of NO2beyond the dissoci-ation threshold in the presence of water vapor, J. Phys. Chem., 101, 4178–4184, 1997. Fujita, E. M., Stockwell, W. R., Campbell, D. E., Keislar, R. E., and Lawson, D. R.: Evolution of
the magnitude and spatial extent of the weekend ozone effect in California’s South Coast Air Basin,1981–2000, J. Air Waste Manage., 53, 802–815, 2003.
5
Griffin, R. J., Dabdub, D., and Seinfeld, J. H.: Secondary organic aerosol, 1. Atmospheric chemical mechanism for production of molecular constituents, J. Geophys. Res., 107, 4332– 4358, 2002.
Harley, R. A., Russell, A. G., McRae, G. J., Cass, G. R., and Seinfeld, J. H.: Photochemical modeling of the Southern California air quality study, Envir. Sci. Tech., 27, 378–388, 1993.
10
Li, S. P., Matthews, J., and Sinha, A.: Atmospheric hydroxyl radical production from electroni-cally excited NO2and H2O, Science, 319, 1657–1660, 2008.
Meng, Z., Dabdub, D., and Seinfeld, J. H.: Chemical coupling between atmospheric ozone and particulate matter, Science, 277, 116–119, 1997.
Milford, J. B., Gao, D., Sillman, S., Blossey, P., and Russell, A. G.: Total reactive nitrogen (NOy)
15
as an indicator of the sensitivity of ozone to reductions in hydrocarbon and NOx emissions, J. Geophys. Res., 99D, 3533–3542, 1994.
Nguyen, K. and Dabdub, D.: NOxand VOC control and its effect on the formation of aerosols, Aerosol Sci. Tech., 36, 560–572, 2002.
Qin, Y., Tonnesen, G. S., and Wang, Z.: Weekend/weekday differences of ozone, NOx, CO,
20
VOCs, PM10and the light scatter during ozone season in Southern California, Atmos. Envi-ron., 38, 3069–3087, 2004.
Russell, A. and Dennis, R.: NARSTO critical review of photochemical models and modeling, Atmos. Environ., 34, 2283–2324, 2000.
Seinfeld, J. H. and Pandis, S. N.: Atmospheric Chemistry and Physics: From Air Pollution to
25
Climate Change, 2nd ed., Wiley, New Jersey, pp 235–238, 2006.
Winner, A. D., Cass, G. R. and Harley, R. A.: Effect of alternative boundary conditions on predicted ozone control strategy performance: A case study in the Los Angeles area, Atmos. Environ., 29, 3451–3464, 1995.
Zeldin, M. D., Bregman, L. D., and Horie, Y. A.: Meteorological and air quality assessment of
30
the representativeness of the 1987 SCAQS Intensive Days, Final report to the South Coast Air Quality Management District, 1990.
ACPD
9, 18985–19008, 2009Impacts of electronically photo-excited NO2
J. J. Ensberg et al.
Title Page
Abstract Introduction
Conclusions References
Tables Figures
◭ ◮
◭ ◮
Back Close
Full Screen / Esc
Printer-friendly Version
Interactive Discussion
Table 1.Reaction rates for photo-excited NO2reacting with H2O are presented. High and low reaction rates correspond to the reaction rates determined experimentally by Li et al. (2008) and Crowley and Carl (1997), respectively.
Simulated case Reaction rate (Reaction R7)
ACPD
9, 18985–19008, 2009Impacts of electronically photo-excited NO2
J. J. Ensberg et al.
Title Page
Abstract Introduction
Conclusions References
Tables Figures
◭ ◮
◭ ◮
Back Close
Full Screen / Esc
Printer-friendly Version
Interactive Discussion
Table 2. Statistical analysis of model performance by comparing measured ozone, NO, and NO2 concentrations to those predicted by the UCI-CIT Airshed Model with and without NO2 photo-excitation chemistry is presented. The low reaction rate case refers to utilizing the re-action rate found by Crowley and Carl (1997) for Rere-action (R2). The high rere-action rate case refers to utilizing the reaction rate found by Li et al. (2008) for Reaction (R2).
Base case Low reaction High reaction (%) rate case rate case
(%) (%)
Ozone
Normalized Gross Error 46.4 46.3 45.9
Normalized Bias −4.9 −3.8 1.9
Maximum Unpaired Peak Prediction 14.5 15.3 20.2 Total Unpaired Peak Prediction −145.0 −120.0 −8.4 NO
Normalized Gross Error 74.4 74.0 75.1
Normalized Bias 45.5 44.4 41.4
Maximum Unpaired Peak Prediction 127.9 128.1 128.1 Total Unpaired Peak Prediction 399.3 384.5 335.3 NO2
Normalized Gross Error 25.5 25.5 26.1
Normalized Bias −13.0 −12.9 −12.8
Maximum Unpaired Peak Prediction −2.0 −1.6 −0.8 Total Unpaired Peak Prediction −253.9 −250.0 −232.6
ACPD
9, 18985–19008, 2009Impacts of electronically photo-excited NO2
J. J. Ensberg et al.
Title Page
Abstract Introduction
Conclusions References
Tables Figures
◭ ◮
◭ ◮
Back Close
Full Screen / Esc
Printer-friendly Version
Interactive Discussion
280 320 360 400 440 480 520 560
UT M E as ting (km) 3680
3700 3720 3740 3760 3780 3800 3820
UT
M
N
o
rt
h
in
g
(k
m
)
C entral LA
R ivers ide
Irvine P omona
P AC IF IC OC E AN
ACPD
9, 18985–19008, 2009Impacts of electronically photo-excited NO2
J. J. Ensberg et al.
Title Page Abstract Introduction Conclusions References Tables Figures ◭ ◮ ◭ ◮ Back Close
Full Screen / Esc
Printer-friendly Version
Interactive Discussion
a d
c f
b e
Los Angeles, CA Los Angeles, CA
Pomona, CA Pomona, CA
Riverside, CA Low Reaction Rate CaseBase Case Riverside, CA High Reaction Rate Case
Measured Data
Base Case Low Reaction Rate Case High Reaction Rate Case Measured Data Base Case
Low Reaction Rate Case High Reaction Rate Case Measured Data
Base Case Low Reaction Rate Case High Reaction Rate Case Measured Data Base Case Low Reaction Rate Case High Reaction Rate Case Measured Data Base Case
Low Reaction Rate Case High Reaction Rate Case Measured Data
Simulated Hours Simulated Hours Simulated Hours
Simulated Hours
Simulated Hours Simulated Hours
12 24 36 48 0
12 24 36 48 0
12 24 36 48 0
12 24 36 48 0
12 24 36 48 0
12 24 36 48 0 0 50 100 150 200 250 300 0 50 100 150 200 250 300 0 20 40 60 80 100 120 0 50 100 150 200 250 0 20 40 60 80 100 120 140 160 180 0 20 40 60 80 100 120 140 160 180 N O [ppb ] N O [ppb ] N O [ppb ] O3 [ppb ] O3 [ppb ] O3 [ppb ]
Fig. 2. Simulated and measured NO and ozone concentrations in the South Coast Air Basin of California for 27–28 August 1987 is presented. All figures depict four cases which include 1-h average concentrations for the UCI-CIT base
case, 1-h average concentrations for a case with NO2photo-excitation chemistry utilizing the low reaction rate (Crowley
and Carl, 1997), 1-h average concentrations for a case with NO2photo-excitation chemistry utilizing the high reaction
rate (Li et al., 2008), and measured concentrations from the California Air Resources Board (ARB). The numerical
values of the high and low reaction rates are shown in Table 1. Subfigures shown correspond to(a)NO in Los Angeles,
(b)NO in Pomona,(c)NO in Riverside,(d)ozone in Los Angeles,(e)ozone in Pomona, and(f)ozone in Riverside. All
concentrations are in ppb.
ACPD
9, 18985–19008, 2009Impacts of electronically photo-excited NO2
J. J. Ensberg et al.
Title Page Abstract Introduction Conclusions References Tables Figures ◭ ◮ ◭ ◮ Back Close
Full Screen / Esc
Printer-friendly Version
Interactive Discussion
0 0.5 1 1.5 2
0 0.5 1 1.5 2
0 50 100 150 200 250
0 0.5 1 1.5 2
0 0.5 1 1.5 2
0 50 100 150 200 250
0 0.5 1 1.5 2
0 0.5 1 1.5 2
0 2 4 6 8 10
0 0.5 1 1.5 2
0 0.5 1 1.5 2
0 5 10 15 20
0 0.5 1 1.5 2
0 0.5 1 1.5 2
0 5 10 15 20
ppb ppb
ppb ppb ppb
a b c
d e f
Base Case Low Reaction Rate Case Minus Base Case High Reaction Rate Case Minus Base Case
Lo s A n g e le s, CA P o m o n a, CA
0 0.5 1 1.5 2
0 0.5 1 1.5 2
0 2 4 6 8 10
ppb
O
zone
O
zone
VOC Scaling Factor VOC Scaling Factor
VOC Scaling Factor
VOC Scaling Factor VOC Scaling Factor
VOC Scaling Factor
NO X S ca ling F a ct o r NO X S ca ling F a ct o r NO X S ca ling F a ct o r NO X S ca ling F a ct o r NO X S ca ling F a ct o r NO X S ca ling F a ct o r
Fig. 3. Impact of NO2photo-excitation chemistry on ozone and PM10concentrations in the South Coast Air Basin
of California for 28 August 1987:(a)Peak 1-h average ozone concentrations for base case in Los Angeles,(b)Peak
1-h average ozone concentrations for low reaction rate case minus those from base case in Los Angeles,(c)Peak 1-h
average ozone concentrations for high reaction rate case minus those from base case in Los Angeles(d)Peak 1-h
average ozone concentrations for base case in Pomona,(e)Peak 1-h average ozone concentrations for low reaction
rate case minus those from base case in Pomona,(f)Peak 1-h average ozone concentrations for high reaction rate
case minus those from base case in Pomona(g)Peak 1-h average ozone concentrations for base case in Riverside,
(h)Peak 1-h average ozone concentrations for low reaction rate case minus those from base case in Riverside,(i)Peak
1-h average ozone concentrations for high reaction rate case minus those from base case in Riverside,(j)24-h average
PM10concentrations for base case in Riverside,(k)24-h average PM10concentrations for low reaction rate case minus
those from base case in Riverside,(l)24-h average PM10concentrations for high reaction rate case minus those from
base case in Riverside. High and low reaction rates correspond to reaction rates of photo-excited NO2reacting with
H2O determined experimentally by Li et al. (2008) and Crowley and Carl (1997), respectively. See Table 1 for numerical
ACPD
9, 18985–19008, 2009Impacts of electronically photo-excited NO2
J. J. Ensberg et al.
Title Page Abstract Introduction Conclusions References Tables Figures ◭ ◮ ◭ ◮ Back Close
Full Screen / Esc
Printer-friendly Version
Interactive Discussion
0 0.5 1 1.5 2
0 0.5 1 1.5 2
0 50 100 150 200 250
0 0.5 1 1.5 2
0 0.5 1 1.5 2
100 120 160 200 220
0 0.5 1 1.5 2
0 0.5 1 1.5 2
0 0.5 1 1.5 2 2.5 3
0 0.5 1 1.5 2
0 0.5 1 1.5 2
0 5 10 15
ppb ppb ppb
µg/m3 µg/m3
g i
j k l
R iv ers id e, CA R iv ers id e, CA
0 0.5 1 1.5 2
0 0.5 1 1.5 2
0 2 4 6 8 10
h
0 0.5 1 1.5 2
0 0.5 1 1.5 2
0 5 10 15 20
180 140 µg/m3 Ozone P M1 0
VOC Scaling Factor VOC Scaling Factor
VOC Scaling Factor
VOC Scaling Factor VOC Scaling Factor
VOC Scaling Factor
NO X S ca lin g F a ct o r NO X S ca lin g F a ct o r NO X S ca lin g F a ct o r NO X S ca lin g F a ct o r NO X S ca lin g F a ct o r NO X S ca lin g F a ct o r
Fig. 3.Continued.