ACPD
11, 14607–14635, 2011Seasonal variation in vertical ambient BVOC concentrations
S. M. Noe et al.
Title Page
Abstract Introduction
Conclusions References
Tables Figures
◭ ◮
◭ ◮
Back Close
Full Screen / Esc
Printer-friendly Version Interactive Discussion
Discussion
P
a
per
|
Dis
cussion
P
a
per
|
Discussion
P
a
per
|
Discussio
n
P
a
per
|
Atmos. Chem. Phys. Discuss., 11, 14607–14635, 2011 www.atmos-chem-phys-discuss.net/11/14607/2011/ doi:10.5194/acpd-11-14607-2011
© Author(s) 2011. CC Attribution 3.0 License.
Atmospheric Chemistry and Physics Discussions
This discussion paper is/has been under review for the journal Atmospheric Chemistry and Physics (ACP). Please refer to the corresponding final paper in ACP if available.
Seasonal variation in vertical volatile
compounds air concentrations within
a remote hemiboreal mixed forest
S. M. Noe, K. H ¨uve, ¨U. Niinemets, and L. Copolovici
Department of Plant Physiology, Institute of Agricultural and Environmental Sciences, Estonian University of Life Sciences, Kreutzwaldi 1, 51014 Tartu, Estonia
Received: 21 December 2010 – Accepted: 26 April 2011 – Published: 12 May 2011
Correspondence to: S. M. Noe ([email protected])
ACPD
11, 14607–14635, 2011Seasonal variation in vertical ambient BVOC concentrations
S. M. Noe et al.
Title Page
Abstract Introduction
Conclusions References
Tables Figures
◭ ◮
◭ ◮
Back Close
Full Screen / Esc
Printer-friendly Version Interactive Discussion
Discussion
P
a
per
|
Dis
cussion
P
a
per
|
Discussion
P
a
per
|
Discussio
n
P
a
per
|
Abstract
The vertical distribution of ambient biogenic volatile organic compounds (BVOC) con-centrations within a hemiboreal forest canopy was investigated over a period of one year. Variability in temporal and spatial isoprene concentrations can be mainly ex-plained by biogenic emissions from deciduous trees, ranging from 0.1 to 7.5 µg m−3.
5
Monoterpene concentrations exceeded isoprene largely and ranged from 0.01 to 140 µg m−3 and during winter time anthropogenic contributions are likely. Variation in monoterpene concentrations found to be largest right above the ground and the verti-cal profile suggest a weak mixing leading to terpene accumulation in the lower canopy. Exceptionally high values were recorded during a heat wave in July 2010 with very
10
high midday temperatures above 30◦C for several weeks. During summer months,
monoterpene exceeded isoprene concentrations 6-fold and during winter 12-fold. The relative contribution of diverse monoterpene species to the ambient concentrations re-vealed a dominance ofα-pinene in the lower and of limonene in the upper part of the canopy, both accounting for up to 70 % of the total monoterpene concentration during
15
summer months. The main contributing monoterpene during wintertime was∆3-carene accounting for 60 % of total monoterpene concentration in January. Possible biogenic monoterpene sources beside the foliage are the leaf litter, the soil and also resins ex-uding from stems. In comparison, the hemiboreal mixed forest canopy showed similar isoprene but higher monoterpene concentrations than the boreal forest and lower
iso-20
ACPD
11, 14607–14635, 2011Seasonal variation in vertical ambient BVOC concentrations
S. M. Noe et al.
Title Page
Abstract Introduction
Conclusions References
Tables Figures
◭ ◮
◭ ◮
Back Close
Full Screen / Esc
Printer-friendly Version Interactive Discussion
Discussion
P
a
per
|
Dis
cussion
P
a
per
|
Discussion
P
a
per
|
Discussio
n
P
a
per
|
1 Introduction
Emissions of biogenic hydrocarbons from forest ecosystems are a dominant source of reduced organic gases to the atmosphere. They even exceed emissions of hydro-carbons by anthropogenic pollution and biomass burning. Biogenic emissions play important roles in determining the global, regional, and local atmospheric chemistry
5
which, in turn, feeds back to the ecosystem (Arneth et al., 2010; Kulmala et al., 2004). Losses of instantaneously emitted hydrocarbons such as terpenes due to oxida-tion processes throughout the canopy height have been reported by several studies (Holzinger et al., 2005; Fuentes et al., 2007; Stroud et al., 2005). Especially if the canopy height and structure together with atmospheric turbulence is such that the
resi-10
dence time of air parcels within the canopy are comparable or greater than the lifetimes of BVOCs, chemical losses and deposition within the canopy lead to reduced total sur-face emissions (Fuentes et al., 2007; Karl et al., 2004; Strong et al., 2004). Effects of ozone, nitrogen oxides (NOx) and hydroxyl radical (OH) on the vertical distribution
of BVOCs or vice-versa have been also assessed by means of 1-D canopy
chem-15
istry models including atmospheric transport terms (Forkel et al., 2006; Fuentes et al., 2007; Karl et al., 2004; Stroud et al., 2005; Strong et al., 2004). These studies mostly conclude that the discrepancy between upscaled leaf level BVOC emission fluxes and canopy scale flux measurements are due to the within canopy chemistry that lead to a reduction in total surface BVOC emission to the boundary layer. Monoterpene
up-20
take by leaves of deciduous tree species under high ambient concentrations occurs and leads to altered temporal behavior of total monoterpene fluxes. Such processes have been described by Copolovici et al. (2005) and Noe et al. (2008).
Seasonal variations in isoprene and monoterpene emissions have been widely re-ported for a large variety of ecosystems and tree species (Holzinger et al., 2006; Hakola
25
ACPD
11, 14607–14635, 2011Seasonal variation in vertical ambient BVOC concentrations
S. M. Noe et al.
Title Page
Abstract Introduction
Conclusions References
Tables Figures
◭ ◮
◭ ◮
Back Close
Full Screen / Esc
Printer-friendly Version Interactive Discussion
Discussion
P
a
per
|
Dis
cussion
P
a
per
|
Discussion
P
a
per
|
Discussio
n
P
a
per
|
and α-pinene is commonly used as a proxy to represent all monoterpenes. This is in contrast to the finding that monoterpenes have quite different atmospheric lifetimes (Atkinson et al., 1990; Atkinson, 2000; Lyubovtseva et al., 2005) suggesting differences in their chemical degradation and impact on subsequent processes such as secondary organic aerosol (SOA) formation (Ng et al., 2008; Kanakidou et al., 2005; Spracklen
5
et al., 2008).
Forest trees are exposed to a huge amount of biotic and abiotic stresses and en-vironmental factors that lead to very heterogenous emission patterns of biogenic hy-drocarbons (Niinemets, 2010a). Inclusion of process-based approaches, addressing such factors on larger scale emission fluxes of biogenic hydrocarbons have been
re-10
viewed recently (Niinemets et al., 2010b; Arneth et al., 2008; Arneth and Niinemets, 2010; Niinemets, 2010b). The findings of Stroud et al. (2005) and Karl et al. (2004) al-ready led to an empirical term for the escape efficiency of biogenic hydrocarbons from forest canopies into the boundary layer. That escape efficiency has been included to the MEGAN framework (Guenther et al., 2006) to allow to scale biogenic hydrocarbon
15
emissions to regional or global levels.
Estonia is located at the transition zone between the boreal and temperate biomes which characterizes the location of hemiboreal, mostly mixed, forests. Nilsson (1997) estimates the width of that transition zone over Eurasia to span at least over 600 km (Sweden) and even wider in Siberia (Russia). Given predictions on species diversity
20
and their change under future climate in Scandinavia (Sætersdal et al., 1998) and the likely climatic impact on northern ecosystems (Intergovernmental Panel on Cli-mate Change, 2007), it seems likely that the hemiboreal transition zone will move and enlarge to north. Until now only few studies have been pointed to the atmosphere-biosphere relations within that zone. The aim of our study was to give (1) an overview
25
ACPD
11, 14607–14635, 2011Seasonal variation in vertical ambient BVOC concentrations
S. M. Noe et al.
Title Page
Abstract Introduction
Conclusions References
Tables Figures
◭ ◮
◭ ◮
Back Close
Full Screen / Esc
Printer-friendly Version Interactive Discussion
Discussion
P
a
per
|
Dis
cussion
P
a
per
|
Discussion
P
a
per
|
Discussio
n
P
a
per
|
2 Materials and methods
2.1 Site description
The vertical VOC profiles were measured at a 20 m high tower located in the J ¨arvselja Experimental Forest in southeast Estonia (58◦25′N, 27◦46′E). The site is situated in the hemiboreal forest zone with a moderately cool and moist climate and is described in
5
more detail by Noe et al. (2010). It is characterized as a remote site. These transition zones spreading between the boreal and temperate climate zones are populated by conifer dominated mixed forests.
The measurement site is dominated by Norway spruce (Picea abies(L.) Karst.) and as co-dominant species Silver Birch (Betula pendula Roth.) and Black Alder (Alnus
10
glutinosa L.) in the upper canopy layer varying between 16–20 m. The presence of a suppressed tree layer with a mean height between 6–7 m is of particularly importance as it affects turbulent air flows within the stand. The soil is covered by a dense and rather species rich layer of ground vegetation and a moss layer that consists of several species. The site has a lowland character and is influenced by a high groundwater
15
table and water logging due to the vicinity of Lake Peipsi. Especially in humid spots we foundSphagnumspecies which are typical for peat bogs.
The mean annual temperature varies between 4–6◦C and the annual precipitation
between 500–750 mm, about 40–80 mm of the annual precipitation is snow. The length of the growing season (daily air temperature above 5◦C) averages between 170–
20
180 days.
2.2 VOC sampling
We conducted the sampling of VOC from ambient air on 6 heights (0, 4, 8, 12, 16, and 20 m above ground) over a year starting in October 2009 until September 2010 (Table 1). The days of sampling have been chosen such that we obtained samples in
25
ACPD
11, 14607–14635, 2011Seasonal variation in vertical ambient BVOC concentrations
S. M. Noe et al.
Title Page
Abstract Introduction
Conclusions References
Tables Figures
◭ ◮
◭ ◮
Back Close
Full Screen / Esc
Printer-friendly Version Interactive Discussion
Discussion
P
a
per
|
Dis
cussion
P
a
per
|
Discussion
P
a
per
|
Discussio
n
P
a
per
|
The samples were directly drawn into multibed stainless steel cartridges (10.5 cm length, 3 mm inner diameter, Supelco, Bellefonte, PA, USA) filled with Carbotrap C 20/40 mesh (0.2 g), Carbopack C 40/60 mesh (0.1 g) and Carbotrap X 20/40 mesh (0.1 g) adsorbents (Supelco). We did not remove the ozone from the sample air stream as that would be a change in the chemical composition of air during the sampling.
5
Further more it was shown that the adsorbent material used has 100 % recovery for BVOC (Calogirou et al., 1996; Ciccioli et al., 1984).
We used a total of three constant flow air sample pumps (1003-SKC, SKC Inc., Hus-ton, TX, USA) and one multi-sample constant flow air sample pump (224-PCXR8, SKC Inc., Huston, TX, USA) that allows to draw four samples at the same time. With this
10
setup we were able to sample a total of at least three repetitions on each height within a time frame of 2–2.5 h around midday local winter time (UTC+2). Each sampling took 30 min with a flow of 200 ml min−1 which concentrated a total of 6 l of ambient air on the adsorbent. The samples were stored and cooled (+5◦C) until analysis which took
place within 4 to 6 h after sampling.
15
2.3 Resin sampling
For comparison with the volatile components found in the air space around tree trunks we took three samples of spruce resin from the stems of the trees surrounding the tower. The samples were taken at about 1 m heights on the stem of spruce trees at places that were exuding resin. The resin was picked using a small spruce stick and
20
transferred into 8 ml glass vials for transport and subsequent analysis. 2.4 VOC analysis
Adsorbent cartridges were analyzed with a combined Shimadzu TD20 automated car-tridge desorber and Shimadzu 2010 Plus GC-MS instrument (Shimadzu Corporation, Kyoto, Japan) described previously (Copolovici et al., 2009; Toome et al., 2010).
ACPD
11, 14607–14635, 2011Seasonal variation in vertical ambient BVOC concentrations
S. M. Noe et al.
Title Page
Abstract Introduction
Conclusions References
Tables Figures
◭ ◮
◭ ◮
Back Close
Full Screen / Esc
Printer-friendly Version Interactive Discussion
Discussion
P
a
per
|
Dis
cussion
P
a
per
|
Discussion
P
a
per
|
Discussio
n
P
a
per
|
For the analysis of the resin samples, 0.2 g resin are dissolved in 2 ml hexane and extracted over 24 h at 4◦C. The preparations were shaken at 4◦C for 30 min and then
centrifuged at 10 000 g for 5 min. The supernatant was then filtered through two layers of no. 1 filter paper (Whatman, Kent, UK). Determination of the monoterpenes of the resin was achieved by GC-MS (Shimadzu 2010 Plus GC-MS, Shimadzu Corporation,
5
Kyoto, Japan) and equipped with a Shimadzu AOC20 autoinjector/autosampler. Separation of different compounds was achieved in a ZB-5MS capillary column (30 m, 0.25 mm i.d., 0.25 µm film thickness, Zebron, Phenomenex, Torrance, CA, USA). Injector temperature was set at 215◦C. Initial oven temperature was set at 40◦C, held for 1 min; ramped at 5◦C min−1up to 200◦C, held for 1 min; ramped at 10◦C min−1up to
10
220◦C and held for 5 min. Helium (purity 99.9999 %, Elmer Messer Gaas AS, Tallinn,
Estonia) was employed as carrier gas with a constant flow of 0.74 ml min−1. The mass spectrometer was operated in electron-impact mode (EI) at 70 eV, in the scan range
m/z 30–400, the transfer line temperature was set at 240◦C and ion-source
temper-ature at 150◦C. Compounds were identified by use of the NIST spectral library and
15
based on retention time identity with the authentic standard (GC purity, Sigma-Aldrich, St. Louis, MO, USA). The absolute concentrations of isoprene, monoterpenes and LOX products were calculated based on an external authentic standard consisting of known amount of VOCs.
2.5 Auxiliary measurements
20
Beside the main task of assessing vertical VOC profiles throughout the canopy and over the seasons, we measured, predominantly under summer conditions, also ambi-ent temperature, light and CO2profiles throughout the canopy.
Temperature measurements have been conducted using a thermocouple sensor that was connected to a thermocouple reader (Comark KM330, Comark Instruments,
25
ACPD
11, 14607–14635, 2011Seasonal variation in vertical ambient BVOC concentrations
S. M. Noe et al.
Title Page
Abstract Introduction
Conclusions References
Tables Figures
◭ ◮
◭ ◮
Back Close
Full Screen / Esc
Printer-friendly Version Interactive Discussion
Discussion
P
a
per
|
Dis
cussion
P
a
per
|
Discussion
P
a
per
|
Discussio
n
P
a
per
|
Quantum flux density (PPFD) was measured with a LI-190SA quantum sensor (LiCor, Lincoln, NE, USA). On each height, PPFD was measured in shade conditions and in full sunlight, if available. At least 5 measurements were taken at different loca-tions near the sampling pump and the data averaged.
To assess the ambient CO2 mixing ratios throughout the canopy, a closed path
in-5
frared gas analyzer (IRGA) (LI-7000, Li-Cor, Lincoln, NE, USA) was used. Sample air was drawn from each height by Teflon pipes passing a filter (Acro50, Gelman, Ann Ar-bor, MI, USA) and the IRGA. An air flow of 10 l min−1was provided by a vacuum pump (Samos SB 0080 D, Busch Vakuumteknik Oy, Vantaa, Finland).
Horizontal wind speed was measured with two 3-D sonic anemometers (CSAT3,
10
Campbell Scientific, 168 Logan, UT, USA; Metek USA-1, Metek GmbH, Elmshorn, Ger-many) which have been installed on top of the tower at a height of 20 m above ground and on a mast at a height of 2 m above forest floor for continuous eddy covariance measurements at the site.
3 Results
15
3.1 Environmental factors
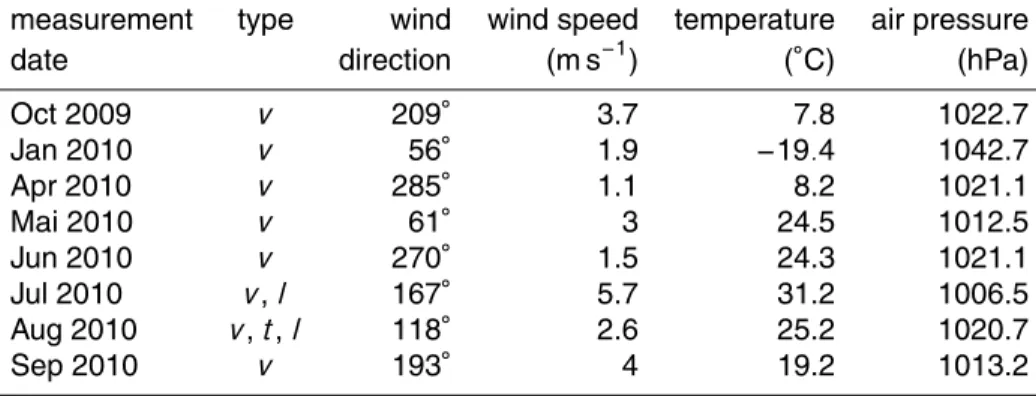
Terpene concentrations in ambient air rely on the emissions from plants as sources and on the chemical composition and oxidative state of the atmosphere determining the sink defined by chemical reactions. Figure 1 shows an example during summer of key environmental drivers that affect both, the source and the sink of terpenes in
20
the atmosphere. The temperature showed a typical pattern for the mid of a clear and sunny day with higher temperatures on top of the canopy and lower ones within the forest. An interesting effect was the outcome, that the variation within that parameter is larger on top of the canopy and directly above the forest floor. The light gradient showed the expected picture that the highest radiative input into the system is at the
25
ACPD
11, 14607–14635, 2011Seasonal variation in vertical ambient BVOC concentrations
S. M. Noe et al.
Title Page
Abstract Introduction
Conclusions References
Tables Figures
◭ ◮
◭ ◮
Back Close
Full Screen / Esc
Printer-friendly Version Interactive Discussion
Discussion
P
a
per
|
Dis
cussion
P
a
per
|
Discussion
P
a
per
|
Discussio
n
P
a
per
|
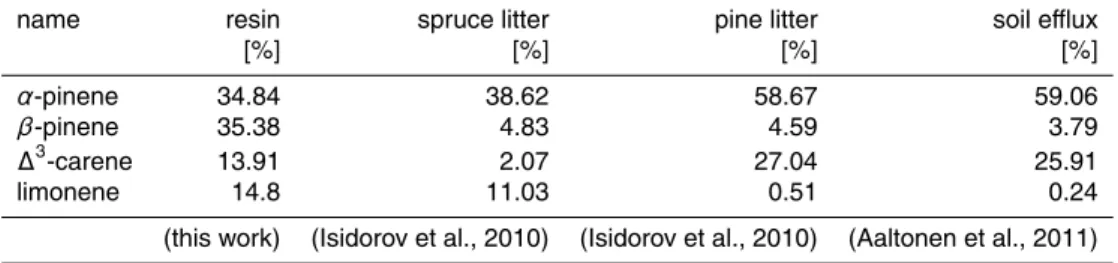
within the canopy. Below 8 m height PPFD remain below 100 µmol m−2s−1. Between 12 m to 16 m we found the largest variation of the radiative energy while at the top of the canopy the variation is again small. The carbon dioxide (CO2) gradient with concentrations at lower levels increasing well above ambient air concentrations is an indicator for reduced mixing of air during summer months, as is indicated also by the
5
variation in horizontal wind speed (Fig. 2) 3.2 BVOC overview
We found a variety of reactive VOC species in the ambient air measured throughout the canopy. The monoterpenes α-pinene, ∆3-carene, and limonene dominated the ambient concentrations (Figs. 3 and 5) and furtherβ-pinene, camphene andα-thujene
10
were detected. From the shorter chained hydrocarbons, isoprene was detected as well as 1-hexanol and (Z)-3-hexenol. The latter both are likely originated from the plants lipoxygenase (LOX) pathway and typically indicate plant responses to environmental stress factors. During the warm summer months, the trees are likely to face several stresses such as heat, drought and high light (Niinemets, 2010a; Turtola et al., 2003).
15
During June, July and August 2010 we also detected the sesquiterpenesγ-muurolene,
α-longifolene, β-caryophyllene, copaene,α-cedrene, and (E,E)-α-farnesene in ambi-ent air with their highest abundance in the upper canopy.
3.3 Seasonal and spatial variation
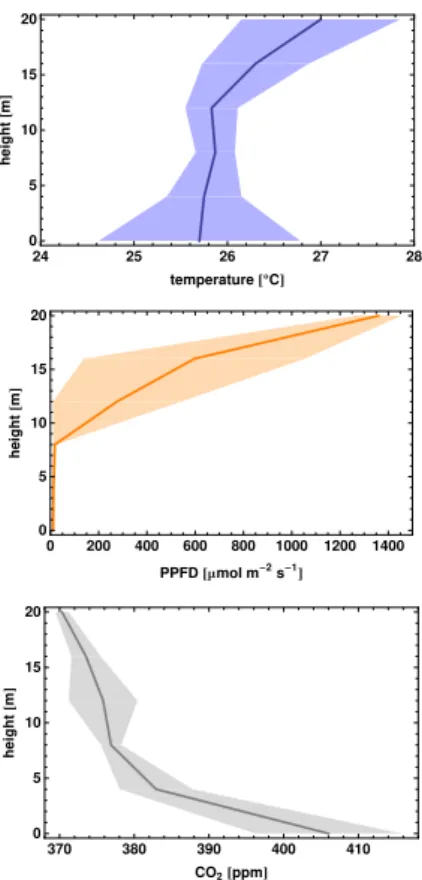
Isoprene and monoterpenes showed a large variability over the whole year (Fig. 3,
Sup-20
plement Table S1 and S2). The mean values of isoprene varied between 0.1 µg m−3 and 7.5 µg m−3 with lowest values in April 2010 and highest in July 2010. Mean val-ues of the LOX pathway compounds varied substantially between 0.03 µg m−3 and
3.4 µg m−3 with highest values exclusively in July 2010 and on the topmost level of the canopy. The mean values of monoterpenes showed the largest variability
span-25
ACPD
11, 14607–14635, 2011Seasonal variation in vertical ambient BVOC concentrations
S. M. Noe et al.
Title Page
Abstract Introduction
Conclusions References
Tables Figures
◭ ◮
◭ ◮
Back Close
Full Screen / Esc
Printer-friendly Version Interactive Discussion
Discussion
P
a
per
|
Dis
cussion
P
a
per
|
Discussion
P
a
per
|
Discussio
n
P
a
per
|
100 µg m−3. Highest values were found in July 2010 under exceptionally hot condi-tions (Table 1 and Fig. 3) reaching 140 µg m−3.
The vertical profiles of isoprene and monoterpenes are presented in the Figs. 3 and 4. For isoprene, we can clearly distinct between the summer months (June to August) and the rest of the year. Comparing the height profile for each month, there was no
5
clear pattern visible over the year (Fig. 3). While in June the highest concentrations was found on the topmost level of the canopy , the profile has changed considerably in August with higher concentrations found inside the canopy. In the case of total monoter-pene concentrations, the situation is different. Excluding the exceptionally hot periods, the monoterpenes showed higher concentrations at 0 m and 4 m height over the whole
10
year. Only during July 2010, when a long and exceptional hot period had occurred, the ambient monoterpene concentrations were dramatically increased at 16 m and 20 m height. The same, but much less prominent pattern was seen in August 2010, when the concentrations of monoterpenes were slightly larger on 20 m height than below (Fig. 3).
15
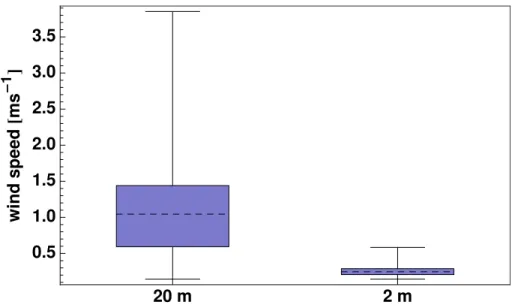
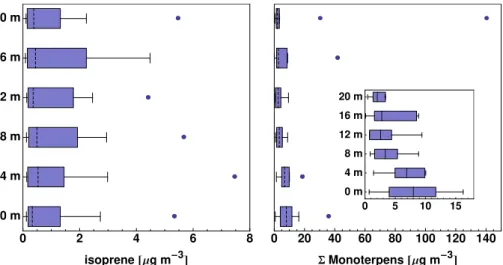
3.4 Whole year canopy profile
A more general pattern was obtained by combing the measurements per height over the whole year. Figure 4 shows the variation of isoprene and total monoterpene con-centrations profiles found. Isoprene median concon-centrations were found to range be-tween 0.33 µg m−3 and 0.56 µg m−3. The outliers were caused by the measurements
20
in July 2010 and the largest variation was found at 16 m height where the dynamics of the environmental drivers was largest. The monoterpene concentrations were found maximal in the forest understory between soil level and a height of 4 m. Here as well, the outliers came from the measurements in July under high temperatures. The me-dian monoterpene concentrations decreased from 8 µg m−3at 0 m to 2 µg m−3at 20 m
25
ACPD
11, 14607–14635, 2011Seasonal variation in vertical ambient BVOC concentrations
S. M. Noe et al.
Title Page
Abstract Introduction
Conclusions References
Tables Figures
◭ ◮
◭ ◮
Back Close
Full Screen / Esc
Printer-friendly Version Interactive Discussion
Discussion
P
a
per
|
Dis
cussion
P
a
per
|
Discussion
P
a
per
|
Discussio
n
P
a
per
|
3.5 Relative contribution by monoterpene species
To assess changes in the contribution of several monoterpene species emitted we nor-malized the total monoterpene concentration to one and expressed each monoterpene by its relative contribution (Fig. 5). These relative contributions showed as well a gra-dient over the canopy. While near to the forest floor,α-pinene was the most abundant
5
species, we found limonene dominating on top of the canopy for most times of the year. ∆3-carene showed the smallest fractional contribution to the total monoterpene concentrations at 0 m for the most times measured and its contribution was growing to top of of the canopy. Overall, the heterogeneity and variability was larger at the top of the canopy than at the forest floor.
10
4 Discussions
In general, the values we present here fit into the picture of the reported ambient iso-prene and monoterpene concentrations. Such ambient concentrations range from 2 to 5 µg m−3 for isoprene and and 10 to 18 µg m−3 for monoterpenes in boreal forest ecosystems (Hakola et al., 2000; Rinne et al., 2000; R ¨ais ¨anen et al., 2009). Further
15
ambient terpene concentrations were reported for Greece (Harrison et al., 2001), the Amazon (Rinne et al., 2002), Duke Forest and Oak Ridge in USA (Stroud et al., 2005; Fuentes et al., 2007), where Oak Ridge employed the highest isoprene mixing ratios among the sites noted here.
During spring and summer, our measurements resulted in isoprene values that
20
ranged from 1 to 7 µg m−3 and the monoterpene concentrations varied in the same time between 10 and 40 µg m−3if the extreme values measured in July 2010 were
ex-cluded. Given reported maximal values for boreal forests (R ¨ais ¨anen et al., 2008, 2009; Eerdekens et al., 2009) the numbers reported here are slightly higher. Hakola et al. (2009) reported as well yearly and monthly averages of monoterpene concentrations
25
ACPD
11, 14607–14635, 2011Seasonal variation in vertical ambient BVOC concentrations
S. M. Noe et al.
Title Page
Abstract Introduction
Conclusions References
Tables Figures
◭ ◮
◭ ◮
Back Close
Full Screen / Esc
Printer-friendly Version Interactive Discussion
Discussion
P
a
per
|
Dis
cussion
P
a
per
|
Discussion
P
a
per
|
Discussio
n
P
a
per
|
Overall the hemiboreal forest ecosystem employ slightly larger ambient monoterpene concentrations than the boreal forest and clearly larger than temperate forests where less monoterpene emitting species are present. For isoprene, the hemiboreal forest show slightly larger ambient concentrations than the boreal forest but is clearly below the temperate forest concentrations.
5
4.1 Seasonal variation of the ambient terpene concentrations
The seasonal variation in isoprene and monoterpene concentrations is, as expected, rather big. Wintertime values reflect the lowest and the summertime values the highest biogenic activity. Our measurements support the idea that throughout the year the relative contribution of different biogenic sources to ambient terpene concentrations is
10
changing substantially.
The concentrations for isoprene in winter, spring and autumn remained quite sim-ilar even though, the temperatures, state of the surface (snow cover in winter, flood in spring) and the physiological conditions of contributing tree species changed sub-stantially during those periods. The deciduous trees lost their leaves and also reached
15
bud burst and developed new foliage causing changes in the light and temperature en-vironment within the forest canopy. However, such dramatic enen-vironmental changes, impacting on the biogenic sources and the chemical sinks, did not lead to substantial changes in ambient isoprene concentrations during the most time of the year. Interest-ingly, the isoprene concentrations during January were larger than in October and April.
20
That might be due to a low chemical sink and possible anthropogenic influences, that have been reported (Reimann et al., 2000). Such anthropogenic sources are mainly the combustion and evaporation of fossil fuels as well as biomass burning (Reimann et al., 2000; Theloke and Friedrich, 2007; Cai and Xie, 2009).
In contrast, the summer months (June, July and August) showed a very large
hetero-25
ACPD
11, 14607–14635, 2011Seasonal variation in vertical ambient BVOC concentrations
S. M. Noe et al.
Title Page
Abstract Introduction
Conclusions References
Tables Figures
◭ ◮
◭ ◮
Back Close
Full Screen / Esc
Printer-friendly Version Interactive Discussion
Discussion
P
a
per
|
Dis
cussion
P
a
per
|
Discussion
P
a
per
|
Discussio
n
P
a
per
|
and suggests that the activity of the biogenic sources is largely increased throughout the canopy and follows basically an asymmetric seasonal variation (Niinemets et al., 2010a).
The ambient monoterpene concentrations followed as well the asymmetric seasonal pattern and employed the highest concentrations during summer. However, that
pat-5
tern was not consistent over the spatial distribution within the canopy and will be dis-cussed below. Monoterpenes dominated the terpene trace gas concentrations in the forest air over the whole year. When calculating the mean isoprene and monoterpene concentrations during the summer months, monoterpene concentration exceeded the isoprene concentration 6-fold. During winter, spring and autumn, the monoterpene
10
concentration dominated even more and exceeded the isoprene concentration 12-fold. Given the tree species distribution at the measurement site (Noe et al., 2010), the loss of the leaves from the fraction of deciduous trees and, by that a change in sources of both, monoterpenes and isoprene, led to a change of the ambient terpene compo-sition. While the monoterpene concentration remained dominated by biogenic sources
15
there might be anthropogenic contributions to isoprene during winter time. We can not proof that with our data and that was not the intention to do so but investigating the source location is a future task to better understand the role of the annual changes of the hemiboreal ecosystems and their impact on the atmospheric state and feedbacks thereof.
20
4.2 Vertical variation through the canopy
Light availability discriminates the most the activity of the biogenic sources and the chemical sinks within the forest canopy. Up to today, information on vertical variation of BVOC is scarce (Fuentes et al., 2007; Eerdekens et al., 2009). Recent studies showed (Noe et al., 2010; Fuentes et al., 2007; Eerdekens et al., 2009) that reactive trace
25
ACPD
11, 14607–14635, 2011Seasonal variation in vertical ambient BVOC concentrations
S. M. Noe et al.
Title Page
Abstract Introduction
Conclusions References
Tables Figures
◭ ◮
◭ ◮
Back Close
Full Screen / Esc
Printer-friendly Version Interactive Discussion
Discussion
P
a
per
|
Dis
cussion
P
a
per
|
Discussion
P
a
per
|
Discussio
n
P
a
per
|
sink when there is no or low light. While our measured isoprene concentration did not change very much, the total monoterpene concentration was increased by a factor of two or three, depending on the height in the canopy. This indicates, that the change in the oxidative state due to lack of light may influence substantially the accumulation of monoterpenes within the canopy.
5
Another factor that may impact, at least during the summer months, is the rather dense canopy that leads to a weak mixing of the lower forest air layers (Fig. 2). Beside trees, also the soil is a source of monoterpenes and high concentrations have been re-ported for soil underPinus sylvestrisL.,Betula pendulaL. andPicea abiesL. (Isidorov et al., 2010; Aaltonen et al., 2011). Soil airspace concentrations have been reported
10
to be about a factor of 1000 larger than in ambient air (Smolander et al., 2006) and a contribution of monoterpenes emitted from soil to the concentration in forest air is a likely process.
The general pattern of the vertical terpene concentration is seen by the yearly me-dian values. Isoprene concentrations remained almost constant over the canopy height
15
and employed the largest variations at 16 m height. There is the main part of photo-synthesizing foliage located and the highest source activity. At 20 m in full sunlight, the chemical sink and the mixing is stronger and thus the possible isoprene concentrations are smaller.
The median monoterpene concentration tends to be highest at the forest floor until
20
4 m height and then decreases by a factor of four until the top of the canopy. Largest variations were found at the forest floor and at 16 m height. This can be seen as an indication that soil and litter is an important monoterpene source near the forest floor and the biogenic source is strongest at 16 m where the largest amount of leaves are located in summer. At 20 m, again the stronger oxidation processes and mixing should
25
ACPD
11, 14607–14635, 2011Seasonal variation in vertical ambient BVOC concentrations
S. M. Noe et al.
Title Page
Abstract Introduction
Conclusions References
Tables Figures
◭ ◮
◭ ◮
Back Close
Full Screen / Esc
Printer-friendly Version Interactive Discussion
Discussion
P
a
per
|
Dis
cussion
P
a
per
|
Discussion
P
a
per
|
Discussio
n
P
a
per
|
4.3 Temporal and spatial variation in the relative monoterpene contribution
The main contributing monoterpenes changed over time and space within the forest canopy. The dominant compound in the lower canopy wasα-pinene while on the top of the canopy limonene took that role. An exception to that pattern was the∆3-carene contribution which was dominant in January on all heights. A possible explanation is
5
the logging activity which took place in winter. We know that∆3-carene is the main compound emitted fromP. abies(Noe et al., 2010) at our site and it shared up to 14 % of the spruce resin monoterpene content. Because of that,∆3-carene emissions from freshly cut and stored logs in the surrounding are a likely source.
Taking the lifetime and reaction rate constants ofα-pinene and limonene into account
10
(Atkinson, 2000), the temporal and spatial relative contribution pattern give some in-dications on the change in the activity in the biogenic sources. Above the canopy the chemical loss of limonene should be larger than forα-pinene. As it was found to be the most abundant monoterpene in ambient air at 20 m, there has to be a large source activity. One explanation during the summer months might be an increased limonene
15
emission flux under heat stress as reported forPinus sylvestris andPicea abies (Tur-tola et al., 2003). However, a recent study did not reveal the same pattern in leaf level monoterpene fluxes during summer (Noe et al., 2010). That indicates that a simple link between leaf level fluxes and ambient concentrations in a system with multiple influencing factors might hold only temporarily.
20
The monoterpene concentrations inside the forest, especially near the forest floor, showed a clear contribution pattern. This pattern was present even in early spring with snow cover and flooding after the snow melted away. Comparing the measurement of the monoterpene contribution in ambient air to soil and litter fluxes (Fig. 5 and Table 2) the fractions we found forα-pinene and limonene resemble most closely the soil efflux
25
ACPD
11, 14607–14635, 2011Seasonal variation in vertical ambient BVOC concentrations
S. M. Noe et al.
Title Page
Abstract Introduction
Conclusions References
Tables Figures
◭ ◮
◭ ◮
Back Close
Full Screen / Esc
Printer-friendly Version Interactive Discussion
Discussion
P
a
per
|
Dis
cussion
P
a
per
|
Discussion
P
a
per
|
Discussio
n
P
a
per
|
Yet, monoterpene contributions from soil or litter are scarcely investigated. Possi-ble sources are soil microbes (Ramirez et al., 2010) and the litter (Gray et al., 2010; Isidorov et al., 2010). Hayward et al. (2001) reported also differences in VOC fluxes according to the depth of the soil. However, the comparison with litter and soil flux samples (Table 2) suggests that there is a large variability in litter and soil
monoter-5
pene fluxes. In our case, the spruce resin is one potential source contributing to the ambient concentrations measured from early spring to autumn. As resin is located within the litter and the trunks, there is a substantial spatial cover within the forest canopy for such monoterpene contributions to the ambient concentration.
5 Conclusions
10
We found clear seasonal and spatial pattern of isoprene and monoterpene ambient concentrations within the forest canopy. While the variation in the isoprene concen-tration can mainly be explained by the biogenic emission from deciduous trees, the monoterpene concentrations showed the largest values and variations above the for-est floor.
15
During summertime, very large stress related emissions from the biogenic sources led to large ambient concentrations despite of the also high oxidation sink for terpenes. Especially monoterpene concentrations were the dominant terpenes in forest canopy air.
The relative contribution of monoterpenes let us propose several possible sources
20
within the canopy. The main sources during the growing season are the foliage and un-der high temperature the stress related emissions can temporarily dominate the source capacity. The forest floor (soil and litter) is a strong source, especially for α-pinene throughout the year and resins may contribute as well in that temporal range. The measurement in January was dominated by ∆3-carene and anthropogenic sources
25
ACPD
11, 14607–14635, 2011Seasonal variation in vertical ambient BVOC concentrations
S. M. Noe et al.
Title Page
Abstract Introduction
Conclusions References
Tables Figures
◭ ◮
◭ ◮
Back Close
Full Screen / Esc
Printer-friendly Version Interactive Discussion
Discussion
P
a
per
|
Dis
cussion
P
a
per
|
Discussion
P
a
per
|
Discussio
n
P
a
per
|
We can conclude that the lower canopy is weakly mixed and rather stable during spring and summer leading to at least two clearly distinct layers within the canopy. Oxidative degradation processes inside the canopy may play a more prominent role during that time. In autumn and winter the patterns resemble more to the situation of the boreal forest with coniferous trees as main contributors of biogenic hydrocarbons
5
and a rather open canopy structure allowing stronger mixing.
Predictions of BVOC fluxes by means of vegetation maps that grade the hemiboreal area as temperate mixed forests are likely to overestimate the isoprene and underesti-mate the monoterpene fluxes to the boundary layer.
Supplementary material related to this article is available online at:
10
http://www.atmos-chem-phys-discuss.net/11/14607/2011/ acpd-11-14607-2011-supplement.pdf.
Acknowledgements. We thank Pille Randj ¨arv and Lea Noe for their help collecting the sam-ples during the measurement campaigns. We further thank Beate Noe for her help in an-alyzing the chromatograms. We thank Hermanni Aaltonen for his comments on forest floor
15
monoterpene emissions from boreal soils given at the 2nd Nordic-Baltic BACCI VOC Work-shop (11–12 October 2010, Puurmani, Estonia). Financial support by the Estonian Science Foundation (Grants 7645, 8110, JD101) and the Estonian Ministry of Education and Science (Grant SF1090065s07) are gratefully acknowledged.
References
20
Aaltonen, H., Pumpanen, J., Pihlatie, M., Hakola, H., Hell `en, H., Kulmala, L., Vesala, T., and B ¨ack, J.: Boreal pine forest floor biogenic volatile organic compound emissions peak in early summer and autumn, Agr. Forest Meteorol., 151, 682–691, 2011. 14620, 14621, 14630
Arneth, A. and Niinemets, ¨U.: Induced BVOCs: how to bug our models?, Trends Plant Sci., 15,
118–125, 2010. 14610
25
ACPD
11, 14607–14635, 2011Seasonal variation in vertical ambient BVOC concentrations
S. M. Noe et al.
Title Page
Abstract Introduction
Conclusions References
Tables Figures
◭ ◮
◭ ◮
Back Close
Full Screen / Esc
Printer-friendly Version Interactive Discussion
Discussion
P
a
per
|
Dis
cussion
P
a
per
|
Discussion
P
a
per
|
Discussio
n
P
a
per
|
of global terrestrial isoprene emissions so similar (and why is this not so for monoterpenes)?, Atmos. Chem. Phys., 8, 4605–4620, doi:10.5194/acp-8-4605-2008, 2008. 14610
Arneth, A., Harrison, S. P., Zaehle, S., Tsigaridis, K., Menon, S., Bartlein, P. J., Feichter, J., Korhola, A., Kulmala, M., O’Donnell, D., Schurgers, G., Sorvari, S., and Vesala, T.: Terrestrial biogeochemical feedbacks in the climate system, Nat. Geosci., 3, 525–532, available at:
5
http://dx.doi.org/10.1038/ngeo905, 2010. 14609
Atkinson, R.: Atmospheric chemistry of VOCs and NOx, Atmos. Environ., 34, 2063–2101,
doi:10.1016/S1352-2310(99)00460-4, 2000. 14610, 14621
Atkinson, R., Aschmann, S. M., and Arey, J.: Rate constants for the gas-phase reactions of OH
and NO3radicals and O3with sabinene and camphene at 296±2 K, Atmos. Environ. A-Gen.,
10
24, 2647–2654, doi:10.1016/0960-1686(90)90144-C, 1990. 14610
Cai, H. and Xie, S. D.: Tempo-spatial variation of emission inventories of speciated volatile organic compounds from on-road vehicles in China, Atmos. Chem. Phys., 9, 6983–7002, doi:10.5194/acp-9-6983-2009, 2009. 14618
Calogirou, A., Larsen, B. R., Brussol, C., Duane, M., and Kotzias, D.: Decomposition of
ter-15
penes by ozone during sampling on Tenax, Anal. Chem., 68, 1499–1506, 1996. 14612 Ciccioli, P., Brancaleoni, E., Possanzini, M., Brachetti, A., and Di Palo, C.: Physico-Chemical
Behaviour of Atmospheric Pollutants, 62–73, D. Reidel Publishing Co., Dordrecht, Holland, 1984. 14612
Copolovici, L., Filella, I., Llusia, J., Niinemets, ¨U., and Pe ˜nuelas, J.: The capacity for thermal
20
protection of photosynthetic electron transport varies for different monoterpenes inQuercus
ilex, Plant Physiol., 139, 485–496, 2005. 14609
Copolovici, L., K ¨annaste, A., and Niinemets, ¨U.: Gas Chromatography-mass
spectrome-try method for determination of monoterpene and sesquiterpene emissions from stressed plants, Stud. Univ. Babes-Bol., 54, 329–339, 2009. 14612
25
Eerdekens, G., Yassaa, N., Sinha, V., Aalto, P. P., Aufmhoff, H., Arnold, F., Fiedler, V.,
Kul-mala, M., and Williams, J.: VOC measurements within a boreal forest during spring 2005: on the occurrence of elevated monoterpene concentrations during night time intense particle concentration events, Atmos. Chem. Phys., 9, 8331–8350, doi:10.5194/acp-9-8331-2009, 2009. 14617, 14619
30
ACPD
11, 14607–14635, 2011Seasonal variation in vertical ambient BVOC concentrations
S. M. Noe et al.
Title Page
Abstract Introduction
Conclusions References
Tables Figures
◭ ◮
◭ ◮
Back Close
Full Screen / Esc
Printer-friendly Version Interactive Discussion
Discussion
P
a
per
|
Dis
cussion
P
a
per
|
Discussion
P
a
per
|
Discussio
n
P
a
per
|
model, Atmos. Environ., 40, 28–42, doi:10.1016/j.atmosenv.2005.11.070, 2006. 14609
Fuentes, J., Wang, D., Bowling, D., Potosnak, M., Monson, R., Goliff, W., and Stockwell, W.:
Bio-genic hydrocarbon chemistry within and above a mixed deciduous forest, J. Atmos. Chem., 56, 165–185, 2007. 14609, 14617, 14619
Gray, C. M., Monson, R. K., and Fierer, N.: Emissions of volatile organic compounds during the
5
decomposition of plant litter, J. Geophys. Res., 115, G03015, available at: http://dx.doi.org/ 10.1029/2010JG001291, 2010. 14622
Guenther, A., Karl, T., Harley, P., Wiedinmyer, C., Palmer, P. I., and Geron, C.: Estimates of global terrestrial isoprene emissions using MEGAN (Model of Emissions of Gases and Aerosols from Nature), Atmos. Chem. Phys., 6, 3181–3210, doi:10.5194/acp-6-3181-2006,
10
2006. 14609, 14610
Hakola, H., Laurila, T., Rinne, J., and Puhto, K.: The ambient concentrations of biogenic hy-drocarbons at a Northern European, boreal site, Atmos. Environ., 34, 4971–4982, 2000. 14617
Hakola, H., Tarvainen, V., Laurila, T., Hiltunen, V., Hell ´en, H., and Keronen, P.: Seasonal
vari-15
ation of VOC concentrations above a boreal coniferous forest, Atmos. Environ., 37, 1623– 1634, 2003. 14609
Hakola, H., Hell ´en, H., Tarvainen, V., B ¨ack, J., Patokoski, J., and Rinne, J.: Annual variations of atmospheric VOC concentrations in a boreal forest., Boreal Environ. Res., 14, 722–730, 2009. 14609, 14617
20
Harrison, D., Hunter, M. C., Lewis, A. C., Seakins, P. W., Bonsang, B., Gros, V., Kanakidou, M., Touaty, M., Kavouras, I., Mihalopoulos, N., Stephanou, E., Alves, C., Nunes, T., and Pio, C.:
Ambient isoprene and monoterpene concentrations in a Greek fir (Abies borisii-regis) forest.
Reconciliation with emissions measurements and effects on measured OH concentrations,
Atmos. Environ., 35, 4699–4711, 2001. 14617
25
Hayward, S., Muncey, R. J., James, A. E., Halsall, C. J., and Hewitt, C. N.: Monoterpene emissions from soil in a Sitka spruce forest, Atmos. Environ., 35, 4081–4087, 2001. 14622 Holzinger, R., Lee, A., Paw, K. T., and Goldstein, U. A. H.: Observations of oxidation products
above a forest imply biogenic emissions of very reactive compounds, Atmos. Chem. Phys., 5, 67–75, doi:10.5194/acp-5-67-2005, 2005. 14609
30
ACPD
11, 14607–14635, 2011Seasonal variation in vertical ambient BVOC concentrations
S. M. Noe et al.
Title Page
Abstract Introduction
Conclusions References
Tables Figures
◭ ◮
◭ ◮
Back Close
Full Screen / Esc
Printer-friendly Version Interactive Discussion
Discussion
P
a
per
|
Dis
cussion
P
a
per
|
Discussion
P
a
per
|
Discussio
n
P
a
per
|
Intergovernmental Panel on Climate Change: Fourth Assessment Report: Climate Change
2007: The AR4 Synthesis Report, Geneva: IPCC, available at: http://www.ipcc.ch/
ipccreports/ar4-wg1.htm (last access: 3 August 2010), 2007. 14610
Isidorov, V. A., Smolewska, M., Purzy ´nska-Pugacewicz, A., and Tyszkiewicz, Z.: Chemical composition of volatile and extractive compounds of pine and spruce leaf litter in the
ini-5
tial stages of decomposition, Biogeosciences, 7, 2785–2794, doi:10.5194/bg-7-2785-2010, 2010. 14620, 14622, 14630
Kanakidou, M., Seinfeld, J. H., Pandis, S. N., Barnes, I., Dentener, F. J., Facchini, M. C., Van Dingenen, R., Ervens, B., Nenes, A., Nielsen, C. J., Swietlicki, E., Putaud, J. P., Balkan-ski, Y., Fuzzi, S., Horth, J., Moortgat, G. K., Winterhalter, R., Myhre, C. E. L., Tsigaridis, K.,
10
Vignati, E., Stephanou, E. G., and Wilson, J.: Organic aerosol and global climate modelling: a review, Atmos. Chem. Phys., 5, 1053–1123, doi:10.5194/acp-5-1053-2005, 2005. 14610 Karl, T., Potosnak, M., Guenther, A., Clark, D., Walker, J., Herrick, J. D., and Geron, C.:
Ex-change processes of volatile organic compounds above a tropical rain forest: implications for modeling tropospheric chemistry above dense vegetation, J. Geophys. Res., 109, D18306,
15
available at: http://dx.doi.org/10.1029/2004JD004738, 2004. 14609, 14610
Kulmala, M., Suni, T., Lehtinen, K. E. J., Dal Maso, M., Boy, M., Reissell, A., Rannik, ¨U,
Aalto, P., Keronen, P., Hakola, H., B ¨ack, J., Hoffmann, T., Vesala, T., and Hari, P.: A new
feedback mechanism linking forests, aerosols, and climate, Atmos. Chem. Phys., 4, 557– 562, doi:10.5194/acp-4-557-2004, 2004. 14609
20
Lyubovtseva, Y. S., Sogacheva, L., Dal Maso, M., Bonn, B., Keronen, P., and Kulmala, M.: Seasonal variations of trace gases, meteorological parameters, and formation of aerosols in boreal forests., Boreal Environ. Res., 10, 493–510, 2005. 14610
Mayrhofer, S., Teuber, M., Zimmer, I., Louis, S., Fischbach, R. J., and Schnitzler, J.-P.: Diurnal and seasonal variation of isoprene biosynthesis-related genes in grey poplar leaves, Plant
25
Physiol., 139, 474–484, doi:10.1104/pp.105.066373, 2005. 14609
Ng, N. L., Kwan, A. J., Surratt, J. D., Chan, A. W. H., Chhabra, P. S., Sorooshian, A., Pye, H. O. T., Crounse, J. D., Wennberg, P. O., Flagan, R. C., and Seinfeld, J. H.: Secondary
organic aerosol (SOA) formation from reaction of isoprene with nitrate radicals (NO3), Atmos.
Chem. Phys., 8, 4117–4140, doi:10.5194/acp-8-4117-2008, 2008. 14610
30
Niinemets, ¨U.: Responses of forest trees to single and multiple environmental stresses from
ACPD
11, 14607–14635, 2011Seasonal variation in vertical ambient BVOC concentrations
S. M. Noe et al.
Title Page
Abstract Introduction
Conclusions References
Tables Figures
◭ ◮
◭ ◮
Back Close
Full Screen / Esc
Printer-friendly Version Interactive Discussion
Discussion
P
a
per
|
Dis
cussion
P
a
per
|
Discussion
P
a
per
|
Discussio
n
P
a
per
|
Niinemets, ¨U.: Mild versus severe stress and BVOCs: thresholds, priming and consequences,
Trends Plant Sci., 15, 145–153, 2010b. 14610
Niinemets, ¨U., Arneth, A., Kuhn, U., Monson, R. K., Pe ˜nuelas, J., and Staudt, M.: The emission
factor of volatile isoprenoids: stress, acclimation, and developmental responses, Biogeo-sciences, 7, 2203–2223, doi:10.5194/bg-7-2203-2010, 2010a. 14619
5
Niinemets, ¨U., Monson, R. K., Arneth, A., Ciccioli, P., Kesselmeier, J., Kuhn, U., Noe, S. M.,
Pe ˜nuelas, J., and Staudt, M.: The leaf-level emission factor of volatile isoprenoids:
caveats, model algorithms, response shapes and scaling, Biogeosciences, 7, 1809–1832, doi:10.5194/bg-7-1809-2010, 2010b. 14610
Nilsson, S. G.: Forests in the temperate-boreal transition: natural and man-made features,
10
Ecol. Bull., 46, 61–71, 1997. 14610
Noe, S. M., Copolovici, L., Niinemets, ¨U., and Vaino, E.: Foliar limonene uptake scales positively
with leaf lipid content: “non-emitting” species absorb and release monoterpenes., Plant Biol., 10, 129–137, 2008. 14609
Noe, S. M., Kimmel, V., H ¨uve, K., Copolovici, L., Portillo-Estrada, M., P ¨uttsepp, ¨U., J ˜ogiste, K.,
15
Niinemets, ¨U., H ¨ortnagl, L., and Wohlfahrt, G.: Ecosystem-scale biosphere-atmosphere
in-teractions of a hemiboreal mixed forest stand at J ¨arvselja, Estonia, Forest Ecol. Manag., doi:10.1016/j.foreco.2010.09.013, in press, 2010. 14611, 14619, 14621
R ¨ais ¨anen, T., Ryypp ¨o, A., and Kellom ¨aki, S.: Impact of timber felling on the ambient
monoter-pene concentration of a Scots pine (Pinus sylvestrisL.) forest, Atmos. Environ., 42, 6759–
20
6766, 2008. 14617
R ¨ais ¨anen, T., Ryypp ¨o, A., and Kellom ¨aki, S.: Monoterpene emission of a boreal Scots pine (Pinus sylvestrisL.) forest, Agr. Forest Meteorol., 149, 808–819, 2009. 14617
Ramirez, K., Lauber, C., and Fierer, N.: Microbial consumption and production of volatile or-ganic compounds at the soil-litter interface, Biogeochemistry, 99, 97–107, 2010. 14622
25
Reimann, S., Calanca, P., and Hofer, P.: The anthropogenic contribution to isoprene concentra-tions in a rural atmosphere, Atmos. Environ., 34, 109–115, 2000. 14618
Rinne, H. J. I., Guenther, A. B., Greenberg, J. P., and Harley, P. C.: Isoprene and monoterpene fluxes measured above Amazonian rainforest and their dependence on light and tempera-ture, Atmos. Environ., 36, 2421–2426, 2002. 14617
30
Rinne, J., Hakola, H., Laurila, T., and Rannik, ¨U.: Canopy scale monoterpene emissions of
Pinus sylvestrisdominated forests, Atmos. Environ., 34, 1099–1107, 2000. 14617
emis-ACPD
11, 14607–14635, 2011Seasonal variation in vertical ambient BVOC concentrations
S. M. Noe et al.
Title Page
Abstract Introduction
Conclusions References
Tables Figures
◭ ◮
◭ ◮
Back Close
Full Screen / Esc
Printer-friendly Version Interactive Discussion
Discussion
P
a
per
|
Dis
cussion
P
a
per
|
Discussion
P
a
per
|
Discussio
n
P
a
per
|
sion rates for two typical Mediterranean species (Pinus pineaandQuercus ilex) from field
measurements–relationship with temperature and PAR, Atmos. Environ., 35, 4419–4431, 2001. 14609
Sætersdal, M., Birks, H. J. B., and Peglar, S.: Predicting changes in Fennoscandian vascular-plant species richness as a result of future climatic change, J. Biogeogr., 25, 111–112, 1998.
5
14610
Schurgers, G., Arneth, A., Holzinger, R., and Goldstein, A. H.: Process-based modelling of biogenic monoterpene emissions combining production and release from storage, Atmos. Chem. Phys., 9, 3409–3423, doi:10.5194/acp-9-3409-2009, 2009. 14609
Smolander, A., Ketola, R. A., Kotiaho, T., Kanerva, S., Suominen, K., and Kitunen, V.: Volatile
10
monoterpenes in soil atmosphere under birch and conifers: effects on soil N transformations,
Soil Biol. Biochem., 38, 3436–3442, 2006. 14620
Spracklen, D. V., Bonn, B., and Carslaw, K. S.: Boreal forests, aerosols and the impacts on clouds and climate, Philos. T. Roy. Soc. A, 366, 4613–4626, 2008. 14610
Strong, C., Fuentes, J., and Baldocchi, D.: Reactive hydrocarbon flux footprints during canopy
15
senescence, Agr. Forest Meteorol., 127, 159–173, 2004. 14609
Stroud, C., Makar, P., Karl, T., Guenther, A., Geron, C., Turnipseed, A., Nemitz, E., Baker, B., Potosnak, M., and Fuentes, J. D.: Role of canopy-scale photochemistry in modifying biogenic-atmosphere exchange of reactive terpene species: results from the CELTIC field study, J. Geophys. Res., 110, D17303, doi:10.1029/2005JD005775, 2005. 14609, 14610,
20
14617
Theloke, J. and Friedrich, R.: Compilation of a database on the composition of anthropogenic VOC emissions for atmospheric modeling in Europe, Atmos. Environ., 41, 4148–4160, 2007. 14618
Toome, M., Randj ¨arv, P., Copolovici, L., Niinemets, ¨U., Heinsoo, K., Luik, A., and Noe, S. M.:
25
Leaf rust induced volatile organic compounds signalling in willow during the infection, Planta, 232, 235–243, 2010. 14612
Turtola, S., Manninen, A.-M., Rikala, R., and Kainulainen, P.: Drought stress alters the concen-tration of wood terpenoids in Scots pine and Norway spruce seedlings, J. Chem. Ecol., 29, 1981–1995, 2003. 14615, 14621
ACPD
11, 14607–14635, 2011Seasonal variation in vertical ambient BVOC concentrations
S. M. Noe et al.
Title Page
Abstract Introduction
Conclusions References
Tables Figures
◭ ◮
◭ ◮
Back Close
Full Screen / Esc
Printer-friendly Version Interactive Discussion
Discussion
P
a
per
|
Dis
cussion
P
a
per
|
Discussion
P
a
per
|
Discussio
n
P
a
per
|
Table 1. Overview of the meteorological conditions on the days when VOC vertical profile sampling was conducted. All values are reported as hourly averages during the time of mea-surements and refer to the top of the measurement tower at 20 m. The type of measurement
conducted refers as follows v=volatile sampling, t=temperature measured on all heights,
l=light measured on all heights. The sampling was in all cases conducted under clear sky
conditions.
measurement type wind wind speed temperature air pressure
date direction (m s−1
) (◦C) (hPa)
Oct 2009 v 209◦ 3.7 7.8 1022.7
Jan 2010 v 56◦ 1.9
−19.4 1042.7
Apr 2010 v 285◦ 1.1 8.2 1021.1
Mai 2010 v 61◦ 3 24.5 1012.5
Jun 2010 v 270◦ 1.5 24.3 1021.1
Jul 2010 v,l 167◦ 5.7 31.2 1006.5
Aug 2010 v,t,l 118◦ 2.6 25.2 1020.7
ACPD
11, 14607–14635, 2011Seasonal variation in vertical ambient BVOC concentrations
S. M. Noe et al.
Title Page
Abstract Introduction
Conclusions References
Tables Figures
◭ ◮
◭ ◮
Back Close
Full Screen / Esc
Printer-friendly Version Interactive Discussion
Discussion
P
a
per
|
Dis
cussion
P
a
per
|
Discussion
P
a
per
|
Discussio
n
P
a
per
|
Table 2. Comparison of the relative contribution of monoterpenes from several possible sources near the forest floor. Resin samples have been taken in September 2010.
name resin spruce litter pine litter soil efflux
[%] [%] [%] [%]
α-pinene 34.84 38.62 58.67 59.06
β-pinene 35.38 4.83 4.59 3.79
∆3-carene 13.91 2.07 27.04 25.91
limonene 14.8 11.03 0.51 0.24
ACPD
11, 14607–14635, 2011Seasonal variation in vertical ambient BVOC concentrations
S. M. Noe et al.
Title Page
Abstract Introduction
Conclusions References
Tables Figures
◭ ◮
◭ ◮
Back Close
Full Screen / Esc
Printer-friendly Version Interactive Discussion
Discussion
P
a
per
|
Dis
cussion
P
a
per
|
Discussion
P
a
per
|
Discussio
n
P
a
per
|
24 25 26 27 28
0 5 10 15 20
temperature@°CD
he
ight
@
m
D
0 200 400 600 800 1000 1200 1400 0
5 10 15 20
PPFD@Ðmol m-2s-1
D
he
ight
@
m
D
370 380 390 400 410 0
5 10 15 20
CO2@ppmD
he
ight
@
m
D
Fig. 1. Example of key environmental drivers for isoprene and monoterpene emissions from
forest canopies in summer. Air temperature, quantum flux density (PPFD) and ambient CO2
ACPD
11, 14607–14635, 2011Seasonal variation in vertical ambient BVOC concentrations
S. M. Noe et al.
Title Page
Abstract Introduction
Conclusions References
Tables Figures
◭ ◮
◭ ◮
Back Close
Full Screen / Esc
Printer-friendly Version Interactive Discussion
Discussion
P
a
per
|
Dis
cussion
P
a
per
|
Discussion
P
a
per
|
Discussio
n
P
a
per
|
20 m 2 m
0.5 1.0 1.5 2.0 2.5 3.0 3.5
wind
speed
@
ms
-1 D
Fig. 2.Example for the variation of the wind speed above (20 m) and within the forest canopy (2 m). The data were measured during August 2009. The monthly median wind speed at 20 m
height was 1.04 m s−1
and at 2 m height dropped to 0.25 m s−1
ACPD
11, 14607–14635, 2011Seasonal variation in vertical ambient BVOC concentrations
S. M. Noe et al.
Title Page
Abstract Introduction
Conclusions References
Tables Figures
◭ ◮
◭ ◮
Back Close
Full Screen / Esc
Printer-friendly Version Interactive Discussion
Discussion
P
a
per
|
Dis
cussion
P
a
per
|
Discussion
P
a
per
|
Discussio
n
P
a
per
|
0 m 4 m 8 m 12 m 16 m 20 m
0 1 2 3 4 5 6 7
isoprene@Μg m-3D
0 20 40 60 80 100 120 140
Smonoterpenes@Μg m-3D Oct 2009 Jan 2010 Apr 2010 Mai 2010 Jun 2010 Jul 2010 Aug 2010 Sep 2010
Fig. 3.Isoprene and total monoterpene concentrations measured in ambient air throughout the
forest canopy and seasons. The sum of monoterpenes includesα-thujene,α- andβ-pinene,
ACPD
11, 14607–14635, 2011Seasonal variation in vertical ambient BVOC concentrations
S. M. Noe et al.
Title Page
Abstract Introduction
Conclusions References
Tables Figures
◭ ◮
◭ ◮
Back Close
Full Screen / Esc
Printer-friendly Version Interactive Discussion
Discussion
P
a
per
|
Dis
cussion
P
a
per
|
Discussion
P
a
per
|
Discussio
n
P
a
per
|
æ æ
æ æ
æ æ
æ æ
æ æ
0 2 4 6 8
20 m
16 m
12 m
8 m
4 m
0 m
isoprene@Μg m-3D
æ æ
æ æ
æ æ
æ æ
0 20 40 60 80 100 120 140
SMonoterpens@Μg m-3D
0 5 10 15
20 m
16 m
12 m
8 m
4 m
0 m
ACPD
11, 14607–14635, 2011Seasonal variation in vertical ambient BVOC concentrations
S. M. Noe et al.
Title Page
Abstract Introduction
Conclusions References
Tables Figures
◭ ◮
◭ ◮
Back Close
Full Screen / Esc
Printer-friendly Version Interactive Discussion
Discussion
P
a
per
|
Dis
cussion
P
a
per
|
Discussion
P
a
per
|
Discussio
n
P
a
per
|
0. 0.2 0.4 0.6 0.8 1.
20
m
0. 0.2 0.4 0.6 0.8 1.
16
m
0. 0.2 0.4 0.6 0.8 1.
12
m
0. 0.2 0.4 0.6 0.8 1.
8
m
0. 0.2 0.4 0.6 0.8 1.
4
m
10!0901!1004!1005!1006!1007!1008!1009!10
0. 0.2 0.4 0.6 0.8 1.
0
m