www.atmos-chem-phys.net/16/1619/2016/ doi:10.5194/acp-16-1619-2016
© Author(s) 2016. CC Attribution 3.0 License.
OH reactivity and concentrations of biogenic volatile organic
compounds in a Mediterranean forest of downy oak trees
N. Zannoni1, V. Gros1, M. Lanza2, R. Sarda1, B. Bonsang1, C. Kalogridis1,a, S. Preunkert3,4, M. Legrand3,4, C. Jambert5, C. Boissard1, and J. Lathiere1
1LSCE, Laboratoire des Sciences du Climat et de l’Environnement, CNRS-CEA-UVSQ, Orme des Merisiers,
91191 Gif sur Yvette, France
2Ionicon Analytik GmbH, Eduard-Bodem-Gasse 3, 6020 Innsbruck, Austria
3CNRS, Laboratoire de Glaciologie et Géophysique de l’Environnement (LGGE), 38000 Grenoble, France 4Univ. Grenoble Alpes, LGGE, 38000 Grenoble, France
5Laboratoire d’Aerologie, Université de Toulouse-CNRS, 14 Avenue Edouard Belin, 31400 Toulouse, France anow at: Institute of Nuclear Technology and Radiation Protection, Environmental Radioactivity
Laboratory, National Centre of Scientific Research “Demokritos”, 15310 Ag. Paraskevi, Attiki, Greece
Correspondence to:N. Zannoni ([email protected])
Received: 12 June 2015 – Published in Atmos. Chem. Phys. Discuss.: 17 August 2015 Revised: 13 January 2016 – Accepted: 26 January 2016 – Published: 11 February 2016
Abstract. Total OH reactivity, defined as the total loss fre-quency of the hydroxyl radical in the atmosphere, has proved to be an excellent tool to identify the total loading of reac-tive species in ambient air. High levels of unknown reactiv-ity were found in several forests worldwide and were often higher than at urban sites.
Our study presents atmospheric mixing ratios of biogenic compounds and total OH reactivity measured during late spring 2014 at the forest of downy oak trees of the Obser-vatoire de Haute Provence (OHP), France. Air masses were sampled at two heights: 2 m, i.e., inside the canopy, and 10 m, i.e., above the canopy, where the mean canopy height is 5 m. We found that the OH reactivity at the site mainly de-pended on the main primary biogenic species emitted by the forest, which was isoprene and to a lesser extent by its degradation products and long-lived atmospheric compounds (up to 26 % during daytime). During daytime, no significant missing OH reactivity was reported at the site, either inside or above the canopy. However, during two nights we deter-mined a missing fraction of OH reactivity up to 50 %, pos-sibly due to unmeasured oxidation products. We confirmed that no significant oxidation of the primary species occurred within the canopy; primary compounds emitted by the for-est were fast transported to the atmosphere. Finally, the OH reactivity at this site was maximum 69 s−1, which is a high
value for a forest characterized by a temperate climate. Ob-servations in various and diverse forests in the Mediterranean region are therefore needed to better constrain the impact of reactive gases over this area.
1 Introduction
The atmospheric oxidation of volatile organic compounds di-rectly impacts the quality of air and Earth’s climate. Biogenic volatile organic compounds (BVOCs) are globally the most abundant class of reactive organic compounds in the tropo-sphere. On a regional scale, such as in urban environments, organic compounds emitted by anthropogenic sources may dominate the atmospheric reactivity.
and monoterpenes are the most studied, with a number of publications covering their synthesis and emission factors (Laothawornkitkul et al., 2009), canopy fluxes (Rinne et al., 2002; Karl et al., 2007), atmospheric mixing ratios (de Gouw and Warneke, 2007; Yáñez-Serrano et al., 2015) and atmo-spheric role (Atkinson and Arey, 1998; Fuentes et al., 2000; Whalley et al., 2014) currently available.
Isoprene alone represents half of all biogenic compounds emitted and constitutes the largest single source of VOCs in the atmosphere, with a current global estimate of about 500 TgC yr−1(Guenther et al., 2006) and large uncertainties still associated (Sindelarova et al., 2014).
When isoprene is released into the atmosphere, it is rapidly oxidized by the hydroxyl radical (OH), ozone (O3), the
ni-trate radical (NO3)during nighttime and occasionally
chlo-rine atoms. The presence, position and number of double bonds determine its high reactivity as a molecule. Atkin-son and Arey (2003) have estimated lifetimes for isoprene ranging from a few hours with OH and NO3 to a few
days with O3, while monoterpenes and sesquiterpenes
life-times can range from a few minutes to hours with OH, NO3 and O3 (with mean concentrations of oxidants equal
to 2×10⁶molecules cm−3for OH, 7×10¹¹molecules cm−3 for ozone and 2.5×10⁸molecules cm−3for NO3). By com-parison, anthropogenic emitted molecules have lifetimes that vary from hours to years (Atkinson, 2000), resulting in bio-genic compounds playing a dominant role in the lower tro-posphere and atmospheric boundary layer.
The dominant loss of isoprene is the oxidation reac-tion with the OH radical, which involves the formareac-tion of six isomeric peroxy radicals that further react in unpol-luted environments, forming methyl vinyl ketone (MVK), methacrolein (MACR) and formaldehyde (HCHO) as pri-mary products in the highest yields (Jenkin et al., 1998). Other product intermediates and secondary products in its oxidation pathway include hydroperoxides, hydroxyacetone, glyoxal, methylglyoxal, 3-methylfuran, acetic acid, glyco-laldehyde and formic acid. Reactions with OH finally lead to the production of carbon dioxide and water, including the formation of ozone and low volatile products which can par-tition to the particle phase. Significant production of ground-level ozone on the regional scale was reported by Hirsch et al. (1996) and in northeastern USA and Europe by Tsigaridis and Kanakidou (2002), while production of secondary or-ganic aerosols was demonstrated by Claeys et al. (2004).
Furthermore, isoprene and BVOCs emissions influence the oxidative capacity of the atmosphere, impacting the life-time of many species including long-lived species such as methane and hydrofluorocarbons, which are commonly de-pleted by OH.
Total OH reactivity is defined as the total loss of the hydroxyl radical due to the reaction with ambient reactive molecules. It has been demonstrated to be an excellent tool for providing indirect evidence of the importance of tive molecules in ambient air. In addition, when OH
reac-tivity is measured together with the concentration of trace compounds, it is possible to evaluate whether all the reactive components in the studied environment are identified or not. Missing reactivity, which is the fraction of measured OH re-activity not explained by complementary gas phase measure-ments, has been already reported in several forested sites (di Carlo et al., 2004; Sinha et al., 2010; Nölscher et al., 2013). It was found to be up to almost 90 % (Nölscher et al., 2012a) and usually higher than most of the urban sites investigated (Ren, 2003; Yoshino et al., 2006). Di Carlo and coworkers were the first to report evidences of a missing biogenic source in a forest in Michigan, probably associated with terpene-like emissions and not accounted for in trace gas analysis. Their work pioneered and motivated followup studies of OH reac-tivity at other forested sites, including boreal forests (Sinha et al., 2010; Nölscher et al., 2012a; Mogensen et al., 2011), temperate mixed forests (Ren et al., 2006; Mao et al., 2012; Nölscher et al., 2013; Hansen et al., 2014 and Nakashima et al., 2014) and tropical forests (Sinha et al., 2008; Ingham et al., 2009 and Edwards et al., 2013).
The Mediterranean alone emits about 40 t km−2yr−1 of BVOCs (as country-specific emission density considered for Portugal, Cyprus, Spain, Greece, Albania, Slovenia, Italy, Croatia and Bosnia/Herzegovina; Rainer Steinbrecher, 2009); its warm temperature and sunny conditions trigger emissions of BVOCs, which have a clear light and temper-ature dependence. Global warming is expected to impact the Mediterranean more than other areas in the world (Mellouki and Ravishankara, 2007). Model predictions have shown that this area will be characterized by higher temperatures, ex-tended drought periods, enhanced ozone and particles levels (Giorgi, 2006; Giorgi and Lionello, 2008; Giorgi et al., 2011) all which will influence BVOCs emissions in strength and pattern (Laothawornkitkul et al., 2009). Such findings high-light the importance of conducting more intense and long-term field studies in the Mediterranean region.
Our study represents the first and only study to date of OH reactivity in a Mediterranean forest. It shows results of total OH reactivity and BVOCs concentration from a field exper-iment conducted at two heights in the forest of the Observa-toire de Haute Provence (OHP), France, during late spring 2014.
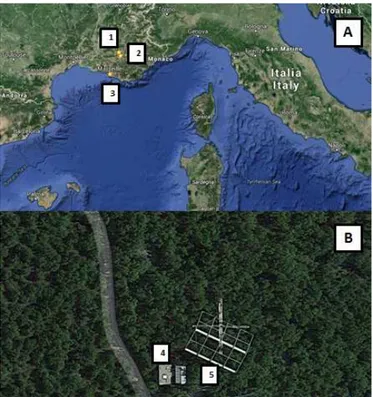
dur-Figure 1.Site of Observatoire de Haute Provence (OHP) in the Eu-ropean map(a)and seen from above(b). Numbers refer to (1) OHP field site, (2) town of Manosque, (3) city of Marseille, (4) room for instruments measuring trace gases and (5) movable trailer for mea-suring OH reactivity.
ing spring 2012 (Kalogridis et al., 2014) and low intracanopy oxidation processes (Kalogridis et al., 2014).
OH reactivity was used as a tool to examine the reactive carbon budget and help assess the oxidative processes occur-ring through the canopy.
We measured total OH reactivity with the comparative re-activity method (CRM; Sinha et al., 2008) and used comple-mentary measurements of trace gas concentrations to eluci-date any missing reactivity pattern. We determined the OH reactivity and the trace gases at the same time and investi-gated two canopy heights: one inside the forest at 2 m and a second one above the forest at 10 m.
2 Methodology
2.1 Description of the field site
We measured total OH reactivity and atmospheric gases concentrations at the oak observatory of the field site of OHP (http://www.obs-hp.fr), as part of the CANOPEE project (https://o3hp.obs-hp.fr/index.php/en/research/projects/ 121-canopee-anr-jc-2011-en). Observatoire de Haute Provence is located in the Mediterranean region, southeast of France (5◦42′44′′E, 43◦55′54′′N; 650 m a.s.l.); Marseille is the closest largest city, about 100 km south (∼1 600 000
inhabitants), and Manosque is the closest town, about 18 km south from the site (∼22 000 inhabitants; Fig. 1).
The oak observatory (O3HP, https://o3hp.obs-hp.fr) was installed in 2009 within the OHP site in order to conduct field studies in ecology, plant phenology, microbiology and the atmosphere related to the third most abundant tree species in the French Mediterranean region. A geophysical sciences station (Gerard Megie) and an ICOS tower (Integrated Car-bon Observation System, operative from 11 July 2014) also operate at OHP. The oak observatory is about 95 ha large and extends throughout a deciduous ecosystem dominated by downy oaks (Quercus pubescens Willd.) and Montpellier maple (Acer monspessulanum L.), which represent 75 and 25 %, respectively, of the overstorey canopy. Smokey bushes
(Cotinus coggygria Scop.) and other grass species constitute
the understorey canopy. The whole canopy is about 5 m high with an average leaf area index (LAI) measured during Au-gust 2010 of 2.4 (LAI-2000, Li-Cor, Lincoln, NE, USA). The climate at the site is typical of the Mediterranean area, with dry and hot summers and humid cool winters.
Downy oak is a tree species known to emit almost ex-clusively isoprene (about 99 %; see Genard-Zielinski et al., 2015) and due to its dominance in this forest it makes OHP a natural laboratory for focused studies on isoprene.
Our field work took place during 29 May–12 June 2014, as a followup experimental study of the works conducted during spring 2012 and published by Kalogridis et al. (2014) and Genard-Zielinski et al. (2015).
2.2 Ambient air sampling
We measured the total OH reactivity together with the con-centrations of BVOCs emitted by the forest, their oxidation products and main atmospheric constituents. For these mea-surements we deployed the following techniques: the CRM (home built), a PTR-MS (Ionicon Analytik GmbH, Austria), a gas chromatography/flame ionization detector (GC-FID, Chromatotech, France), a formaldehyde analyzer through the Hantzsch reaction (Aero-Laser GmbH, Germany), offline analysis of sampling tubes through GC-MS (3800/2200 ion trap MS, Varian, USA) and a NOx detector (Thermo Scien-tific, USA).
two pumps placed at the end of both manifolds. The flows and lines lengths were adjusted in order to have similar res-idence times of the species sampled through lines A and B that were, respectively, 23 and 13 s. The lines’ entire lengths were, respectively, 28 and 18 m for A and B; a joint union piece placed at 2 m on both lines allowed us to disconnect them and perform sampling at two different heights along the forest canopy by using the same line. Finally, both lines were insulated with black tubing and heated with a ther-mocouple type K by about 1◦C above ambient temperature in order to prevent gases condensation. Measurements with this sampling setup were performed sequentially on different days over the campaign period 29 May–12 June 2014 at two heights: 2 and 10 m. With an average canopy height of 5 m, air collection conducted at 2 and 10 m at OHP was used to elucidate the composition and reactivity of air masses inside and above the whole forest.
Extra sampling lines were used for GC-MS offline analy-sis, ozone and NOxdetection.
An autosampler (Sypac V2, Tera Environnement, France) was used to adsorb air on packed stainless steel sampling tubes with Tenax TA and Carbopack X as sorbent, for GC-MS offline analysis of monoterpenes levels. In this case we used an independent extra line that was placed at 2 m on the mast. The sampling was performed every 3 h on specific days and relative speciation among the detected monoterpenes (α -pinene,β-pinene, myrcene, limonene) was used to determine the monoterpenes specific abundance and infer their amount from the total monoterpenes concentration, which instead was measured by PTR-MS.
In addition, NOx (NO+NO2)were sampled through an
independent extra line placed on top of local A, at 4.3 m from the ground, about 15 m away from the mast. Ozone was mon-itored by the regional air quality network and its sampling line was placed a few hundred meters away from the main sampling site at 4.3 m from the ground.
2.3 Comparative reactivity method and instrument performance
Measurements of total OH reactivity were performed with a CRM instrument (home-built CRM; see Sinha et al., 2008, and Nölscher et al., 2012b, for more details on the CRM).
A CRM instrument consists of a glass flow reactor and a detector, in our case a commercial PTR-MS (quadrupole, Ionicon Analytik GmbH, Innsbruck, Austria). The concept of CRM is to produce a competition between a reference molecule, pyrrole (C4H5N) and reactive molecules in
ambi-ent air to react with OH radicals generated inside the glass reactor. OH radicals are obtained from photolysis of water vapor with a pen ray Hg lamp, which emits at 184.9 nm, placed inside one of the reactor arms. Pyrrole is first diluted in zero air and dry nitrogen, and its concentration is moni-tored on the PTR-MS at the protonatedm/z68 (C0). When the Hg lamp is switched on, pyrrole concentration decreases
due to photolysis and its concentration is monitored as C1. Then, the flow of nitrogen passes through a bubbler and wa-ter vapor is transported to the lamp to achieve photolysis and production of OH; in this stage pyrrole reacts with OH (rate coefficient=1.2×10⁻¹⁰cm3molecule−1s−1at 25◦C; Atkinson et al., 1984 and Dillon et al., 2012) and C2 is mon-itored. A four-way valve permits fast switches between zero air and ambient air; when the latter dilutes pyrrole, the com-petition for OH radicals takes place and C3 is the measured concentration of pyrrole. C3 differs from C2 depending on the amount and type of reactive molecules present in ambi-ent air. Differences between C2 and C3 are used to determine the total OH reactivity from the following equation:
Rair=
(C3−C2)
(C1−C3)·kpyrrole+OH·C1. (1)
Equation (1) assumes that the reaction between pyrrole and OH is in the pseudo-first-order kinetics, i.e., [pyr-role] > > [OH].
Reactivity in ambient air is obtained every 10 min (calcu-lated from 5 min on C2 and 5 min on C3) and raw values are corrected for humidity differences between the levels C2 and C3, deviation from first-order kinetics and dilution inside the reactor (Zannoni et al., 2015). Humidity differences between C2 and C3 can affect the concentration of OH radicals pro-duced inside the reactor and can lead to an underestimation or overestimation of the measured OH reactivity. We gener-ated zero air to produce C2 by sampling ambient air through a zero air generator, which removes the VOCs present in am-bient air and leaves the air flow with the same humidity of ambient air. In our case, small differences in humidity were still observed and corrected (13 % decrease of the raw value). We tested the performance of the CRM before and during the field campaign through injections of a known amount of OH reactivity generated by external gas standards. For this purpose, we used a standard of propane, which has a medium reactivity towards OH (kpropane+OH=1.1×10⁻¹²cm3molecule−1s−1; Atkinson et
al., 1997), and isoprene, which instead is very reactive towards OH (kisoprene+OH=1×10⁻¹⁰cm3molecule−1s−1;
Atkinson, 1986) and represents the main component of the air parcels sampled in this specific forest. Injections were performed over a range of pyrrole/OH ratio between 2 and 9, with 9 being the closest to pseudo-first-order kinetics regime. The reactivity measured plotted against the reactiv-ity injected with the two mentioned standards gave a slope of 1.01±0.04 (1σ )with anR2of 0.96 up to reactivity values of 500 s−1. The correction factor (slope of injected reactivity
laboratory (19 % standard deviation among results). Calibra-tions of the PTR-MS for dry and wet pyrrole were carried out at the beginning and end of the field campaign and showed a very good agreement between each other (difference within 1 % for the dry calibration factor and 4 % for the wet cali-bration factor). It is necessary to calibrate pyrrole at dry and wet conditions due to differences in sensitivity reported by the PTR-MS operating at different ambient humidity (Sinha et al., 2010).
During the days dedicated to the sampling of trace gases, we measured OH reactivity for only 5 days (3 days inside the canopy and 2 days above the canopy) due to the time needed to accurately test the performance of our instrument on the field, settings adjustment and tests needed to process the raw data.
Our instrument performs measurements between the limit of detection (LoD) of the instrument (3 s−1, 3σ ) up to
500 s−1with an overall systematic uncertainty of 35 % (1σ ).
More information on our instrument can be found in Zannoni et al. (2015).
2.4 Complementary measurements at the field site We measured the concentration of BVOCs emitted from the forest, their oxidation products and main atmospheric con-stituents. Concentrations are used to calculate the OH reac-tivity at the site with Eq. (2) and the species-specific relative contribution.
R=X
i
ki+OH·Xi, (2)
where i is any measured compound listed in Table 1. The error on the calculated value of OH reactivity is estimated by considering the propagation of the 1σ uncertainty on the rate constant of reaction between OH and the measured com-pound and the 1σuncertainty associated with the concentra-tion of the measured compound.
2.4.1 Proton transfer reaction/mass spectrometer We used a PTR-MS (high-sensitivity quadrupole, Ioni-con Analytik, Austria) operated under standard Ioni-conditions (pdrift=2.2 mbar, E/N=135 Td (1 Td=10−17cm−1), Tinlet=60◦C) to record the concentrations of trace gases at
the site (Lindinger and Jordan, 1998). We sampled the air masses in the scan mode and inspected all species with pro-tonated mass fromm/z21 to m/z138 with cycles of 5 min each. Sampling in the scan mode procedure was revealed to be a convenient way to analyze unknown air parcels.
We calibrated the instrument using a gas calibration unit (GCU, Ionicon Analytik, Austria) with a standard gas mixture (GCU, Ionicon Analytik, Austria) contain-ing methanol (m/z33), acetonitrile (m/z42), acetaldehyde (m/z45), acrolein (m/z57), acetone (m/z59), isoprene (m/z69), crotonaldehyde (m/z71), methyl ethyl ketone
(m/z73), benzene (m/z79), toluene (m/z93) andα-pinene (m/z137); see Table 2 for the list of compounds, their proto-nated mass, mean sensitivity from field calibrations and mass LoD. Calibrations were run over the range 0–20 ppbv at the beginning and at the end of the field campaign, with no sig-nificant change in the detector sensitivity (differences up to 10 % and for most species within 5 %); therefore we used a mean calibration factor for the whole campaign.
Volume mixing ratios for the calibrated species were ob-tained following the procedure of Taipale et al. (2008). Mix-ing ratios for the non-calibrated species were obtained from the transmission curve of the instrument and the species-specific transmission coefficient. Correlations within mixing ratios obtained from calibration and transmission coefficients for calibrated species showed a good/fair agreement (R2for
m/z33,m/z45 andm/z69 was, respectively, 0.81, 0.86 and 0.43).
We used a GC/FID to cross-validate the concentration obtained for isoprene, which is the dominant compound at the site, usually measured at the protonated m/z69 with the PTR-MS but often prone to fragmentation in the drift tube (see Sect. 2.4.2). All the measured species, except iso-prene, were not cross-validated, and their mass identifica-tion was obtained according to the existing studies conducted at similar sites (e.g., Kalogridis et al., 2014; Holzinger et al., 2002; Warneke et al., 2001). This is the case in partic-ular for masses m/z71 and m/z73. The former has usu-ally been attributed to the sum of MVK (methyl vinyl ke-tone) and MACR (methacrolein), the most abundant oxida-tion products of isoprene. Recent studies have highlighted that another group of compounds, the isoprene hydroperox-ides (ISOPOOH), mostly originated from isoprene oxidation in unpolluted environments can also fragment atm/z71 in the PTR-MS (Liu et al., 2013; Rivera-Rios et al., 2014). Since we did not separate these compounds, and we con-ducted our field work in an unpolluted environment where the ISOPOOH might have been produced, we will refer here-inafter tom/z71 as the sum of the isoprene oxidation prod-ucts ISOP.OXs: MVK+MACR+isoprene hydroperoxides (ISOPOOH). Mass-to-charge 73, here reported as methyl ethyl ketone (MEK) and calibrated as such, can have several interferences. Among the possible interferences we speculate the presence of methylglyoxal, a compound generated during the degradation path of isoprene, which is the most abundant compound measured at our site.
Table 1.Measured species (except for CO and methane whose concentrations were assumed) used for calculating OH reactivity.
Family group Species name
Alkanes methane; ethane; propane; n-butane; i-butane; n-pentane; i-pentane; 2,2-dimethylbutane; cyclohexane; hexane
Alkenes ethylene; propene; 1-butene; i-butene; cis-2-butene; 1,3-butadiene; trans-2-pentene; 1-pentene; cis-2-pentene; trans-2-butene
Alkynes acetylene
Aromatics benzene; toluene
Biogenics isoprene; MVK+MACR+ISOPOOH;α-pinene;
β-pinene; myrcene; limonene
Oxygenates formaldehyde; acetaldehyde; methanol; acetone; methyl ethyl ketone
Inorganics CO; NO; NO2
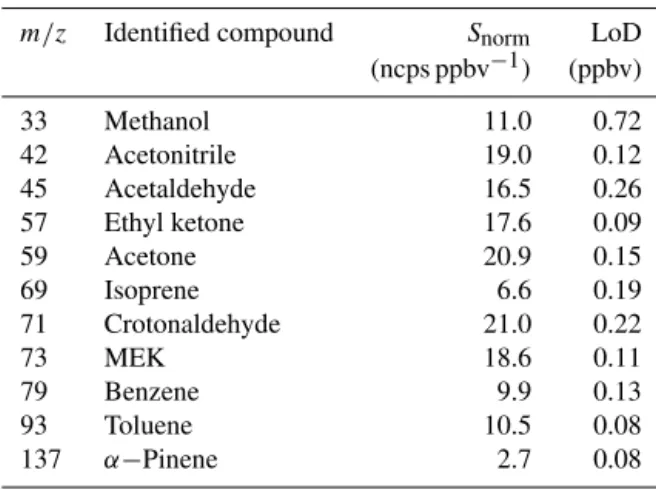
Table 2.Name and mass of VOCs included in the standard mixture used for calibrating the PTR-MS. Reported sensitivities correspond to mean values of calibrations performed during the campaign. Lim-its of detection (LoDs) correspond to 3σof the standard deviation.
VOCs contained in the calibration gas standard
m/z Identified compound Snorm LoD
(ncps ppbv−1) (ppbv)
33 Methanol 11.0 0.72
42 Acetonitrile 19.0 0.12
45 Acetaldehyde 16.5 0.26
57 Ethyl ketone 17.6 0.09
59 Acetone 20.9 0.15
69 Isoprene 6.6 0.19
71 Crotonaldehyde 21.0 0.22
73 MEK 18.6 0.11
79 Benzene 9.9 0.13
93 Toluene 10.5 0.08
137 α−Pinene 2.7 0.08
cooled down to−8◦C, filled with Carboxen, Carbopack B
and Carbotrap C, and finally thermodesorbed at 220◦C and
injected on-column into a metal capillary column (Porous Layer Open Tubular Column PLOT, Al2O3/KCl; 0.53 mm
in-ner diameter and 25 m length, Varian Inc, USA). Calibrations were performed twice per week with a certified standard VOC mixture (National Physical Laboratory, UK). The over-all uncertainty was estimated to be 15 % (1σ ). Correlation between isoprene measured by GC-FID and m/z69 identi-fied as the protonated isoprene mass over 30 min averaged data showed differences within 14 % among the two instru-ments (isopreneGC-FID=0.86 (isoprenePTR-MS),R2=0.93).
2.4.3 Formaldehyde analyzer
Formaldehyde (HCHO) was measured with a commercial Aero-Laser analyzer (AL-4021, Aero-Laser GmbH, Ger-many). The technique, a continuous liquid fluorimetry, has
been described in detail elsewhere (Dasgupta et al., 1988). Briefly, gaseous HCHO was scrubbed into a diluted sulfu-ric acid solution in a stripping coil thermostated at+10◦C.
A fluorescent compound was quantitatively produced at +70◦C by the reaction of the liquid solution with the Hantzsch reagent (i.e., a dilute mixture of acetyl acetone, acetic acid and ammonium acetate) and subsequently de-tected at 510 nm.
The working conditions applied to the AL 4021 for this study were similar to those applied previously for the same device in two HCHO studies conducted in Antarctica (Preunkert and Legrand, 2013; Preunkert et al., 2015). In brief, liquid reagents were prepared from analytical grade chemicals (Merck, USA) and ultrapure water (18 megohm, TOC < 1 ppbv, Elga Labwater); the air flow was kept at 1000 sccm, which ensured a stripping efficiency of more than 99 %. Raw data were collected with a time resolution of 30 s. Gas standard calibrations and background levels took 50 and 25 min and were performed every 12 and 3 h, respec-tively. A mean detection limit of 42±16 pptv is calculated as twice the standard deviation of the raw data (30 s) obtained during the 121 zero measurements made during the cam-paign, which was consistent with the typical LoD achieved (∼30 pptv) with the same analyzer in the above-cited previ-ous studies.
2.4.4 NOxanalyzer
Nitrogen oxides were measured with a commercial instru-ment (17i model, Thermo Scientific, USA), based on chemi-luminescence. Its calibration was performed after the field campaign, where a LoD of 0.3 ppbv (2σ )and a precision of ±0.4 ppbv were estimated.
Nitrogen oxides were sampled at 15 m from the main sam-pling site; hence we assumed that their concentration inside and above the canopy was not affected by any significant change.
2.4.5 GC-MS offline analysis
Adsorbing stainless steel sampling tubes with Tenax TA and Carbopack X as sorbents were used to sample monoterpenes asα-pinene,β-pinene,β-myrcene and limonene for off-line analysis with a GC-MS (3800/2200 ion trap MS, Varian, USA). Sampling was conducted at ambient temperature with an autosampler (Sypac V2, Tera Environnement, France) ev-ery 3 h, tubes were then stored at 4◦C and analyzed within 1 month in the laboratory. Ozone was removed from the tubes prior to the sampling procedure by using MnO2-coated
cop-per nets according to the procedure reported in Larsen et al. (1997). Concentrations of individual monoterpenes were then used to infer their relative abundance from the total monoterpenes concentration obtained with the PTR-MS and calculate their contribution to the OH reactivity.
2.4.6 O3, CH4, CO
Ozone is constantly monitored at OHP from the regional air quality network Air-Paca, France (http://www.atmopaca. org/). The monitor is placed in a container located at a distance of a few hundred meters from the sampling site. Methane and carbon monoxide mean concentrations were derived based on measurements conducted during spring 2012 and considered to be 1900 ppbv and 108±16 ppbv, re-spectively.
2.4.7 Meteorological parameters
Meteorological parameters such as temperature, relative hu-midity (CS215, Campbell Scientific, UK), photosynthetical active radiation (PAR; LI-190, Li-Cor, Lincoln, NE, USA), wind speed and wind direction were acquired through sen-sors already available at the measurements site (O3HP
web-site: https://o3hp.obs-hp.fr/index.php/fr/). In this work we used data collected at 2 and at 6 m to help with discussion of the results inside the canopy and above the canopy, re-spectively.
12
10
8
6
4
2
0
ppbv
20 15 10 5
Hour of the day
1500
1000
500
0
PAR (µmol m
-2
s
-1
)
26
24
22
20
18
16
14
Temperature (°C)
20 15 10 5
Hour of the day m/z 69
m/z 71 HCHO PAR T
Inside Canopy Above Canopy
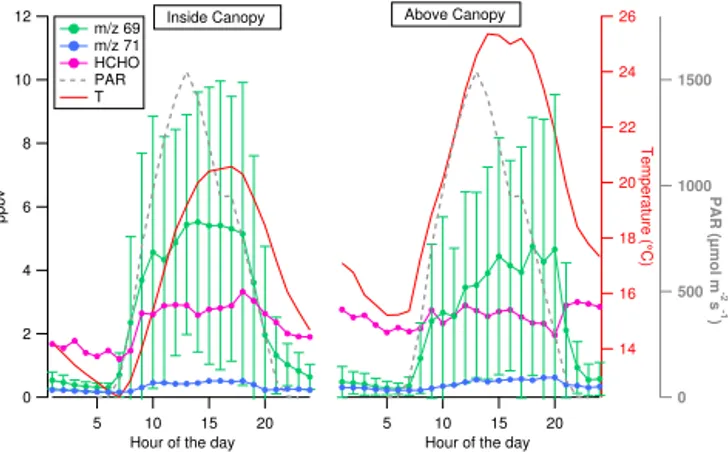
Figure 2.Daily mean ofm/z69,m/z71, HCHO (ppbv), temper-ature and PAR for days of measurements at 2 m (left panel) and at 10 m (right panel) of the field campaign. Bars onm/z69 correspond to±1σstandard deviation. PAR data were collected at 6 m for both cases. Temperature data were collected at 2 m and at 6.15 m.
3 Results
3.1 Trace gas mixing ratio
During the first campaign week we observed some peaks of contamination for about 1 h every morning due to emissions from car exhausts. Such data points were filtered from the data sets that will be discussed in this section.
Figures 2 and 3 illustrate diurnal profiles and time series ofm/z69, identified as isoprene, its main degradation prod-ucts m/z71, identified as MVK+MACR+ISOPOOH and here referred to as ISOP.OXs (isoprene oxidation products), and HCHO, together with meteorological parameters as air temperature and PAR, at both sampling heights. Figure 2 shows that these compounds have clear diurnal profiles; how-ever, while isoprene has similar profiles to PAR and tem-perature, its degradation products tend to increase after iso-prene increases, which confirms the main secondary origin of such species. Isoprene mean values peak when tempera-ture is highest: during the afternoon inside the canopy (14:00 CEST, left panel) and during the late afternoon above the canopy (20:00, right panel). The latter peak measured so late above the canopy is driven by the enhanced ambient tem-perature measured on 8 June 2014 (represented in Fig. 6). Formaldehyde mixing ratios are higher thanm/z71 for both heights; inside the canopy its profile is clearly diurnal, while above the canopy it looks more stable, mostly because of the higher nighttime level reached on 8 June 2014 (see Fig. 3).
20
10
0
m/z 69 (ppbv)
29/05/2014 01/06/2014 04/06/2014 07/06/2014 10/06/2014 13/06/2014
1.6 1.2 0.8 0.4 0.0
m/z 71 (ppbv)
6 4 2
HCHO (ppbv)
30 25 20 15 10
Temperature
(°C)
2000 1500 1000 500 0
PAR
(µmol m
-2
s
-1
)
1.6 1.2 0.8 0.4 0.0
ISOP.OXs/ isoprene
2m 10m
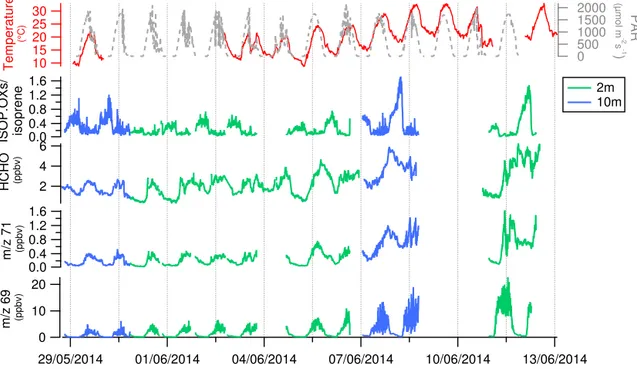
Figure 3.Time series ofm/z69 (isoprene),m/z71 (ISOP.OXs=MVK+MACR+ISOPOOH), HCHO and ISOP.OXs/isoprene during the field campaign at OHP. Data were collected inside the canopy (2 m, green line) and above the canopy (10m, blue line) on different days. Temperature and PAR measured at 6 m are reported as reference on the top panel.
12 8 4
m/z 33 (ppbv)
29/05/2014 31/05/2014 02/06/2014 04/06/2014 06/06/2014 08/06/2014 10/06/2014 12/06/2014
2.0 1.5 1.0 0.5
m/z 45 (ppbv)
1.5 1.0 0.5 0.0
m/z 137 (ppbv)
4.0 3.0 2.0
m/z 59 (ppbv)
0.6 0.4 0.2 0.0
m/z 73 (ppbv)
2 m 10 m
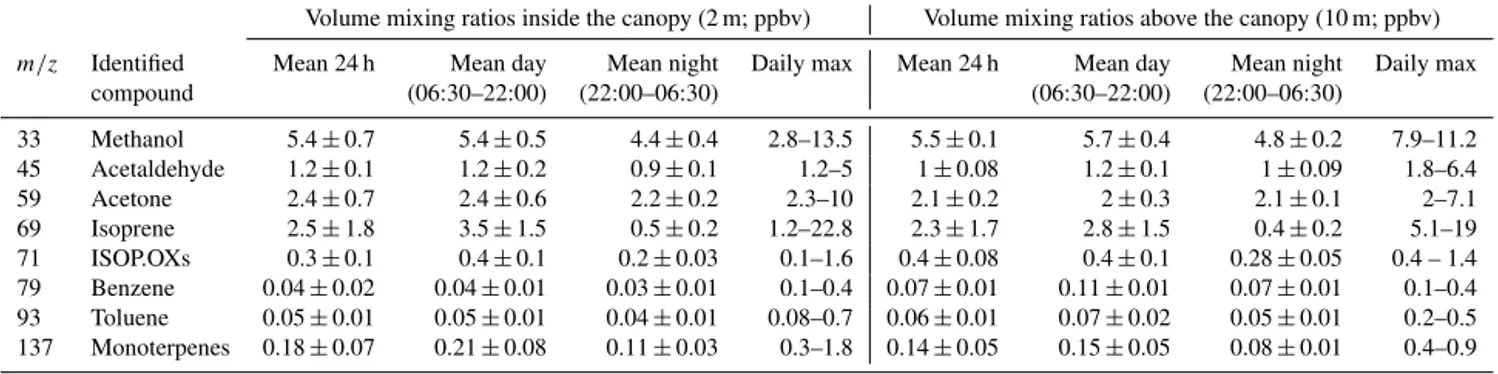
Table 3.Volume mixing ratios inside and above the canopy of targeted molecules sampled with the PTR-MS.
Volume mixing ratios inside the canopy (2 m; ppbv) Volume mixing ratios above the canopy (10 m; ppbv) m/z Identified Mean 24 h Mean day Mean night Daily max Mean 24 h Mean day Mean night Daily max
compound (06:30–22:00) (22:00–06:30) (06:30–22:00) (22:00–06:30)
33 Methanol 5.4±0.7 5.4±0.5 4.4±0.4 2.8–13.5 5.5±0.1 5.7±0.4 4.8±0.2 7.9–11.2 45 Acetaldehyde 1.2±0.1 1.2±0.2 0.9±0.1 1.2–5 1±0.08 1.2±0.1 1±0.09 1.8–6.4
59 Acetone 2.4±0.7 2.4±0.6 2.2±0.2 2.3–10 2.1±0.2 2±0.3 2.1±0.1 2–7.1
69 Isoprene 2.5±1.8 3.5±1.5 0.5±0.2 1.2–22.8 2.3±1.7 2.8±1.5 0.4±0.2 5.1–19 71 ISOP.OXs 0.3±0.1 0.4±0.1 0.2±0.03 0.1–1.6 0.4±0.08 0.4±0.1 0.28±0.05 0.4 – 1.4 79 Benzene 0.04±0.02 0.04±0.01 0.03±0.01 0.1–0.4 0.07±0.01 0.11±0.01 0.07±0.01 0.1–0.4 93 Toluene 0.05±0.01 0.05±0.01 0.04±0.01 0.08–0.7 0.06±0.01 0.07±0.02 0.05±0.01 0.2–0.5 137 Monoterpenes 0.18±0.07 0.21±0.08 0.11±0.03 0.3–1.8 0.14±0.05 0.15±0.05 0.08±0.01 0.4–0.9
collected between 7 and 12 June 2014 above and inside the canopy can be directly compared, based on similar condi-tions of temperature and solar radiation. Maximum values for isoprene inside and above the canopy are close (maximum at 10 m is 19 ppbv, maximum at 2 m is 23 ppbv) and small dif-ferences can be explained mainly on a dilution basis, a better mixing of air masses reached above the canopy height due to the sparse canopy structure. Interestingly, high levels of
m/z71 and HCHO were recorded during the nights between 7 and 8 and between 11 and 12 June. Such high nighttime concentrations are also observed for other chemical species (see text below). Figure 4 illustrates time series for masses
m/z33,m/z45,m/z59,m/z73 andm/z137, identified, re-spectively, as methanol, acetaldehyde, acetone, methyl ethyl ketone and sum of monoterpenes. Monoterpenes are primary emitted biogenic compounds while the other species can have both primary and secondary origins (Jacob et al., 2002, 2005; Millet et al., 2010). Methanol has a daily maximum of 14 ppbv (inside the canopy), which makes it the second most abundant compound measured at OHP after isoprene (daily max inside the canopy 23 ppbv), followed by acetone, ac-etaldehyde, monoterpenes, ISOP.OXs, toluene and benzene, in order of abundance (Table 3). Over 24 h, methanol is in-stead the first most abundant compound at OHP, followed by isoprene, acetone and acetaldehyde. Both methanol and isoprene have a diurnal profile, but methanol has a longer lifetime compared to isoprene (estimated to be 12 days and 1.4 h, respectively; see Atkinson and Arey, 2003); therefore over 24 h the former shows less variability in the atmosphere. During the two nights mentioned above (8 and 12 June) the concentration of the oxygenated compounds was higher compared to the other nights. More discussion on this behav-ior is provided in Sect. 3.4.
Anthropogenic hydrocarbons mixing ratios in the frac-tion C2–C6 were individually below 1.5 ppbv, with ethane being the most abundant (mean over the cam-paign=0.9±0.2 ppbv), followed by acetylene, ethylene and isopentane. Anthropogenic tracers measured by PTR-MS showed the same trend and confirmed the poor an-thropogenic influence at this forested site: benzene max-imum was 0.41 ppbv, the mean over 24 h was 0.04 ppbv,
toluene was maximum 0.69 ppbv and its mean over 24 h was 0.05 ppbv. Concentrations of NO and NO2were maximum
1.7 and 5 ppbv with a mean value of 0.45±0.38 ppbv and 3.4±0.49 ppbv during the whole campaign, respectively. Ozone concentration ranged within 21–78 ppbv, with a mean value of 47±10 ppbv. The highest values of ozone, often ob-served in the afternoon, are due to regional transport from air masses impacted by anthropogenic emissions (usually from the area of Marseille). Therefore the site can be, depending on air mass origin, regionally influenced by anthropogenic plumes. Nevertheless, the low levels of anthropogenic pri-mary compounds suggest that this anthropogenic contribu-tion is low. Addicontribu-tionally, we noticed that during the campaign the dominant wind direction was from north; hence the site was mostly exposed to the influence of the oak forest.
Values discussed herein can be compared to values mea-sured during the field work conducted at OHP during spring 2012 (compare Table 3 in this work with Table 2 in Kalo-gridis et al., 2014). Both field works were conducted during the same season (late spring, beginning of June), with the site exposed to slightly different temperature levels (daily max-imum in 2012 30◦C, daily maximum in 2014 31.5◦C), but the sampling was performed in different portions of the for-est, with a distance between each other of a few hundreds of meters. It is interesting to notice that atmospheric levels of VOCs are close only for anthropogenic species while all bio-genic species and oxygenated compounds have almost dou-bled from 2012 to 2014. The same isoprene–temperature de-pendence was achieved during the two experimental works, which demonstrates that the higher mean concentration of biogenic compounds observed in 2014 was probably due to the higher mean temperature during the second campaign.
3.2 Total OH reactivity
80
60
40
20
0
OH reactivity (s
-1 )
00:00 11/06/2014
06:00 12:00 18:00 00:00
12/06/2014
06:00 12:00
2000
1500
1000
500
0
PAR (µmol m
-2
s
-1
)
30
20
10
Temperature (°C)
100 80 60 40 20
RH (%)
OH reactivity_calculated OH reactivity_measured Inside Canopy
Figure 5.Total OH reactivity measured (black line and markers) with the comparative reactivity method (CRM) and calculated OH reactivity from measured concentrations of trace gases (green line) on the left axes, photosynthetical active radiation on the right axes (gray dashed line) and temperature and relative humidity on the left and right upper axes (red and blue lines). Data points represent 30 min averages of the sampled data and error bars correspond to 35 and 25 % (1σ )instrumental uncertainties. Data refer to air sampled inside the canopy at 2 m height.
70
60
50
40
30
20
10
0
OH reactivity (s
-1 )
00:00 07/06/2014
12:00 00:00
08/06/2014
12:00
2000
1500
1000
500
0
PAR (µmol m
-2
s
-1
)
100
80
60
40
20
RH (%)
35 30 25 20 15 10
Temperature (°C)
OH reactivity_calculated OH reactivity_measured
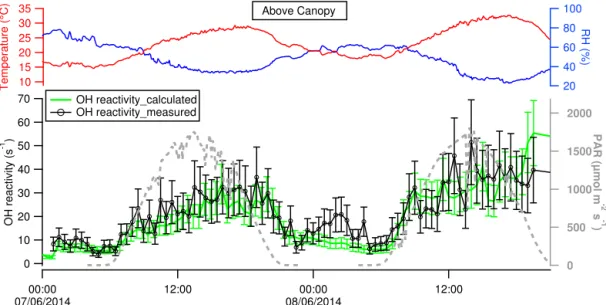
Above Canopy
Figure 6.Total OH reactivity measured (black line and markers) and OH reactivity calculated (green line) above the canopy at 10 m height. Temperature (red line), RH (blue line) and PAR (gray dashed line) are reported for reference. Data points represent 30 min averages over the data collected. Uncertainties correspond to 35 and 25 % for the measured and calculated reactivity, respectively (1σ ).
and a maximum of 68 s−1and was on average 24±14 s−1. OH reactivity had the same trend of temperature and PAR, with a diurnal profile that demonstrates its dependency on the emission and profile of biogenic compounds emitted by the forest, released when sunrise started and temperature creased. During 11 June 2014, OH reactivity started to in-crease at 6:00 when the sun rose and reached a maximum around 10:30 and again around 16:00, associated with more
to enhanced ambient temperature during the late afternoon on both sampling days. On 7 June 2014 it started to increase at 06:30, had its maximum around 18:00 and decreased at 21:30. On 8 June 2014 it increased at 06:30 and reached its maximum at 14:15.
3.3 Measured and calculated OH reactivity
We compared the total OH reactivity measured with the CRM instrument with the one calculated from the concentra-tions of the measured trace gases and their rate coefficients with OH. Table 1 illustrates the classes and species measured by ancillary methods deployed on the field and used to com-pute their relative contribution to the OH reactivity. It has to be noted that due to instrument availability and the rela-tive homogeneity of species emitted by the forest, only a few primary emitted compounds and main atmospheric species were measured and used to calculate the OH reactivity. For methane and carbon monoxide we derived a mean value from measurements run in 2012: 1900 and 180 ppbv, respectively. The OH reactivity given by the oxidation products of iso-prene (ISOP.OXs) was calculated from their measured total concentration and the mean rate coefficient of the reaction of MVK and MACR with OH. Since we did not separate the dif-ferent ISOP.OXs, we could not determine the exact fraction of MVK and MACR contributing to the OH reactivity, which leads to a slight overestimation of the calculated reactivity (Rivera-Rios et al., 2014); in our case such overestimation is not significant due to the higher abundance of isoprene.
The calculated OH reactivity was between 5 and 58 s−1
and on average 24±19 s−1between 11 and 12 June 2014 at
2 m inside the canopy. At 10 m, above the canopy height, it varied between 3 and 55 s−1, being on average 19±12 s−1.
Figures 5 and 6 show the covariation between measured (black line) and calculated (green line) OH reactivity during 11–12 June 2014 at 2 m and during 7–8 June 2014 at 10 m, with associated error bars (35 % for the measured reactivity and 25 % for the calculated reactivity, 1σ ).
For both time series, during daytime, inside and above the canopy height, the measured OH reactivity agreed very well with the calculated one within the instrumental uncertainties. Since there was not a significant difference between the two values we can conclude that no significant missing reactiv-ity was observed in this specific ecosystem in the Mediter-ranean basin during our measurement campaign. In addition, the precise characterization of the composition of air even at 10 m height corroborates the weak oxidation of primary compounds within the canopy (Kalogridis et al., 2014).
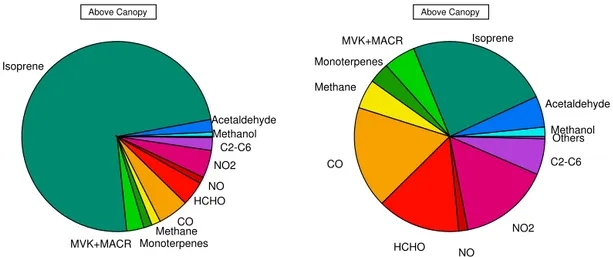
Simultaneous ancillary measurements of trace gases per-mit to resolve the total OH reactivity into the relative con-tributions of the individual species. Figures 7 and 8 show the breakdown of reactive components in OH reactivity dur-ing daytime and nighttime at the two heights considered. In all cases the dominant reactive species was isoprene. Iso-prene is among the most reactive compounds towards OH,
the most abundant compound in this forest and nearly the only compound emitted by downy oak trees, which consti-tute the majority of tree species accounted for in this ecosys-tem. Hence, we expected its large contribution to the reac-tivity. At 2 m, isoprene represented from 28 to 83 % of the total OH reactivity during nighttime (total mean 6 s−1)and daytime (total mean 29 s−1), respectively. At 10 m, it consti-tuted from 24 % during nighttime to 74 % during daytime of the total reactivity (total means 6 and 20 s−1, respectively). The impact of isoprene on OH reactivity between the two heights of sampling differs by only 9 %. When we consider that at 2 m the data of alkanes+alkenes are missing and sim-ilar air temperature was measured at the two heights (30◦C temperature maximum at 2 m and 32◦C maximum at 10 m), we can conclude that no substantial difference in the atmo-spheric composition in terms of reactive gases existed be-tween the two heights of sampling. Inside the canopy dur-ing daytime, all the measured species apart from isoprene contributed in total about 17 % to the OH reactivity. Car-bon monoxide, HCHO and NO2were the second most
im-portant species, accounting for 3 % each, followed by ac-etaldehyde, MVK+MACR and monoterpenes with 2 % each and all the other compounds with less. During nighttime, the concentration of isoprene reduced to a few pptv and other species such as CO and methane which are more sta-ble in the atmosphere became more important, contributing to 16 and 5 %, respectively. Formaldehyde, NO2,
acetalde-hyde, MVK+MACR and monoterpenes represented, respec-tively, 11, 16, 8, 5 and 4 %. Above the canopy during day-time the second most reactive species were CO, NO2, HCHO
and MVK+MACR (5, 5, 4 and 3 %). Above the canopy but during nighttime, CO, NO2, HCHO, alkanes+alkenes,
MVK+MACR, methane and acetaldehyde weighted, respec-tively, 17, 15, 14, 6, 5, 5 and 5 %. Monoterpenes weighted about 2–1 % during daytime and 4 % during the night in both cases. Monoterpenes are also very reactive BVOCs towards OH; when present in the atmosphere they can compete with isoprene in terms of reactivity. At OHP, monoterpenes mix-ing ratios were low (see Table 3); they did not constitute a major class of compounds in the area and by consequence their contribution to the OH reactivity was poor.
3.4 Nighttime missing reactivity
com-Methanol Acetaldehyde Isoprene
MVK+MACR Monoterpenes Methane
CO HCHO
NO NO2
Inside Canopy
Methanol Acetaldehyde Isoprene
MVK+MACR Monoterpenes
Methane
CO
HCHO NO NO2
Inside Canopy
C2-C6
Figure 7.The components of OH reactivity inside the canopy (2 m height) during daytime (left pie chart) and during nighttime (right pie chart). Data refer to air masses sampled at OHP during 11–12 June 2014. Total OH reactivity was 29 s−1(daytime mean value) and 6 s−1 (nighttime mean value). All compounds reported in Table 1 were used to calculate their relative contributions. C2–C6 refers to alkanes and alkenes in the fraction C2–C6.
Methanol Acetaldehyde Isoprene
MVK+MACR Monoterpenes Methane CO
HCHO NO NO2 Above Canopy
C2-C6
Methanol Acetaldehyde Isoprene
MVK+MACR
Monoterpenes
Methane
CO
HCHO NO
NO2 Above Canopy
C2-C6 Others
Figure 8.The components of OH reactivity above the canopy (10 m height) during daytime (left pie chart) and during nighttime (right pie chart). Data refer to air masses sampled at OHP during 7–8 June 2014. Total OH reactivity was 20 s−1(daytime mean value) and 6 s−1 (nighttime mean value). All compounds reported in Table 1 were used to calculate their relative contributions. C2–C6 refers to alkanes and alkenes in the fraction C2–C6. Others refer to the sum of the contributions of: acetonitrile, acetone, MEK, benzene and toluene.
80
60
40
20
0
OH reactivity (s
-1)
ozone (ppbv)
00:00 11/06/2014
06:00 12:00 18:00 00:00
12/06/2014 06:00
3.0
2.5
2.0
1.5
1.0
0.5
0.0
ISOP.OXs/isoprene
Ozone Total OH reactivity Calculated OH reactivity
ISOP.OXs/isoprene Inside Canopy
Figure 9. Total OH reactivity, calculated reactivity and ISOP.OXs/isoprene ratio at 2 m height. Ozone data were ac-quired a few hundred meters away from the sampling area.
parable to values of total OH reactivity measured in boreal and temperate forests (Sinha et al., 2010; Ren et al., 2006).
80
60
40
20
0
OH reactivity (s
-1)
ozone (ppbv)
00:00
07/06/2014 06:00 12:00 18:00 08/06/201400:00 06:00 12:00 18:00
3.0
2.5
2.0
1.5
1.0
0.5
0.0
ISOP.OXs/isoprene
10 8 6 4 2 0
Wind speed
(m/s)
300 200 100 0
Wind
direction (°)
ISOP.OXs/isoprene Ozone
Total OH reactivity Calculated OH reactivity
Above Canopy
Figure 10. Total OH reactivity, calculated reactivity and ISOP.OXs/isoprene ratio at 10 m height. Ozone data were acquired a few hundred meters away from the sampling area. The upper panel shows wind direction and wind speed data.
ISOP.OXs/isoprene ratio observed. Indeed, higher variabil-ity was observed on short timescale for isoprene compared to ISOP.OXs (0.9 and 0.5, respectively, relative standard deviation over the mean value during 7 June 2014). The ISOP.OXs/isoprene ratio had the same magnitude and trend for both missing reactivity events and reached a maximum during these two specific nights compared to the rest of the campaign period (Fig. 3). Interestingly, ISOP.OXs/isoprene increases when ozone decreases, especially for measure-ments at 10 m (Figs. 9 and 10). Profiles of other measured OVOCs (m/z45,m/z59,m/z73; Fig. 4) show higher con-centrations around midnight of both nights, suggesting an ac-cumulation of oxygenated compounds and an intense night-time chemistry. Indeed, meteorological parameters such as wind speed and wind direction for data collected at 10 m help to show that the wind blew from the same direction with low speed during the night between 7 and 8 June 2014, suggest-ing more stable meteorological conditions which could have favored nighttime chemistry (Fig. 10). Daytime air temper-ature on these 2 days was also the highest registered over the whole measurement campaign (Fig. 3). During nighttime, the atmospheric boundary layer is shallower, producing two main effects evident in Figs. 9 and 10: on one hand, it fa-vors ozone deposition on leaves surface, which could be the main reason of the observed decrease of ozone concentration; on the other hand, it concentrates the atmospheric species present in ambient air, resulting in higher concentration of the compounds more stable in the atmosphere.
Several evidences make us believe that the production of OVOCs was linked to the oxidation of biogenic molecules. Firstly, common anthropogenic tracers such as acetonitrile and benzene did not show any particular increase during these events, supporting the idea that such nighttime higher concentrations of oxidized compounds in the atmosphere were associated with local drivers rather than transport. Sec-ondly, we observed an increase in atmospheric levels of some masses measured by the PTR-MS and not used before to cal-culate the OH reactivity, such as m/z47, m/z61,m/z75,
80 60
40 20
0
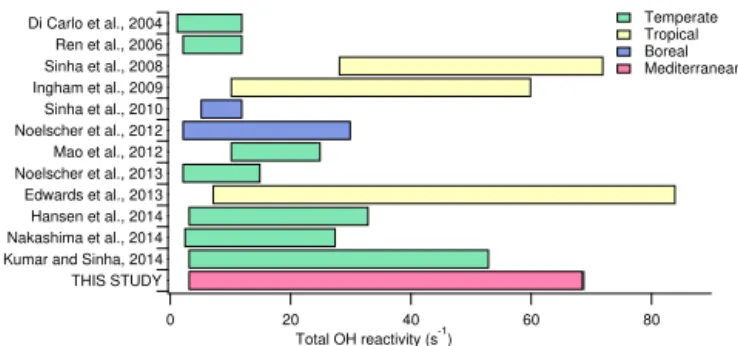
Total OH reactivity (s-1)
Di Carlo et al., 2004 Ren et al., 2006 Sinha et al., 2008 Ingham et al., 2009 Sinha et al., 2010 Noelscher et al., 2012 Mao et al., 2012 Noelscher et al., 2013 Edwards et al., 2013 Hansen et al., 2014 Nakashima et al., 2014 Kumar and Sinha, 2014 THIS STUDY
Temperate Tropical Boreal Mediterranean
Figure 11.Total OH reactivity results from all the published ex-periments conducted worldwide at forested sites. Bars refer to the ranges observed between the minimum (often corresponding to the instrumental LoD) and the maximum values published. Stud-ies were all conducted during spring/summertime. This study and those from Sinha and Noelscher adopted the comparative reactiv-ity method; di Carlo, Ren, Mao, Ingham, Edwards and Hansen used a total OH loss rate measurement based on laser-induced fluores-cence; Nakashima deployed a laser-induced fluorescence pump and probe technique (see references for instrumental details).
m/z83,m/z87 andm/z101. According to the existing lit-erature, these protonated masses can be identified as oxi-dation products resulting from the degraoxi-dation of isoprene and associated, respectively, with formic acid, acetic acid, hydroxyacetone, 3-methylfuran and other unsaturated C5, methacrylic acid and isoprene hydroperoxides (Warneke et al., 2001; Holzinger et al., 2002). We estimated roughly the contribution of such species to the calculated OH reactivity and found out that only a small fraction of the missing OH reactivity could be explained. Therefore there must be other unmeasured species that were formed locally, very likely OVOCs that were present during those nights.
Gas phase chemistry during nighttime is usually initiated by ozone and the nitrate radical. The low levels of NOx observed at the site (nighttime NO was maximum 0.8 ppbv and on average 0.14±0.13 ppbv) indicate that nitrate chem-istry is not a probable source of such oxidized compounds; however, ozone isoprene chemistry is slow and cannot alone explain their production in the gas phase (isoprene lifetime with nitrate is 1.6 h while with ozone is calculated to be 1.3 days; Atkinson and Arey, 2003). If the unmeasured OVOCs were neither generated exclusively from isoprene nor had an-thropogenic precursors, we speculate that these unmeasured OVOCs must have been a combination of higher-generation products derived from isoprene oxidation and OVOCs, re-sulting from reactive primary biogenic precursors, other than isoprene, and more reactive towards ozone. We can expect that these biogenic precursors were larger molecules that could not be measured by our instrumentation.
to be emitted approximately 6–30 times more than the emis-sion of the observed monoterpenes above his forest. Karl et al. (2005) have identified the same oxygenated compounds for different pine species and speculated their production at the leaf level rather than in the gas phase. Recent experiments on leaves of tobacco plants have identified the unsaturated semivolatile compounds undergoing reactions on the leaves surface (Jud et al., 2016). Those compounds once deposited on the leaves quickly undergo surface oxidation reactions with ozone releasing volatile products into the gas phase. Ox-idation reactions are favored by higher ambient RH and high ozone levels, and they can also occur when leaves stomata are closed. Measuring the species initiating these surface re-actions is extremely difficult with the instruments we had on the field, and therefore we do not have more clues to sup-port this hypothesis or exclude it has occurred in the forest of OHP. Focused studies on the leaves of downy oak trees with branch enclosure techniques would be of help to elucidate it.
3.5 OH reactivity at other biogenic sites
Our results of reactivity from OHP constitute the first data set of total OH reactivity measured in a Mediterranean for-est. Nevertheless, several observations to study the emis-sions from different plant species and their evolution due to natural factors such as light and air temperature in other forested sites exist to date. OH reactivity observations have been of great help over the years to elucidate the presence of unknown compounds and to eventually assess BVOCs oxidation patterns which had not before been characterized (Nakashima et al., 2012; Nölscher et al., 2014). In addition, biogenic species constitute a class of compounds with the highest reactivity towards the hydroxyl radical. OH reactiv-ity during springtime and summertime in forests is usually higher than in metropolitan areas which are often polluted by less reactive hydrocarbons.
Figure 11 illustrates all the existing studies of OH reac-tivity conducted in biogenic environments with their corre-sponding references. Colored bars show the range of reactiv-ity measured at the site, while colors refer to different types of climatic zones to which the studied forests belong. The reader should note that not all the studies were carried out using the same method (see figure caption for more details). The forest at OHP is among the investigated biogenic sites producing the highest OH reactivity worldwide. The only two sites where a higher reactivity was reached is the tropical rainforest of Borneo (Edwards et al., 2013), where a max-imum of 84 s−1 was reported and the tropical rainforest of
Suriname with a maximum of 72 s−1 (Sinha et al., 2008). Tropical forests are usually more heterogeneous in plants species and BVOCs emission patterns compared to the forest at OHP, which is also particularly homogeneous compared to other Mediterranean forests. In Borneo, the dominant pri-mary species to the OH reactivity was also isoprene (relative contribution of 36.8 %), but terpenes made up 7 % and the
largest portion of reactivity was attributed to the oxidation products of BVOCs and products intermediates (47.1 %). In conclusion, on one hand the intense temperature and solar radiation result in similar emission strength and reactivity, while on the other hand biodiversity and canopy structure draw the major differences between the two sites. Indeed, the forest at OHP, besides being homogeneous, is shorter and sparser compared to tropical forests; such structure allows a better mixing of the air masses and a faster transport of the primary species to the atmosphere.
By comparison, the investigated mixed temperate forests and boreal forests produced lower OH reactivity, which can also be attributed to the lower temperature and less intense solar radiation leading to weaker emissions from the local canopies.
4 Summary and conclusion
During late spring 2014 at the downy oaks forest of the site Observatoire de Haute Provence we found that the total OH reactivity was maximum 69 s−1 at 2 m (inside the canopy) and 68 s−1 at 10 m (above the canopy). Interestingly, dur-ing daytime, the measured OH reactivity at both heights was in good agreement, within the measurements uncertainties, with the calculated OH reactivity obtained from the suite of measurements of trace gases concentration available during our field experiment. Hence, we did not observe any missing OH reactivity either inside or above the forest.
In addition, considering the homogeneity of the forest and strong reactivity of isoprene, we expected isoprene to be the species contributing the most to the OH reactivity, at least for measurements at 2 m high. We found indeed that inside the canopy during daytime, isoprene contributed to the OH reactivity at 83 %, followed by CO, NO2and HCHO. Above
the canopy height, isoprene made up to 74 %, followed by CO, NO2, HCHO and MVK+MACR. Such results indicate
that there was not a significant difference in the speciation in-side and above the canopy. During nighttime, when isoprene emissions stopped and atmospheric concentrations were a few pptv, long-lived species such as CO and methane con-tributed to about 16–17 and 5 % for both inside and above the canopy. Still, even by night, isoprene accounted for the largest portion of OH reactivity.
The low levels of isoprene oxidation products observed during the day indicate that the intracanopy oxidation is low, and almost all the isoprene emitted by the canopy is trans-ported to the atmosphere, which confirms the previous ex-perimental work on isoprene fluxes conducted during spring 2012. The fact that no missing OH reactivity was observed, especially above the canopy, additionally corroborates the fact that no significant unmeasured compound, the product of the oxidation of isoprene, was present.
to-tal OH reactivity we measured was significantly higher com-pared to the calculated OH reactivity. Such missing reactiv-ity accounted for more than 50 % and can be explained by locally produced unmeasured oxidation products. We specu-late that unmeasured OVOCs represent a mixture of species including higher-generation products resulting from isoprene oxidation and products of the reaction between reactive bio-genic precursors and ozone.
Our work represents the first data set to date of total OH reactivity measured in a Mediterranean forest. In a world-wide perspective, the investigated forest of downy oaks at OHP produces an OH reactivity among the highest measured. Remarkably, only tropical forests showed to be as reactive as OHP. Lower OH reactivity was measured in boreal and mixed temperate forests due to the lower temperature and solar radiation and possibly to the more heterogeneous-like forests (i.e., less abundance of isoprene).
The Mediterranean region is rich in biodiversity, and bio-genic activity is enhanced by its characteristic climate. Out of 2 million km2of surface only about 100 000 km2remains undisturbed by human activity. We expect, therefore, that OH reactivity in the Mediterranean can vary significantly de-pending on the type of vegetation and its extension and inter-action with pollutants derived by human activity. In addition, the Mediterranean is a hotspot for climate change. This issue will certainly impact the biogenic emission strength and pat-tern, which will influence the total OH reactivity. With our work we would like to stimulate interest in studying the OH reactivity and BVOC levels at diverse biogenic sources in the Mediterranean area for extensive periods.
The Supplement related to this article is available online at doi:10.5194/acp-16-1619-2016-supplement.
Acknowledgements. This study was supported by European Commission’s 7th Framework Programme under grant agreement number 287382 “PIMMS”, ANR-CANOPEE and ChArMEx, CEA and CNRS. We would like to thank N. Bonnaire for his work on the GC-MS analysis. We acknowledge J. P. Orts, I. Reiter, the staff at O3HP and at Gerard Megie, INERIS, for logistical help. We thank F. Dulac and E. Hamonou for managing the ChArMEx project. We are thankful to Sabina Assan for helping with the English revision of the manuscript and to the two anonymous reviewers for their useful comments and suggestions.
Edited by: J. Rinne
References
Atkinson, R.: Kinetics and mechanisms of the gas-phase re-actions of the hydroxyl radical with organic compounds
under atmospheric conditions, Chem. Rev., 86, 69–201, doi:10.1021/cr00071a004, 1986.
Atkinson, R.: Atmospheric chemistry of VOCs and NOx, Atmos. Environ., 34, 2063–2101, doi:10.1016/S1352-2310(99)00460-4, 2000.
Atkinson, R. and Arey, J.: Atmospheric Chemistry of Bio-genic Organic Compounds, Acc. Chem. Res., 31, 574–583, doi:10.1021/ar970143z, 1998.
Atkinson, R. and Arey, J.: Gas-phase tropospheric chemistry of bio-genic volatile organic compounds: a review, Atmos. Environ., 37, 197–219, doi:10.1016/S1352-2310(03)00391-1, 2003.
Atkinson, R., Aschmann, S. M., Winer, A. M., and Carter, W. P. L.: Rate constants for the gas phase reactions of OH radicals and O3 with pyrrole at 295±1 K and atmospheric pressure, Atmos. Environ., 18, 2105–2107, doi:10.1016/0004-6981(84)90196-3, 1984.
Atkinson, R., Baulch, D. L., Cox, R. A., Jr, R. F. H., Kerr, J. A., Rossi, M. J., and Troe, J.: Evaluated Kinetic and Photo-chemical Data for Atmospheric Chemistry: Supplement VI. IU-PAC Subcommittee on Gas Kinetic Data Evaluation for Atmo-spheric Chemistry, J. Phys. Chem. Ref. Data, 26, 1329–1499, doi:10.1063/1.556010, 1997.
Baghi, R., Durand, P., Jambert, C., Jarnot, C., Delon, C., Serça, D., Striebig, N., Ferlicoq, M., and Keravec, P.: A new disjunct eddy-covariance system for BVOC flux measurements – valida-tion on CO2and H2O fluxes, Atmos. Meas. Tech., 5, 3119–3132, doi:10.5194/amt-5-3119-2012, 2012.
Bonsang, B., Polle, C., and Lambert, G.: Evidence for marine production of isoprene, Geophys. Res. Lett., 19, 1129–1132, doi:10.1029/92GL00083, 1992.
Carlo, P. D., Brune, W. H., Martinez, M., Harder, H., Lesher, R., Ren, X., Thornberry, T., Carroll, M. A., Young, V., Shepson, P. B., Riemer, D., Apel, E., and Campbell, C.: Missing OH Reactiv-ity in a Forest: Evidence for Unknown Reactive Biogenic VOCs, Science, 304, 722–725, doi:10.1126/science.1094392, 2004. Claeys, M., Graham, B., Vas, G., Wang, W., Vermeylen, R.,
Pashyn-ska, V., Cafmeyer, J., Guyon, P., Andreae, M. O., Artaxo, P., and Maenhaut, W.: Formation of Secondary Organic Aerosols Through Photooxidation of Isoprene, Science, 303, 1173–1176, doi:10.1126/science.1092805, 2004.
Dasgupta, P. K., Dong, S., Hwang, H., Yang, H.-C., and Genfa, Z.: Continuous liquid-phase fluorometry coupled to a diffu-sion scrubber for the real-time determination of atmospheric formaldehyde, hydrogen peroxide and sulfur dioxide, At-mos. Environ., 22, 949–963, doi:10.1016/0004-6981(88)90273-9, 1988.
De Gouw, J. and Warneke, C.: Measurements of volatile organic compounds in the earth’s atmosphere using proton-transfer-reaction mass spectrometry, Mass Spectrom. Rev., 26, 223–257, doi:10.1002/mas.20119, 2007.
Dillon, T. J., Tucceri, M. E., Dulitz, K., Horowitz, A., Vereecken, L., and Crowley, J. N.: Reaction of Hydroxyl Radicals with C4H5N (Pyrrole): Temperature and Pressure Depen-dent Rate Coefficients, J. Phys. Chem. A, 116, 6051–6058, doi:10.1021/jp211241x, 2012.
Pho-tochemical Processes (OP3) project, Atmos. Chem. Phys., 13, 9497–9514, doi:10.5194/acp-13-9497-2013, 2013.
Fuentes, J. D., Gu, L., Lerdau, M., Atkinson, R., Baldocchi, D., Bottenheim, J. W., Ciccioli, P., Lamb, B., Geron, C., Guenther, A., Sharkey, T. D., and Stockwell, W.: Biogenic Hydrocarbons in the Atmospheric Boundary Layer: A Review, B. Am. Me-teorol. Soc., 81, 1537–1575, doi:10.1175/1520-0477(2000)081< 1537:BHITAB> 2.3.CO;2, 2000.
Genard-Zielinski, A.-C., Boissard, C., Fernandez, C., Kalogridis, C., Lathière, J., Gros, V., Bonnaire, N., and Ormeño, E.: Vari-ability of BVOC emissions from a Mediterranean mixed forest in southern France with a focus on Quercus pubescens, Atmos. Chem. Phys., 15, 431–446, doi:10.5194/acp-15-431-2015, 2015. Giorgi, F.: Climate change hot-spots, Geophys. Res. Lett., 33,
L08707, doi:10.1029/2006GL025734, 2006.
Giorgi, F. and Lionello, P.: Climate change projections for the Mediterranean region, Glob. Planet. Change, 63, 90–104, doi:10.1016/j.gloplacha.2007.09.005, 2008.
Giorgi, F., Im, E.-S., Coppola, E., Diffenbaugh, N. S., Gao, X. J., Mariotti, L., and Shi, Y.: Higher Hydroclimatic In-tensity with Global Warming, J. Clim., 24, 5309–5324, doi:10.1175/2011JCLI3979.1, 2011.
Guenther, A., Hewitt, C. N., Erickson, D., Fall, R., Geron, C., Graedel, T., Harley, P., Klinger, L., Lerdau, M., Mckay, W. A., Pierce, T., Scholes, B., Steinbrecher, R., Tallamraju, R., Taylor, J., and Zimmerman, P.: A global model of natural volatile organic compound emissions, J. Geophys. Res.-Atmos., 100, 8873–8892, doi:10.1029/94JD02950, 1995.
Guenther, A., Karl, T., Harley, P., Wiedinmyer, C., Palmer, P. I., and Geron, C.: Estimates of global terrestrial isoprene emissions using MEGAN (Model of Emissions of Gases and Aerosols from Nature), A tmos. Chem. Phys., 6, 3181–3210, doi:10.5194/acp-6-3181-2006, 2006.
Hansen, R. F., Griffith, S. M., Dusanter, S., Rickly, P. S., Stevens, P. S., Bertman, S. B., Carroll, M. A., Erickson, M. H., Flynn, J. H., Grossberg, N., Jobson, B. T., Lefer, B. L., and Wallace, H. W.: Measurements of total hydroxyl radical reactivity during CABINEX 2009 – Part 1: field measurements, Atmos. Chem. Phys., 14, 2923–2937, doi:10.5194/acp-14-2923-2014, 2014. Hirsch, A. I., Munger, J. W., Jacob, D. J., Horowitz, L. W., and
Goldstein, A. H.: Seasonal variation of the ozone production ef-ficiency per unit NOx at Harvard Forest, Massachusetts, J. Geo-phys. Res.-Atmos., 101, 12659–12666, doi:10.1029/96JD00557, 1996.
Holzinger, R., Sanhueza, E., von Kuhlmann, R., Kleiss, B., Donoso, L., and Crutzen, P. J.: Diurnal cycles and seasonal variation of isoprene and its oxidation products in the trop-ical savanna atmosphere, Global Biogeochem. Cy., 16, 1074, doi:10.1029/2001GB001421, 2002.
Holzinger, R., Lee, A., Paw, K. T., and Goldstein, U. A. H.: Ob-servations of oxidation products above a forest imply biogenic emissions of very reactive compounds, Atmos. Chem. Phys., 5, 67–75, doi:10.5194/acp-5-67-2005, 2005.
Ingham, T., Goddard, A., Whalley, L. K., Furneaux, K. L., Edwards, P. M., Seal, C. P., Self, D. E., Johnson, G. P., Read, K. A., Lee, J. D., and Heard, D. E.: A flow-tube based laser-induced fluo-rescence instrument to measure OH reactivity in the troposphere, Atmos. Meas. Tech., 2, 465–477, doi:10.5194/amt-2-465-2009, 2009.
Jacob, D. J., Field, B. D., Jin, E. M., Bey, I., Li, Q., Lo-gan, J. A., Yantosca, R. M., and Singh, H. B.: Atmo-spheric budget of acetone, J. Geophys. Res.-Atmos., 107, 5–1, doi:10.1029/2001JD000694, 2002.
Jacob, D. J., Field, B. D., Li, Q., Blake, D. R., de Gouw, J., Warneke, C., Hansel, A., Wisthaler, A., Singh, H. B., and Guen-ther, A.: Global budget of methanol: Constraints from atmo-spheric observations, J. Geophys. Res.-Atmos., 110, D08303, doi:10.1029/2004JD005172, 2005.
Jenkin, M. E., Boyd, A. A., and Lesclaux, R.: Peroxy Radical Kinet-ics Resulting from the OH-Initiated Oxidation of 1,3-Butadiene, 2,3-Dimethyl-1,3-Butadiene and Isoprene, J. Atmos, Chem., 29, 267–298, doi:10.1023/A:1005940332441, 1998.
Jud, W., Fischer, L., Canaval, E., Wohlfahrt, G., Tissier, A., and Hansel, A.: Plant surface reactions: an opportunistic ozone defence mechanism impacting atmospheric chemistry, Atmos. Chem. Phys., 16, 277–292, doi:10.5194/acp-16-277-2016, 2016. Kalogridis, C., Gros, V., Sarda-Esteve, R., Langford, B., Loubet, B., Bonsang, B., Bonnaire, N., Nemitz, E., Genard, A.-C., Boissard, C., Fernandez, C., Ormeño, E., Baisnêe, D., Reiter, I., and Lath-ière, J.: Concentrations and fluxes of isoprene and oxygenated VOCs at a French Mediterranean oak forest, Atmos. Chem. Phys., 14, 10085–10102, doi:10.5194/acp-14-10085-2014, 2014. Karl, T., Harley, P., Guenther, A., Rasmussen, R., Baker, B., Jardine, K., and Nemitz, E.: The bi-directional exchange of oxygenated VOCs between a loblolly pine (Pinus taeda) plantation and the at-mosphere, Atmos. Chem. Phys., 5, 3015–3031, doi:10.5194/acp-5-3015-2005, 2005.
Karl, T., Guenther, A., Yokelson, R. J., Greenberg, J., Potosnak, M., Blake, D. R., and Artaxo, P.: The tropical forest and fire emissions experiment: Emission, chemistry, and transport of biogenic volatile organic compounds in the lower atmo-sphere over Amazonia, J. Geophys. Res.-Atmos., 112, D18302, doi:10.1029/2007JD008539, 2007.
Kesselmeier, J. and Staudt, M.: Biogenic Volatile Organic Compounds (VOC): An Overview on Emission, Physi-ology and EcPhysi-ology, J. Atmospheric Chem., 33, 23–88, doi:10.1023/A:1006127516791, 1999.
Kesselmeier, J., Bode, K., Schäfer, L., Schebeske, G., Wolf, A., Brancaleoni, E., Cecinato, A., Ciccioli, P., Frattoni, M., Dutaur, L., Fugit, J. L., Simon, V., and Torres, L.: Simultaneous field measurements of terpene and isoprene emissions from two dom-inant mediterranean oak species in relation to a North American species, Atmos. Environ., 32, 1947–1953, doi:10.1016/S1352-2310(97)00500-1, 1998.
Kumar V. and Sinha V.: VOC–OHM: A new technique for rapid measurements of ambient total OH reactivity and volatile organic compounds using a single proton transfer reaction mass spectrometer, Int. J. Mass Spectrom., 374, 55–63, doi:10.1016/j.ijms.2014.10.012, 2014.
Laothawornkitkul, J., Taylor, J. E., Paul, N. D., and Hewitt, C. N.: Biogenic volatile organic compounds in the Earth system, New Phytol., 183, 27–51, doi:10.1111/j.1469-8137.2009.02859.x, 2009.