Mitotic Chromosomes in
Drosophila
Yuri G. Strukov1¤, Tuˆba H. Sural2,3, Mitzi I. Kuroda2,3, John W. Sedat1*
1Department of Biochemistry and Biophysics, University of California San Francisco, San Francisco, California, United States of America,2Division of Genetics, Department of Medicine, Brigham & Women’s Hospital, Boston, Massachusetts, United States of America,3Department of Genetics, Harvard Medical School, Boston, Massachusetts, United States of America
Abstract
The organization and the mechanisms of condensation of mitotic chromosomes remain unsolved despite many decades of efforts. The lack of resolution, tight compaction, and the absence of function-specific chromatin labels have been the key technical obstacles. The correlation between DNA sequence composition and its contribution to the chromosome-scale structure has been suggested before; it is unclear though if all DNA sequences equally participate in intra- or inter-chromatin or DNA-protein interactions that lead to formation of mitotic chromosomes and if their mitotic positions are reproduced radially. Using high-resolution fluorescence microscopy of live or minimally perturbed, fixed chromosomes in Drosophila embryonic cultures or tissues expressing MSL3-GFP fusion protein, we studied positioning of specific MSL3-binding sites. Actively transcribed, dosage compensatedDrosophilagenes are distributed along the euchromatic arm of the male X chromosome. Several novel features of mitotic chromosomes have been observed. MSL3-GFP is always found at the periphery of mitotic chromosomes, suggesting that active, dosage compensated genes are also found at the periphery of mitotic chromosomes. Furthermore, radial distribution of chromatin loci on mitotic chromosomes was found to be correlated with their functional activity as judged by core histone modifications. Histone modifications specific to active chromatin were found peripheral with respect to silent chromatin. MSL3-GFP-labeled chromatin loci become peripheral starting in late prophase. In early prophase, dosage compensated chromatin regions traverse the entire width of chromosomes. These findings suggest large-scale internal rearrangements within chromosomes during the prophase condensation step, arguing against consecutive coiling models. Our results suggest that the organization of mitotic chromosomes is reproducible not only longitudinally, as demonstrated by chromosome-specific banding patterns, but also radially. Specific MSL3-binding sites, the majority of which have been demonstrated earlier to be dosage compensated DNA sequences, located on the X chromosomes, and actively transcribed in interphase, are positioned at the periphery of mitotic chromosomes. This potentially describes a connection between the DNA/protein content of chromatin loci and their contribution to mitotic chromosome structure. Live high-resolution observations of consecutive condensation states in MSL3-GFP expressing cells could provide additional details regarding the condensation mechanisms.
Citation:Strukov YG, Sural TH, Kuroda MI, Sedat JW (2011) Evidence of Activity-Specific, Radial Organization of Mitotic Chromosomes inDrosophila. PLoS Biol 9(1): e1000574. doi:10.1371/journal.pbio.1000574
Academic Editor:Tom Misteli, National Cancer Institute, United States of America
ReceivedMay 11, 2010;AcceptedNovember 24, 2010;PublishedJanuary 11, 2011
Copyright:ß2011 Strukov et al. This is an open-access article distributed under the terms of the Creative Commons Attribution License, which permits unrestricted use, distribution, and reproduction in any medium, provided the original author and source are credited.
Funding:This work was supported in part by National Institutes of Health (NIH) grant GM45744 to MIK and NIH-NIGMS R01 GM085502-01 grant to JWS. The funders had no role in study design, data collection and analysis, decision to publish, or preparation of the manuscript.
Competing Interests:The authors have declared that no competing interests exist.
Abbreviations:DCC, dosage compensation complex; MSL, Male Specific Lethal; NB, neuroblast; PSF, point-spread function; SIM, structured illumination microscopy
* E-mail: [email protected]
¤ Current address: 257 Kensington Way, San Francisco, California, United States of America
Introduction
Over the past decades mitotic chromosomes have been shown to have a high degree of organization. However, the exact configuration of the DNA molecule and its reproducibility within a chromosome are unknown. Consolidation of the results from diverse experimental approaches has not yet led to a thorough understanding of chromosome structure. Structural features of chromosomes are beyond the resolution of light microscopy, and tight compaction and lack of contrast in electron microscopy are among the main technical obstacles [1,2]. Even though the correlation between DNA sequence composition and its contri-bution to the chromosome-scale structure has been suggested before [3,4], it is unclear if any DNA sequence is equally able to participate in intra- or inter-chromatin or DNA-protein interac-tions, leading to formation of mitotic chromosomes. Alternatively,
to insufficient resolution, conceptually overlook the possibility of correlation between the DNA sequence/protein composition of a specific chromatin region and its contribution to chromosome structure [9]. These models concentrate on ‘‘large-scale’’ structural features ranging in size from several tens to several hundred nm and therefore detectable with microscopy. Additional models with features borrowed from both ‘‘radial-loop’’ and ‘‘hierarchical coiling’’ models also have been proposed [10,11]. Despite identification of a number of proteins necessary for successful condensation and segregation of chromosomes in mitosis, key features of the structure, among which are banding patterns, reproducible chromosome geometry, and localization of topo-isomerase II or condensin complexes within chromosomes, await their consolidation and explanation by a model. The question of whether all DNA sequences equally participate in the formation of chromosomes or whether the structural role is entrusted to a narrower class of specialized sequences remains unanswered.
Here we probed the connection between the function of chromatin loci in terms of transcriptional activity and their position on mitotic chromosomes. Dosage compensated genes on the X chromosome in fruit flies provide a functionally distinct subset of genes with a possibility of labeling for fluorescence microscopy. As demonstrated by both cytological and chromo-some-wide mapping studies, the euchromatic arm of the X chro-mosome is specifically bound by MSL complex throughout the cell cycle, including mitosis [12–15], providing a convenient label for
Drosophila melanogasterchromatin in its native state in live cells. As a source of mitotic chromosomes, we used diploid dividing cells from live fly tissues and freshly isolated primary cultures from cellularized embryos expressing GFP fused with MSL3, one of the components of the Drosophila dosage compensation complex
(DCC), also called MSL complex (Male Specific Lethal) [16]. In live embryonic cultures or live 3rd instar larval tissues, specific binding sites were detected through localization of MSL3-GFP, the feature characteristic of active genes on the male X chromosome.
We further explored the potential relationship between transcriptional activity and location of sequences within mitotic chromosomes by immunostaining for specific post-translationally modified histones [17,18]. In a variety of organisms, both transcriptionally silent chromatin, characterized by relatively condensed DNA, and more decondensed transcriptionally active chromatin are marked by specific histone modifications [19]. Various histone marks may continuously stretch over regions of tens of kbp on the scale of gene clusters [20,21] and remain stable over several cell cycles [22–24]. In Drosophila, methylation of histone H3 at lysine 4 is associated with actively transcribed sequences and found in interbands of polytene chromosomes. Monomethylation of lysine 27 in H3 (H3K27me1) is found at pericentric heterochromatin and in most euchromatic bands in polytene chromosomes [25]; monomethylated lysine 20 at H4 (H4K20me1) is known to associate with chromocenter hetero-chromatin and a high number of euchromatic bands [19].
Combining novel fluorescence microscopy techniques with improved spatial and temporal resolution [26] and labeling of specific chromatin loci on the genome scale, we were able to study distribution of native chromatin loci within intact mitotic chromosomes in cells isolated fromDrosophilaembryos. Our results reveal a higher than expected degree of organization, suggesting that the radial distribution of specific chromatin loci are non-uniform in fly mitotic chromosomes. Actively transcribed sequenc-es were found to localize at the periphery of chromosomsequenc-es during mitosis as labeled by specific histone modifications in fixed cells or by MSL3-GFP in vivo, while silent chromatin occupied more internal positions.
Results
Detecting Specific MSL3-Binding Sites on theDrosophila X Chromosome
To visualize discreet, specific loci in liveDrosophilacells, we took advantage of the observation that,80% of active X chromosome genes are clearly marked by DCC and only,1% of genes are free of DCC. DCC specifically binds a subset of genes on the euchromatic arm of the X chromosome in males and is necessary for about 2-fold up-regulation in expression levels through local modification of chromatin [27]. For live imaging of the DCC, a fly line was created carrying four copies of an MSL3-GFP fusion, marking specific MSL3-binding sites on the X chromosome with GFP, and two copies of aDrosophilaH2A histone variant, His2AvD of the H2A.F/Z family, fused with mRFP [28] labeling total chromatin (Figure S1A). His2AvD is widely distributed in the genome. It is enriched in thousands of euchromatic bands and the heterochromatic chromocenter [29]. H2AvD, similar to H2A, associates less tightly with DNA in transcribed sequences. MSL3-GFP was fully functional as judged by transgenic rescue ofmsl3
mutant males. The transgene was expressed from the nativemsl3
promoter, and the presence of four copies did not cause ectopic staining as judged by the similarity to wild type MSL3 immunofluorescence staining patterns and the lack of cytoplasmic or nucleoplasmic background. To study the organization of the euchromatic arm of the X chromosome we focused on neuroblasts (NBs) [30]: diploid, dividing, and easily identifiable cells in dissected brains of 3rd instar larvae (Figure S1 B) and primary cultures isolated from 5–6-h-old embryos (Figure S1C). After Author Summary
Mitotic chromosomes of eukaryotes are relatively large rod-like cellular organelles, about 1mm in diameter and 10mm long, of well-studied composition but unknown structure. The question of whether all DNA sequences equally contribute to the interactions leading to the formation of mitotic chromosomes has never been asked. To find an answer, we determined whether the radial positions of specific chromatin loci within mitotic chro-mosomes were reproduced at every cell cycle or were purely random. Based on fluorescence microscopy images of live or fixed chromosomes in cells from Drosophila
embryos orDrosophilalarval tissues expressing the MSL3-GFP fusion protein from a transgene, we report that the large-scale organization of mitotic chromosomes is repro-duced not only longitudinally, as in the well-known chromosome banding phenomenon, but also radially. Actively transcribed, dosage-compensated genes of the
isolation, primary cultures and tissues survived for up to 4 h of imaging without a change in medium, going through several divisions with normal cytokinesis and producing normal progeny. Embryonic cultures were isolated and deposited in a drop of Chan-Gehring medium on a cover slip glued to a microscope slide and sealed with enough air. The identity of NBs was confirmed by their size, 8–12mm, the presence of smaller cells around them, and
antibody staining against Dpn [31].
Fixed samples were imaged with wide-field deconvolution microscopy and the recently implemented structured illumination microscopy (SIM) technique. SIM has doubled resolution in X, Y, and Z, as compared to conventional wide-field microscopy. The excitation illumination dose was minimized through the use of optimized and dedicated emission filter sets: DAPI (460625 nm), FITC (515615 nm), and RHOD (590615 nm). The 3D positions, orientations, and magnifications of signals imaged with FITC and RHOD emission channels varied systematically due to the differences in alignment of cameras and the chromatic aberration. In multi-color images, these channels were aligned using parameters calculated from multi-color micro-bead Z-stacks for wide-field microscopy or SIM (described in Supporting Methods in Text S1). The values of parameters were found as an optimization problem solution minimizing differences between the positions of the beads in different channels (Text S1 and Figure S2).
Dosage Compensated Sequences Target to the Periphery of Live and Fixed Mitotic and Interphase Chromosomes
In live embryos, bright foci of MSL3-GFP binding scattered uniformly over the entire nucleus are first detected late in cell cycle 14, during interphase before the first asynchronous division in the cellularized embryo. Within a single cell cycle, scattered MSL3-marked foci relocate into a relatively compact nuclear sub-region, ,10%–30% of the nucleus area in projection (Figure 1A). The signal retains its specificity and brightness during the entire cell cycle throughout development, making it possible to use embryonic and larval brain NBs for imaging of chromatin loci specific to male X chromosomes (Video S1).
To study localization of MSL3-GFP-marked specific sites on X chromosomes, live primary embryonic cultures isolated from the fly line expressing both MSL3-GFP and His2AvDmRFP1 were imaged with wide-field microscopy. Fast Z-stacks, 20–30 sections per second, were collected, followed by deconvolution with a measured point-spread function (PSF). In embryonic cultures, all interphase and late prophase through telophase cells showed peripheral localization of MSL3-GFP with respect to adjacent chromatin (Figure 1A–F). An example Z-stack of a fixed metaphase NB expressing MSL3-GFP and His2AvDmRFP1 is shown in Video S2. In early prophase, MSL3-GFP domains were often found sandwiched between bulk chromatin domains (Figures 1B and 2A) running the entire width of the chromosome. In live anaphase chromosomes of dissected 3rdinstar larval brains imaged as Z-projections, MSL3-GFP was also peripheral in all observed cases. On all anaphase chromosomes, the MSL3-GFP pattern looked like two approximately parallel, ,1–3mm long, segments separated by ,200–300 nm (Figure 1E). Figure 1F shows a cross-section of a live anaphase chromatid where the mRFP1-marked chromatin signal is clearly inside the peripheral GFP signal. The majority of foci of interphase MSL3-GFP, similarly to mitosis, localized to the periphery of chromatin domains marked by His2AvDmRFP1 with occasional partial overlap (Figure 1A). A similar organization of chromatin was observed in embryonic cultures fixed after isolation. This is very different from polytene chromosomes in which MSL3-GFP and His2AvDmRFP1 bands demonstrated, although not perfectly, a
high degree of co-localization (Figure S1A). Immunostaining of fixed embryonic cultures for MSL2 (another DCC component) confirmed our finding that in X chromosomes, specific DCC-binding sites marked by MSL3-GFP target to the edges of compact chromatin domains in interphase or at the chromatid surface in mitosis (Figures S3 and S4 and Video S3).
In live or fixed interphase cells expressing MSL3-GFP and His2AvDmRFP1, the MSL3-GFP labeled X chromosome arm was a diffuse ‘‘cloud’’ of 20–30 foci of different intensity occupying 10%–30% of the nucleus area in projection, or 3–5mm in linear dimensions. These foci were found at the periphery of condensed chromatin domains labeled with His2AvDmRFP1. In early prophase cells, the MSL3-GFP labeled condensing arm is a relatively compact structure, ,4–6mm long and ,1mm thick (Figure 2A). Interestingly, the MSL3-GFP signal was found not at the periphery of early prophase chromosomes but across their entire width between the bulk condensed chromatin regions (arrowheads in Figure 2A). The early prophase MSL3-GFP signal was complementary to the bulk chromatin domains marked by His2AvDmRFP1 but not peripheral. Transition from the internal to peripheral localization of MSL3-GFP occurred between early and late prophase (Figure 2A and B) before segregation of sister chromatids became apparent. After segregation at metaphase, MSL3-GFP stayed peripheral on both chromatids (Figure 2C). MSL3-GFP is found inside condensing early prophase chromo-somes; however, starting from late prophase, MSL3-GFP signal is found only at the periphery of mitotic chromosomes in live or fixed cells.
nucleus, fully decondensed chromatin, and reformed nucleoli as judged by His2AvDmRFP1 staining. The increase in the area of the MSL3-GFP-marked region occurred exclusively through expansion of chromosome arm, not redistribution or de novo
binding of MSL3-GFP. We conclude that the regions devoid of
MSL3-GFP signal in mitotic chromosomes do not appear to be targets of MSL complex upon decondensation.
Another line of evidence for limited re-distribution comes from the low, little changing cytoplasmic MSL3-GFP background over the entire cell cycle. The background intensity of MSL3-GFP in Figure 1. MSL3-GFP targets to the periphery of chromosomes in live embryonic cultured cells expressing MSL3-GFP and His2AvDmRFP1 at different stages of the cell cycle.For all pseudo-colored images: RFP1, cyan; GFP, magenta. (A–F) Rows from top to bottom: interphase, prophase, prometaphase, metaphase, anaphase (side view), and anaphase (cross-section view). Columns from left to right: His2AvDmRFP1-labeled chromatin, MSL3-GFP, superimposed mRFP1 (cyan) and GFP (magenta) signals, 3-fold higher magnification of the labeled X chromosome arm. All images were deconvolved. Bars: 1mm – (F, third column), G, H, I; 0.5mm – (F, last column).
mitotic cytoplasm is comparable to the uniform background intensity outside the cells created by out-of-focus and scattered light. For a metaphase cell, the outside background was 15–35 units (mean 24), the cytoplasm was 25–55 (mean 38), compared to the labeled X chromosome arm—125–525 (mean 305). In interphase, the nuclear and cytoplasmic background intensity of MSL3-GFP is comparable or higher than in mitosis. This suggests that in mitosis the majority of MSL3-GFP is divided between daughter cells by traveling on chromosomes and that there is minimal loss of MSL3-GFP from chromatin targets during mitotic condensation.
The MSL3-GFP labeled loci often surround an area of no or low GFP signal in live embryos of dissected tissues (Figure 3C and D and Figure S1C and B, respectively), despite their extremely dynamic behavior in interphase. In the majority of interphase nuclei, MSL3-GFP labeled regions demonstrate apparent reduc-tion of GFP signal intensity in the middle of the labeled arm as shown in Figure 3C and D. These observations are consistent with the previous FISH studies of fixed tissue culture cells [33,34].
The distribution of MSL3-GFP during mitosis or interphase is clearly distinct from the binding patterns of perichromosomal layer proteins, such as Ki-67 and nucleophosmin, which are associated with the outer surface of chromosomes in mitosis and populate the vicinity of chromosomes in the form of granules and fibrils [35]. MSL3-GFP and components of the DCC remain bound exclusively to chromatin locations of the euchromatic X chromosome arms at all stages of the cell cycle. In contrast, the proteins of the perichromosomal layer cover the periphery of all mitotic chromosomes over their entire length, except centromeres, from prophase to telophase. In interphase, the proteins of the perichromosomal layer are found in nucleoplasm and cytoplasm with preferential accumulation at nucleoli.
Histone Modifications Are Distributed Non-Uniformly in Mitotic Chromosomes
[27,36]. Drosophila chromatin regions of different transcription states are known to be marked with specific histone modifications. Patterns of covalent core histone modifications are established in
Drosophilaembryos by cell cycle 15. We chose di- and trimethyla-tion of lysine 4 on histone H3 (H3K4me2,3) as a marker for active
euchromatin, and H3K27me1 and H4K20me1 as markers for silent, non-coding regions in euchromatic chromosomal arms for immunofluorescence. Double-antibody staining served two pur-poses: (a) to study the distribution of actively transcribed sequences over the entire X chromosome and autosomes, and (b) to study the Figure 3. MSL3-GFP, peripheral during anaphase, remains mostly peripheral during decondensation. (A, B) MSL3-GFP does not redistribute during post-mitotic decondensation and interphase. The numbers represent minutes after beginning of observation. The first images of (A) and (B) are captured in mid-anaphase: peripheral MSL3-GFP is shown. (A) Anaphase to interphase dynamics of MSL3-GFP labeled X chromosomes in live 3rdinstar larval brains. (B) Anaphase to interphase dynamics of MSL3-GFP labeled X chromosomes in live embryonic cultures. Arrowheads point
to apparent halves of MSL3-GFP signal, with an area inside devoid of MSL3-GFP. In many cells of live embryonic cultures (C) and tissues (D), MSL3-GFP labeled chromatin loci in interphase NBs form a typical pattern: a rim of MSL3-GFP signal around a region with no or little GFP signal. Gray-scale images in (C) and (D) are 3-fold magnifications of center colored panels. Numbers represent seconds (C) and minutes (D) after beginning of observation. All images, except for (B), were deconvolved. Bars: 1mm.
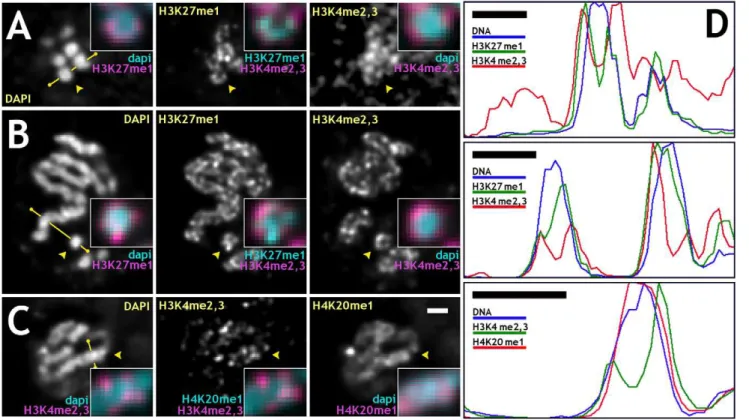
distribution of histone modifications specific to different transcrip-tion states. In mitotic chromosomes, H3K27me1 and anti-H4K20me1 antibodies were found to stain all chromosomes uniformly along their lengths, on both euchromatic and heterochromatic arms. In contrast, anti-H3K4me2,3 was limited to euchromatic arms of mitotic chromosomes, an indication of the specificity of the antibodies. We found that immunofluorescence signals from anti-H3K27me1 and anti-H4K20me1 were consis-tently found at more internal locations on chromosomes compared to the anti-H3K4me2,3, as summarized in Figure 4A–C for mitotic cells. Line profiles were used for better visualization of non-uniform distribution of different antibodies (Figure 4D). Anti-H3K4me2,3, as well as anti-MSL2, antibodies always stained the periphery of chromosomes, with a significant fraction of the signal found outside the visible DAPI signal. This is different from anti-H3K27me1 and anti-H4K20me1 signals, which were found mostly inside chromosomes with no or little signal extending into DAPI-free regions. In multiple examples, anti-H4K20me1 staining coincides with the DAPI signal uniformly staining chromosomes (Figure 4C). Anti-H3K27me1 signal stains, though not uniformly, the entire width of chromosomes or often with visible reduction of signal at chromosomal cores (Figure 4A and B). A more internal and uniform signal of H4K20me1 antibody compared to anti-H3K27me1 is consistent with localization of H4K20me1 to
relatively more condensed regions of genome (chromocenter and few euchromatic bands in polytene chromosomes). To support these observations, the widths and distributions of fluorescent labels after immunofluorescence staining with different antibodies or in live cells were measured (Table 1). The widths of chromosomes, immunostaining, and MSL3-GFP signals were measured as FWHM in averaged profiles. It is seen that anti-H3K4me2,3 and live MSL3-GFP signals localize to the periphery of mitotic chromosomes and are depleted at the cores of mitotic chromosomes relatively to the H3K27me1 and anti-H4K20me1 signals, which show less depletion at the core (Figure S5). This is additional evidence that active coding sequences target to the periphery of chromosomes in mitosis. Hypothesis testing of the null hypothesis of equal means was done for each pair of data sets for different labeling methods and summarized in Table S1. In support of our observations and measurements, the null hypotheses of equal means were rejected for the following pairs: H3K4me2,3 and H4K20me1; H3K4me2,3 and H3K27me1; H4K20me1 and MSL3-GFP; MSL3-GFP and H3K27me1. Rejection of the null hypothesis of equal means is not supported for the following pairs: H3K4me2,3 and MSL3-GFP; H3K27me1 and H4K20me1. This is in agreement with similarity in the distributions of the signals and their widths. All primary antibodies used for immunofluorescence were of the monomeric IgG type,
Figure 4. The density of specific histone modifications varies across metaphase and anaphase chromosomes.(A–C) Double antibody staining against specific histone modifications in fixed embryonic cultures is radially non-uniform in mitotic chromosomes. In (A) and (B), examples are shown of cells stained with DAPI for DNA (left images), anti-H3K27me1 (center images), and anti-H3K4me2,3 (right images) antibodies, (C) DAPI (left), anti-H3K4me2,3 (middle), and anti-H4K20me1 (right) antibodies. (A) An optical cross-section of anaphase chromosomes oriented along the optical axis; (B) side view of metaphase chromosomes; (C) side view of anaphase chromosomes. Arrowheads point to regions magnified 2.5-fold in insets. Insets: (A,B) DAPI (cyan) and anti-H3K27me1 (magenta) – left column; anti-H3K27me1 (cyan) and anti-H3K4me2,3 (magenta) – middle column; DAPI (cyan) and anti-H3K4me2,3 (magenta) – right column. (C) DAPI (cyan) and anti-H3K4me2,3 (magenta) – left column; anti-H4K20me1 (cyan) and anti-H3K4me2,3 (magenta) – middle column; DAPI (cyan) and anti-H4K20me1 (magenta) – right column. (D) Profiles for antibody stained chromosomes along lines marked by yellow segments in (A–C) in the same order. In interphase chromosomes, anti-MSL2 and anti-H3K4me2,3 signals marking active loci occupy regions spatially distinct from anti-H3K27me1 and anti-H4K20me1, demonstrating that tightly compacted mitotic chromatin is accessible to antibodies. Images were deconvolved. Bars: 1mm – (C, D).
and secondary antibodies were F(ab’)2 fragments labeled with a
fluorophore.
In fixed interphase cells, actively transcribed sequences labeled with anti-MSL2 or anti-H3K4me2,3 (pseudo-colored magenta) are found outside chromatin regions labeled with DAPI and were complementary to them (Figure 5A and B, respectively). In contrast, anti-H3K27me1- and anti-H4K20me1-labeled silent chromatin was a subset of DAPI stained chromatin largely overlapping with it (Figure 5C and D, respectively).
To investigate the accessibility of mitotic chromatin to antibodies, we stained fixed mitotic cells with antibodies to Barren and to CID-GFP, both known to be buried inside mitotic chromosomes. Barren, a member of the kleisin family and an ortholog of human CAP-H, binds to the head domains of the SMC heterodimer in a complex with two other non-SMC subunits [37]. As a part of the condensin complex, Barren accumulates at the core regions of mitotic chromosomes starting in prophase through metaphase. Anti-barren [38] immunofluorescence signal was found at the central core regions of the DAPI stained chromosomes imaged with wide-field or SIM (Figure S6A and B, respectively), similar to live distributions (Y. Strukov, unpublished results). CID, aDrosophilaortholog of human CENP-A, is an H3-like protein that replaces canonical H3 in all eukaryotic centromeres [39]. It was proposed that CID is the epigenetic mark and a foundation for fly centromeres and localizes beneath the kinetochore with some overlap with the inner kinetochore [40]. Anti-GFP immunofluorescence of CID-GFP embryonic cultures gave a uniform labeling over all centromeres in mitotic cells (the same as in live cells), demonstrating accessibility of chromatin buried by the kinetochore structures to antibodies under our fixation conditions (Figure S6C and D). Centromeres of CID-GFP expressing cells had the same size and shapes irrespective of the imaging modality: live imaged with wide-field deconvolution, antibody-stained imaged with wide-field deconvo-lution, or antibody-stained imaged with SIM (Figure S6E), demonstrated by intensity profiles (Figure S6F).
Materials and Methods
Fly Lines
A 5.5-kb BamHI genomic fragment containing the promoter and open reading frame of themsl3gene [41] was subcloned from cosmid msl3-5-1 (AE003560.1 position 60298–92793) into the pBluescript II SK(2) vector [12]. A blunted NcoI/NotI fragment containing eGFP from the pEGFP-N1 vector (Clontech) was subcloned in-frame into the CelII blunted pBS-msl3construct. The
resulting MSL3-GFP BamHI fragment was subcloned into pCaSpeR3 to make the final MSL3-GFP–pCaSpeR3 construct. Several independent transgenic lines were produced by P-element-mediated transformation [42]. Two independent lines, one with the transgene on the 2ndand one with it on the 3rdchromosome, were crossed to generate a stock with homozygous MSL3-GFP on both chromosomes (4 copies). Fly line msl3-gfp, His2AvDmRFP1; msl3-gfp was created by recombination of msl3-gfp; msl3-gfp with a His2AvDmRFP1 transgenic line [28] for dual-color live experiments; CID-GFP line was generated in the lab of S. Henikoff (FHCRC).
Sample Preparation and Immunostaining
Embryonic cultures were isolated according to a previously published protocol [30]. The fixation and immunostaining protocols were adapted from [43]. Antibodies were from Abcam (Cambridge, MA): rabbit polyclonal anti-H4K20me1 (ab9048), and anti-GFP (ab290), mouse monoclonal anti-H3K4me2,3 (ab6000), and Upstate Scientific: rabbit anti-H3K27me1 (07-448), all monomeric IgG. Rabbit anti-MSL2 antibody was generated in the Kuroda laboratory [44]. Goat anti-mouse or anti-rabbit secondary antibodies were from Molecular Probes: A-11017, A-11018, A-11070, A-11071.
Microscopy and Image Processing
Live, wide-field optical sectioning and SIM were done on a custom-made inverted microscope [26] supplied with a set of excitation lasers and cooled back-thinned CCD cameras (Andor). Deconvolution and SIM reconstruction were done using a measured PSF [45]. Image processing and computations were done using Priism, Python (align.py and simplex.py), and Octave scripts available upon request (contact YGS: [email protected]).
Discussion
Our investigation has provided insights into mitotic chromatin organization and its connection to chromatin function. We observed several novel features of mitotic chromosomes in
Drosophila cells. First, MSL3-binding sites, specific to the X chromosome, target to the periphery of mitotic chromosomes. Second, spatial distribution of chromatin loci within mitotic chromosomes was correlated with their functional properties judged by the core histone modifications. Third, during late prophato-anaphase condensation of chromatids, active se-quences remain peripheral, suggesting rearrangement of chroma-tin within prophase chromatids and arguing against simple coiling Table 1.Immunofluorescence staining against specific histone modifications and live MSL3-GFP signal have different width and distribution on mitotic chromosomes.
Anti-H3K4me2,3 Anti-H4K20me1 Anti-H3K27me1 Live MSL3-GFP
Number of chromosomes 21 20 18 15
Mean chromosome width, nm 467 (66) 468 (58) 463 (79) 482 (73)
Mean IF staining width, nm 632 (91) 499 (67) 533 (108) 633 (68)
Mean ratio: ‘‘IF’’/‘‘DNA’’ 1.34 (0.16) 1.07 (0.07) 1.15 (0.15) 1.33 (0.17)
Two peak separation, nm 358 (50) 276 (50) 308 (65) 353 (51)
Rows from top to bottom: number of chromosomes measured for each data set; mean chromosome width after DAPI staining for the antibody stained chromosomes or for His2AvDmRFP1-labeling for live chromosomes in MSL3-GFP-expressing tissues; mean immunofluorescence (IF) staining width (the first three columns) or MSL3-GFP signal width (the rightmost column) for live cells; individually normalized and averaged widths of antibody or MSL3-GFP labels, ‘‘IF’’ is an antibody staining width, ‘‘DNA’’ is a chromosome width; average separation of centers of peripheral antibody or MSL3-GFP signals across the chromosome width (summarized in Figure S5 and more details can be found in Text S1).
of prophase chromatids during condensation. Although several investigations have been undertaken in the past, to our knowledge, ours is the first when native chromosomes in live cells have been studied for localization of specific DNA sequences at high resolution.
All imaging systems with multi-color capability are known to suffer from chromatic aberrations and offsets in translation, rotation, and magnifications between color channels. For interpretation of multi-color data sets, correct superimposition of different color channels was therefore critical. To exclude the influence of the chromatic aberration of the objective lens, variations in the CCD camera specifications, and differences in optics between different emission channels, control multi-color data sets were collected with multi-color micro-beads, separately for wide-field or SIM and compensated to a sub-pixel accuracy using custom software (Supporting Methods in Text S1 and Figure S2). Based on these measurements, we could conclude that peripheral localization of specific sequences marked by DCC or core histone modifications was not due to chromatic aberration or differences in the optics of individual channels.
MSL complex specifically marking dosage compensated genes inDrosophila provides a means for visualization of a functionally distinct fraction of the genome. The 22 Mbp X chromosome arm, predicted to contain about a thousand active genes, is,5% of the
nucleoplasmic backgrounds of MSL3-GFP. The entire population of MSL3-GFP remains bound to the X chromosome. No significant new binding of MSL3-GFP to the chromosome targets was observed during post-mitotic decondensation (Figure 3A and B). This is consistent with a number of earlier findings: MSL complex does not bind at significant levels to non-coding sequences and more than 90% of MSL complexes are found within genes [13,14]; there has been found little [12,49] or no [50] variation in the binding levels at specific loci during development. Redistribution of MSL3-GFP within the X chromosome by fast dissociation from the interphase set of targets to a new non-overlapping mitotic set would be hard to imagine for several reasons. First, most genes on the X chromosome in interphase are bound by MSL complexes [16] and there is no binding of MSL complex to non-coding DNA at the levels sufficient to accommo-date the entire pool of DCC. This suggests a great deal of overlap between interphase and mitotic MSL complex binding sites. Second, available data on the dynamics of MSL binding to its targets show that the time-scale for MSL targeting is on the order of hours [50], which is not consistent with very fast cell mitoses and cycles of chromatin condensation-decondensation in developing Drosophila tissues. Testing mitotic distributions of MSL3 with ChIP at high resolution is currently unfeasible due to the technically challenging procedure of isolating sufficient quantities of purified mitotic cells from dissected tissues and embryonic cultures from Drosophila. At the resolution of fluorescence microscopy analysis we have demonstrated that binding of MSL3-GFP is not cell-cycle stage specific. We chose Hi-s2AvDmRFP1 as a contrasting fluorescent marker because it is found in the heterochromatic chromocenter, on transcribed and non-transcribed genes and in non-coding euchromatin [29].
The current concepts of nuclear organization suggest a relationship between the activity of chromatin loci and their positions within nuclei or interphase chromosomes [51]. However, whether this principle can be extended to also include live and fixed mitotic chromosomes has not been investigated. The question of whether antibodies faithfully represent the imaged features is always important. There are two aspects to this problem: first, uniform accessibility of chromosomal epitopes; and second, the finite size of the antibody complex with a potential to change the size and shape of sampled features. We argue that with our sample preparation and staining techniques mitotic chromatin was available for antibodies. Anti-barren staining produced a continuous axial pattern indicating that internal regions of chromosomes were uniformly accessible. Anti-GFP antibody staining of embryonic cultures isolated from CID-GFP expressing fly embryos gave the patterns of centromere labeling with similar shapes and sizes as in live cells. Consistent with our observations are previous studies of centromere and kinetochore organization where both structures were shown to be accessible after formaldehyde fixation to various antibodies raised against different centromeric or kinetochore proteins [52,53]. It has been demonstrated that in live cells, proteins with molecular dimensions in the size range of components of the transcription machinery (several hundred kDa) can diffuse freely inside condensed chromatin domains [54]. The mass of individual IgG molecules is ,150 kDa, and the size of the primary and secondary fluorophore-labeled antibody complex has been reported to be about 20 nm [55], which makes it small enough to faithfully reflect the features of imaged objects at a resolution of about 200 nm used for immunofluorescence experiments.
Using both immunofluorescence of fixed cells and live observations we showed that MSL3-GFP stays peripheral from late prophase to telophase in the same cell arguing against
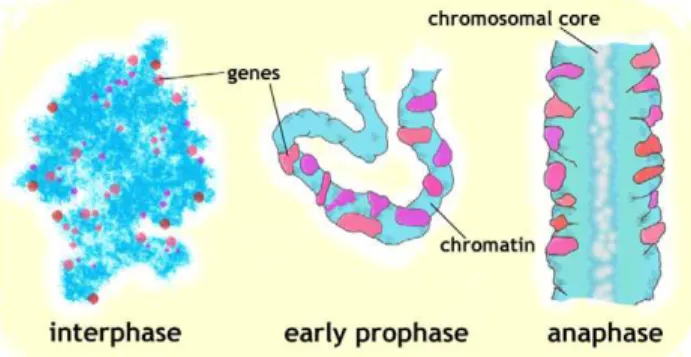
hierarchical coiling condensation [1]. If consecutive coiling is involved, the large-scale fibers have to have persistence length on the order of their thickness, and simultaneously, intra-fiber rearrangements have to be involved to keep the genes at the periphery of the X chromosome as mitotic condensation progresses. Our working model is shown in Figure 6: patches of chromatin carrying active genes, spanning the entire width of chromosomes at early prophase, become peripheral from late prophase through telophase as a result of large-scale rearrange-ments within condensing chromosomes.
An interesting explanation for why active DNA sequences are found at the periphery of mitotic chromosomes comes from biochemical studies of the ‘‘bookmarking’’ mechanism that helps cells remember which genes were active before mitosis. It was reported that active promoters/genes remain bound by a transcription factor TFIID in mitosis [56] and may escape the condensin complexes action through recruitment of the TBP-PP2A mitotic complex [57]. Transcribed sequences show more mitotic TBP binding than silent DNA. TBP interacts with the condensin I subunit CAP-G and condensin inhibitor phosphatase PP2A during mitosis at many chromosomal sites active before mitosis.
Our findings are consistent with the results of a number of earlier studies concentrated on the localization of specific DNA sequences or sequences of specific properties on mitotic chromo-somes. However, our conclusions are based on observations of native chromatin loci in the context of unperturbed chromosomes. Specifically stained AT-rich DNA sequences in Munjac chromo-somes formed a full-diameter coil at gene-poor regions and uncoiled in gene-rich regions staying at the core [7]. In accordance with the radially non-uniform organization, the AT-rich sequences were at the core regions of the gene-rich bands, while the rest of DNA in the bands was more peripheral. Radially different and reproducible positions of specific sequences after FISH of salt-extracted isolated chromosomes was observed in agreement with the radial-loop model, with no indication, however, of their positions in native chromosomes [6]. Preferentially external lateral positions of specific sequences on mitotic chromosomes in mitotic spreads have also been reported after FISH [58]. However, the conclusions were not as convincing due to limited resolution in the images and FISH procedure-induced disturbance of native morphology. The degree of reproducibility of radial positions of stably transfected and gene amplified lac op repeats varied in different tissue culture cell lines, probably due to position effects
Figure 6. Formation of a radially non-uniform anaphase chromosome.Large-scale re-arrangements inside 100–200 nm wide early prophase fibers (in which MSL3-GFP signals are often found throughout the entire chromosome width) result in peripheral localization of active sequences in ,500 nm wide metaphase and anaphase chromatids.
[4,59]. Lac op repeats could be found either at the core regions of chromosomes or throughout the width of chromosomes.
Reproducibility of positioning of specific sequences might be related to functional contributions of diverse classes of loci to the structure. Actively transcribed sequences may be spared a structural function or cannot be involved because of their specific protein composition or kinetic restrictions due to delay in condensation compared to silent or non-coding DNA. Alterna-tively, there could be a difference in degree of condensation or in its temporal sequence between peripheral and more central regions of mitotic chromosomes. Together, our results suggest novel structural features of mitotic chromosomes that can contribute to the understanding of mitotic condensation, with important implications for understanding the connection between chromatin organization and its epigenetic regulation.
Supporting Information
Figure S1 Examples of polytene chromosomes, embry-os, and tissues from a transgenic fly line carrying MSL3-GFP and His2AvDmRFP1. (A) Live polytene nuclei isolated from 3rdinstar larvae of yw; [w+ M3-GFP]; [w+M3-GFP] line. Top row: His2AvDmRFP1 and MSL3-GFP channels, respective-ly; middle row: superimposed, pseudo-colored images, with a close-up of 3-fold higher magnification; bottom row: Hi-s2AvDmRFP1 and MSL3-GFP are largely, though not perfectly, co-localized. The arrowheads show two co-localized bands in both channels. (B) Live brain of 3rdinstar larvae expressing MSL3-GFP. GFP signal of many X chromosomes shows radially non-uniform organization with reduced intensity in the middle of the signal. (C) Live embryos during gastrulation, cell cycle 15 with compact MSL3-GFP signals. Bars: 5mm – (A) (top row), (C); 2mm – (A) (middle row).
Found at: doi:10.1371/journal.pbio.1000574.s001 (3.39 MB TIF)
Figure S2 Digital, postimaging alignment of different color channels is necessary to exclude the contributions of chromatic aberrations, relative differences in CCD camera adjustments, such as translations, rotations and magnification, and variations in the optical paths of the color channels. Shown are the FITC and RHOD channels before (A) and after (B) alignment: the RHOD channel was translated, rotated, and magnification compensated to match the FITC channel. Top panels show the XY projections of a 3D bead data set, bottom panels – XZ projections. Bar: 1mm.
Found at: doi:10.1371/journal.pbio.1000574.s002 (0.31 MB TIF)
Figure S3 Actively transcribed sequences target to the periphery of chromosomes at different stages of mitosis and at interphase in fixed, anti-MSL2 antibody stained cells of embryonic cultures isolated from Oregon R line and imaged with SIM. Despite overlap between anti-MSL2 and DAPI signals, some MSL2 stayed outside the DAPI-labeled chromatin. For each row, (A) through (E), shown are from left to right DAPI, MSL2, pseudo-colored DAPI (cyan) and anti-MSL2 (magenta) superimposed, and a 2.5-fold increased magni-fication of the antibody labeled chromosome arm. (A) interphase; (B) prometaphase; (C) metaphase; (D) in anaphase, the anti-MSL2 signal was 400–600 nm in diameter with the DAPI-stained chromatid diameter of 400–500 nm. (E) telophase. Bars: 1mm – whole cell images; 0.5mm – expanded regions.
Found at: doi:10.1371/journal.pbio.1000574.s003 (7.13 MB TIF)
Figure S4 Stereo-pairs of anti-GFP stained, SIM-imaged (single sister chromatid) chromosomes in fixed cells isolated from MSL3-GFP expressing embryos. Only the
euchromatic arm of X chromosome is labeled: side view with telomeres at the bottom (left) and axial view with a staining-free channel within an anaphase chromatid (right). Bar: 0.5mm. Found at: doi:10.1371/journal.pbio.1000574.s004 (0.11 MB TIF)
Figure S5 Immunofluorescence staining against differ-ent histone modifications and the MSL3-GFP signal have different widths and intensity distributions relative to chromosomal DNA. The intensities of individual profiles in each group was normalized, then averaged and plotted to demonstrate differences both in the relative widths and signal distributions. Each individual profile was an average over a straight linear segment of a chromosomal arm 15 pixels or about 1200 nm long. Anti-H3K4me2,3 and live MSL3-GFP signals had equal widths,,630 nm (std 91 nm), pronounced depletion of the signal at the core, and well-separated and coinciding peaks of peripheral signals. Anti-H3K27me1 was narrower than the first two, 533 nm (std 108) and had barely resolved peripheral signals with almost no drop of the intensity at the core. Anti-H4K20me1 signal was 500 nm (std 67) wide and had no dip at the core, similar in the profile to DAPI staining and suggesting that it stained more internal regions of chromosomes compared to MSL3-GFP or the other antibody signals. Normalization of individual profiles by the chromosome width measured with DAPI or His2AvDmRFP1 signals produced similar averaged values.
Found at: doi:10.1371/journal.pbio.1000574.s005 (0.22 MB TIF)
Figure S6 Mitotic chromatin is not refractory to immunofluorescence. Wide-field imaged metaphase (A) and SIM-imaged anaphase (B) chromosomes stained with anti-barren antibodies. From left to right: DAPI, anti-barren antibody, pseudo-colored and superimposed DAPI (cyan) and anti-barren (magenta), 2.5-fold higher magnification of the superimposition. The dimensions and the shapes of the centromeres are comparable in live and fixed cells. (C) Live cells, from left to right: His2AvDmRFP1, cid-GFP, cid-GFP (magenta), and Hi-s2AvDmRFP1 (cyan) combined. (D) Fixed cells, from left to right: DAPI, anti-GFP antibody, anti-GFP antibody (magenta), and DAPI (cyan) combined. (E) The appearance and dimensions of centromeres do not depend on labeling and imaging methods. From left to right: cid-GFP imaged with wide-filed microscopy, anti-GFP antibody staining imaged with wide-filed microscopy (both expanded from panels C and D), and centromeres after anti-GFP antibody staining of a fixed cell imaged with SIM. All non-SIM images were deconvolved. (F) Intensity line profiles across centromere images with different modalities are comparable at FWHM. Bars: 0.5mm – (A), (B), (D) (centromere images); 0.1mm – line profiles in (F).
Found at: doi:10.1371/journal.pbio.1000574.s006 (0.94 MB TIF)
Table S1 The results of hypothesis testing with the null hypothesis of pair-wise equal means and different alternative hypotheses are in agreement with the observed variations in the distribution of histone modi-fications across the chromosome width.One-sided alter-native hypothesis H1was that the mean of the first data set was
greater than the mean of the second data set in the same row. Two-sided alternative hypothesis H1was that the mean of the first
and H4K20me1. This is in agreement with our conclusions based on visual observations and examination of individual profiles. Found at: doi:10.1371/journal.pbio.1000574.s007 (0.11 MB DOC)
Text S1 Supporting text contains extra details and discussion of methods and supporting figures and videos. Supporting information includes detailed protocols of preparation ofDrosophilaembryonic cultures and dissected tissues, fixation and immunostaining procedure, and fluorescence micros-copy imaging and image processing.
Found at: doi:10.1371/journal.pbio.1000574.s008 (0.14 MB DOC)
Video S1 Mitotic condensation of chromatin in embry-onic cultures isolated from msl3GFP, His2AvDmRFP1; msl3GFP line. Maximum intensity projections of 6 optical sections 0.5mm apart; images were taken once every 40 s. Found at: doi:10.1371/journal.pbio.1000574.s009 (0.16 MB AVI)
Video S2 A Z-stack of fixed metaphase cell in embry-onic culture isolated from msl3GFP, His2AvDmRFP1; msl3GFP line: optical sections are 150 nm apart. Found at: doi:10.1371/journal.pbio.1000574.s010 (0.13 MB AVI)
Video S3 3D reconstruction of anti-GFP staining of fixed anaphase X chromosome of MSL3-GFP line imaged with SI.
Found at: doi:10.1371/journal.pbio.1000574.s011 (0.33 MB AVI)
Video S4 Live decondensation of MSL3-GFP labeled chromosome in larval brains from mid-anaphase through interphase: 178 time points, 10 s apart. Found at: doi:10.1371/journal.pbio.1000574.s012 (0.30 MB AVI)
Acknowledgments
We thank Steffen Heidmann (University of Bayreuth, Germany) for His2AvDmRFP1 fly lines; Steven Henikoff (FHCRC) for CID-GFP fly lines; Hugo Bellen (BCM) for Drosophilaanti-Barren antibody; and the Agard, Blackburn, Jan, Lim, Narlikar, O’Farrell, and Kornberg labora-tories at UCSF for kindly allowing the use of their reagents and equipment as well as the members of their labs for insightful and encouraging discussions. Technical assistance and helpful suggestions of the members of Sedat group are highly appreciated.
Author Contributions
The author(s) have made the following declarations about their contributions: Conceived and designed the experiments: YGS MIK JWS. Performed the experiments: YGS THS. Analyzed the data: YGS JWS. Contributed reagents/materials/analysis tools: YGS THS MIK JWS. Wrote the paper: YGS MIK JWS.
References
1. Belmont AS (2006) Mitotic chromosome structure and condensation. Curr Opin Cell Biol 18: 632–638.
2. Eltsov M, Maclellan KM, Maeshima K, Frangakis AS, Dubochet J (2008) Analysis of cryo-electron microscopy images does not support the existence of 30-nm chromatin fibers in mitotic chromosomes in situ. Proc Natl Acad Sci U S A 105: 19732–19737.
3. Costantini M, Bernardi G (2008) Replication timing, chromosomal bands, and isochores. Proc Natl Acad Sci U S A 105: 3433–3437.
4. Dietzel S, Belmont AS (2001) Reproducible but dynamic positioning of DNA in chromosomes during mitosis. Nat Cell Biol 3: 767–770.
5. Marko JF (2008) Micromechanical studies of mitotic chromosomes. Chromo-some Res 16: 469–497.
6. Bickmore WA, Oghene K (1996) Visualizing the spatial relationships between defined DNA sequences and the axial region of extracted metaphase chromosomes. Cell 84: 95–104.
7. Saitoh Y, Laemmli UK (1994) Metaphase chromosome structure: bands arise from a differential folding path of the highly AT-rich scaffold. Cell 76: 609–622. 8. Kantidze OL, Razin SV (2009) Chromatin loops, illegitimate recombination,
and genome evolution. Bioessays 31: 278–286.
9. Belmont AS, Sedat JW, Agard DA (1987) A three-dimensional approach to mitotic chromosome structure: evidence for a complex hierarchical organization. J Cell Biol 105: 77–92.
10. Boy de la Tour E, Laemmli UK (1988) The metaphase scaffold is helically folded: sister chromatids have predominantly opposite helical handedness. Cell 55: 937–944.
11. Rattner JB, Lin CC (1985) Radial loops and helical coils coexist in metaphase chromosomes. Cell 42: 291–296.
12. Alekseyenko AA, Larschan E, Lai WR, Park PJ, Kuroda MI (2006) High-resolution ChIP-chip analysis reveals that the Drosophila MSL complex selectively identifies active genes on the male X chromosome. Genes Dev 20: 848–857. 13. Alekseyenko AA, Peng S, Larschan E, Gorchakov AA, Lee OK, et al. (2008) A
sequence motif within chromatin entry sites directs MSL establishment on the Drosophila X chromosome. Cell 134: 599–609.
14. Gilfillan GD, Straub T, de Wit E, Greil F, Lamm R, et al. (2006) Chromosome-wide gene-specific targeting of the Drosophila dosage compensation complex. Genes Dev 20: 858–870.
15. Straub T, Becker PB (2008) DNA sequence and the organization of chromosomal domains. Curr Opin Genet Dev 18: 175–180.
16. Gelbart ME, Kuroda MI (2009) Drosophila dosage compensation: a complex voyage to the X chromosome. Development 136: 1399–1410.
17. Peterson CL, Laniel MA (2004) Histones and histone modifications. Curr Biol 14: R546–R551.
18. Shogren-Knaak M, Ishii H, Sun JM, Pazin MJ, Davie JR, et al. (2006) Histone H4-K16 acetylation controls chromatin structure and protein interactions. Science 311: 844–847.
19. Ebert A, Lein S, Schotta G, Reuter G (2006) Histone modification and the control of heterochromatic gene silencing in Drosophila. Chromosome Res 14: 377–392.
20. Boutanaev AM, Kalmykova AI, Shevelyov YY, Nurminsky DI (2002) Large clusters of co-expressed genes in the Drosophila genome. Nature 420: 666–669. 21. Schubeler D, MacAlpine DM, Scalzo D, Wirbelauer C, Kooperberg C, et al. (2004) The histone modification pattern of active genes revealed through genome-wide chromatin analysis of a higher eukaryote. Genes Dev 18: 1263–1271.
22. Karachentsev D, Druzhinina M, Steward R (2007) Free and chromatin-associated mono-, di-, and trimethylation of histone H4-lysine 20 during development and cell cycle progression. Dev Biol 304: 46–52.
23. Pesavento JJ, Yang H, Kelleher NL, Mizzen CA (2008) Certain and progressive methylation of histone H4 at lysine 20 during the cell cycle. Mol Cell Biol 28: 468–486.
24. Valls E, Sanchez-Molina S, Martinez-Balbas MA (2005) Role of histone modifications in marking and activating genes through mitosis. J Biol Chem 280: 42592–42600.
25. Ebert A, Schotta G, Lein S, Kubicek S, Krauss V, et al. (2004) Su(var) genes regulate the balance between euchromatin and heterochromatin in Drosophila. Genes Dev 18: 2973–2983.
26. Schermelleh L, Carlton PM, Haase S, Shao L, Winoto L, et al. (2008) Subdiffraction multicolor imaging of the nuclear periphery with 3D structured illumination microscopy. Science 320: 1332–1336.
27. Hamada FN, Park PJ, Gordadze PR, Kuroda MI (2005) Global regulation of X chromosomal genes by the MSL complex in Drosophila melanogaster. Genes Dev 19: 2289–2294.
28. Schuh M, Lehner CF, Heidmann S (2007) Incorporation of Drosophila CID/ CENP-A and CENP-C into centromeres during early embryonic anaphase. Curr Biol 17: 237–243.
29. Leach TJ, Mazzeo M, Chotkowski HL, Madigan JP, Wotring MG, et al. (2000) Histone H2A.Z is widely but nonrandomly distributed in chromosomes of Drosophila melanogaster. J Biol Chem 275: 23267–23272.
30. Siegrist SE, Doe CQ (2006) Extrinsic cues orient the cell division axis in Drosophila embryonic neuroblasts. Development 133: 529–536.
31. Bier E, Vaessin H, Younger-Shepherd S, Jan LY, Jan YN (1992) deadpan, an essential pan-neural gene in Drosophila, encodes a helix-loop-helix protein similar to the hairy gene product. Genes Dev 6: 2137–2151.
32. Straub T, Neumann MF, Prestel M, Kremmer E, Kaether C, et al. (2005) Stable chromosomal association of MSL2 defines a dosage-compensated nuclear compartment. Chromosoma 114: 352–364.
33. Clemson CM, Hall LL, Byron M, McNeil J, Lawrence JB (2006) The X chromosome is organized into a gene-rich outer rim and an internal core containing silenced nongenic sequences. Proc Natl Acad Sci U S A 103: 7688–7693.
34. Kurz A, Lampel S, Nickolenko JE, Bradl J, Benner A, et al. (1996) Active and inactive genes localize preferentially in the periphery of chromosome territories. J Cell Biol 135: 1195–1205.
36. Straub T, Gilfillan GD, Maier VK, Becker PB (2005) The Drosophila MSL complex activates the transcription of target genes. Genes Dev 19: 2284–2288. 37. Hirano T (2005) Condensins: organizing and segregating the genome. Curr Biol
15: R265–R275.
38. Bhat MA, Philp AV, Glover DM, Bellen HJ (1996) Chromatid segregation at anaphase requires the barren product, a novel chromosome-associated protein that interacts with Topoisomerase II. Cell 87: 1103–1114.
39. Henikoff S, Ahmad K, Platero JS, van Steensel B (2000) Heterochromatic deposition of centromeric histone H3-like proteins. Proc Natl Acad Sci U S A 97: 716–721.
40. Blower MD, Sullivan BA, Karpen GH (2002) Conserved organization of centromeric chromatin in flies and humans. Dev Cell 2: 319–330.
41. Gorman M, Franke A, Baker BS (1995) Molecular characterization of the male-specific lethal-3 gene and investigations of the regulation of dosage compensation in Drosophila. Development 121: 463–475.
42. Spradling AC, Rubin GM (1982) Transposition of cloned P elements into Drosophila germ line chromosomes. Science 218: 341–347.
43. Strukov YG, Wang Y, Belmont AS (2003) Engineered chromosome regions with altered sequence composition demonstrate hierarchical large-scale folding within metaphase chromosomes. J Cell Biol 162: 23–35.
44. Lyman LM, Copps K, Rastelli L, Kelley RL, Kuroda MI (1997) Drosophila male-specific lethal-2 protein: structure/function analysis and dependence on MSL-1 for chromosome association. Genetics 147: 1743–1753.
45. Gustafsson MG, Shao L, Carlton PM, Wang CJ, Golubovskaya IN, et al. (2008) Three-dimensional resolution doubling in wide-field fluorescence microscopy by structured illumination. Biophys J 94: 4957–4970.
46. Larschan E, Alekseyenko AA, Gortchakov AA, Peng S, Li B, et al. (2007) MSL complex is attracted to genes marked by H3K36 trimethylation using a sequence-independent mechanism. Mol Cell 28: 121–133.
47. Gelbart ME, Larschan E, Peng S, Park PJ, Kuroda MI (2009) Drosophila MSL complex globally acetylates H4K16 on the male X chromosome for dosage compensation. Nat Struct Mol Biol 16: 825–832.
48. Kind J, Akhtar A (2007) Cotranscriptional recruitment of the dosage compensation complex to X-linked target genes. Genes Dev 21: 2030–2040. 49. Sass GL, Pannuti A, Lucchesi JC (2003) Male-specific lethal complex of
Drosophila targets activated regions of the X chromosome for chromatin remodeling. Proc Natl Acad Sci U S A 100: 8287–8291.
50. Legube G, McWeeney SK, Lercher MJ, Akhtar A (2006) X-chromosome-wide profiling of MSL-1 distribution and dosage compensation in Drosophila. Genes Dev 20: 871–883.
51. Kumaran RI, Thakar R, Spector DL (2008) Chromatin dynamics and gene positioning. Cell 132: 929–934.
52. Marshall OJ, Marshall AT, Choo KH (2008) Three-dimensional localization of CENP-A suggests a complex higher order structure of centromeric chromatin. J Cell Biol 183: 1193–1202.
53. Wan X, O’Quinn RP, Pierce HL, Joglekar AP, Gall WE, et al. (2009) Protein architecture of the human kinetochore microtubule attachment site. Cell 137: 672–684.
54. Verschure PJ, van der Kraan I, Manders EM, Hoogstraten D, Houtsmuller AB, et al. (2003) Condensed chromatin domains in the mammalian nucleus are accessible to large macromolecules. EMBO Rep 4: 861–866.
55. Bates M, Huang B, Dempsey GT, Zhuang X (2007) Multicolor super-resolution imaging with photo-switchable fluorescent probes. Science 317: 1749–1753. 56. Christova R, Oelgeschlager T (2002) Association of human TFIID-promoter
complexes with silenced mitotic chromatin in vivo. Nat Cell Biol 4: 79–82. 57. Xing H, Vanderford NL, Sarge KD (2008) The TBP-PP2A mitotic complex
bookmarks genes by preventing condensin action. Nat Cell Biol 10: 1318–1323. 58. Baumgartner M, Dutrillaux B, Lemieux N, Lilienbaum A, Paulin D, et al. (1991) Genes occupy a fixed and symmetrical position on sister chromatids. Cell 64: 761–766.