IMPLEMENTATION ENABLERS FOR JUST IN TIME IN ICPI
Dr. Nitin Upadhye * Associate Professor, College of Business, University of Modern Sciences, Dubai
E-mail: [email protected]
Devendra Singh Awana
Asst. Professor – Department of Mechanical Engineering, Sunderdeep Engineering College, Ghaziabad, India
A B S T R A C T K E Y W O R D S
A R T I C L E I N F O
JIT, ISM, Lean Manufacturing, Packaging Industry, Waste elimination
Received 07 July 2014 Accepted 05 September 2014 Available online 1 December 2014
Indian Corrugated Packaging Industries (ICPI) have built up tough competition among the industries in terms of product cost, quality, product delivery, flexibility, and finally customer’s demand. As their customers, mostly OEMs are asking Just in Time deliveries, ICPI must implement JIT in their system. The term "JIT” as, it denotes a system that utilizes less, in terms of all inputs, to create the same outputs as those created by a traditional mass production system, while contributing increased varieties for the end customer. (Womack et al. 1990) "JIT" focuses on abolishing or reducing Muda (“Muda", the Japanese word for waste) and on maximizing or fully utilizing activities that add value from the customer's perspective. There is lack of awareness in identifying the right enablers of JIT implementation. Therefore, this study has tried to find out the enablers from the literature review and expert’s opinions from corrugated packaging industries and developed the relationship matrix to see the driving power and dependence between them. In this study, modeling has been done in order to know the interrelationships between the enablers with the help of Interpretive Structural Modeling and Cross Impact Matrix Multiplication Applied to Classification (MICMAC) analysis for the performance of Indian corrugated packaging industries.
Sandeep Mathur
systems is long-term survival. A manufacturing company’s survival in an increasingly competitive market closely depends upon its ability to produce highest quality product at lowest possible cost and in a timely manner with shortest possible lead-time. The booming Indian economy and a flourishing organized retail have raised the expectations that consumption of corrugated packaging will begin to expand again as the number and volume of goods packaged in corrugated increases. MNCs are demanding corrugated boxes of international standards and the pattern of buying the packaging is changing. Prices of corrugated sheet and converted boxes have remained low due to the overcapacity, manual operations and low productivity. Besides, transport constraints and high freight costs have meant that small to medium sized corrugated box plants are located near the customers.
The over 4000 corrugated board and sheet plants in India are highly labor intensive, employing over half a million people both directly and indirectly. The industry is converting about two million tons of kraft paper in to corrugated boxes. Factories are spread out in all parts of India, even in the remote industrially backward areas. This present scenario is already being challenged by the sweeping changes that are beginning to take shape. More and more in-line automatic plants are being set up, as corrugated box makers gear up to meet the new demands for high precision boxes with attractive graphics and large integrated production capacities. Strong competition and the high demands of consumer goods companies for just –in-time delivery together with high standards of product and service quality are turning the top end of corrugated-board box market in to a very tough place to be (Darley et.al. 2004).
Indian corrugated packaging industries have built up tough competition among the industries in terms of product cost, quality, product delivery, flexibility, and finally customer’s demand. To fulfill all these demands, ICPI are trying to improve their performance. But, there is lack of awareness in identifying the right enablers of business performance. Therefore, this study has tried to find out the enablers from the literature review and expert’s opinions from corrugated packaging industries and developed the relationship matrix to see the driving power and dependence between them. In this study, modeling has been done in order to know the interrelationships between the enablers with the help of Interpretive Structural Modeling and Cross Impact Matrix Multiplication Applied to Classification (MICMAC) analysis for the performance of Indian corrugated packaging industries.
2.0. JUST IN TIME
generate capital, bring in more sales, and remain competitive in a growing global market. The value stream is defined as "the specific activities within a supply chain required to design, order and provide a specific product or value" (Fawaz, 2003).
The term "JIT” as, it denotes a system that utilizes less, in terms of all inputs, to create the same outputs as those created by a traditional mass production system, while contributing increased varieties for the end customer (Womack et.al. 1990) "JIT" focuses on abolishing or reducing Muda (“Muda", the Japanese word for waste) and on maximizing or fully utilizing activities that add value from the customer's perspective. From the customer's perspective, value is equivalent to anything that the customer is willing to pay for in a product or the service that follows. So the elimination of waste is the basic principle of JIT production system. For manufacturing companies, this could involve any of the following: (Ohno, 1997)
Material: Convert all raw materials in to end products. Try to avoid excess raw materials and scrap.
Inventory: Keep constant flow to the customer and to not have idle material.
Over Production: Produce the exact quantity that customers need, and when they need it.
Labor: Get rid of unwanted movement of people.
Complexity: Try to solve problems the uncomplicated way rather than the complex way. Complex solutions tend to produce more waste and are harder for people to manage.
Energy: Utilize equipment and people in the most productive ways. Avoid unproductive operations and excess power utilization.
Space: Reorganize equipment, people, and workstations to get a better space arrangement.
Defects: Make every effort to eliminate defects.
Transportation: Get rids of transportation of materials and information that does not add value to the product.
Time: Avoid long set ups, delays, and unexpected machine down time.
Unnecessary Motion: Avoid excess bending or stretching and frequently lost items.
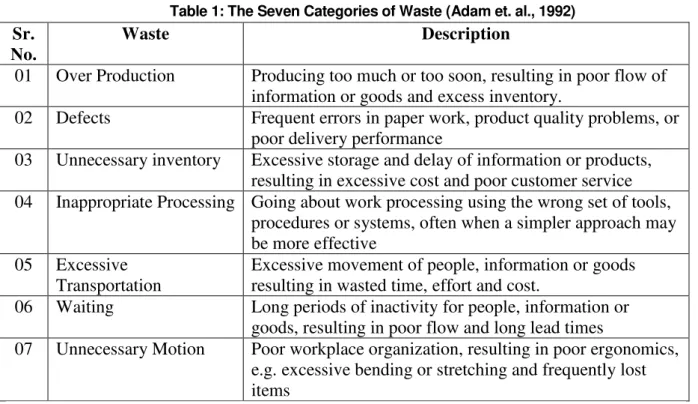
Table 1: The Seven Categories of Waste (Adam et. al., 1992)
Sr. No.
Waste Description
01 Over Production Producing too much or too soon, resulting in poor flow of information or goods and excess inventory.
02 Defects Frequent errors in paper work, product quality problems, or poor delivery performance
03 Unnecessary inventory Excessive storage and delay of information or products, resulting in excessive cost and poor customer service 04 Inappropriate Processing Going about work processing using the wrong set of tools,
procedures or systems, often when a simpler approach may be more effective
05 Excessive Transportation
Excessive movement of people, information or goods resulting in wasted time, effort and cost.
06 Waiting Long periods of inactivity for people, information or goods, resulting in poor flow and long lead times
07 Unnecessary Motion Poor workplace organization, resulting in poor ergonomics, e.g. excessive bending or stretching and frequently lost items
All the waste sources described above are related to each other and getting rid of one source of waste can lead to either elimination of, or reduction in others. Perhaps the most significant source of waste is inventory, work in process and finished parts inventory do not add value to a product and they should be eliminated or reduced. When inventory is reduced, hidden problems can appear and action can be taken immediately. There are many ways to reduce the amount of inventory, one of which is reducing production lot sizes, reducing lot sizes however, should be followed by a set up time reduction so as to make the cost per unit constant as the famous economic order quantity formula states (Fawaz, 2003) At Toyota, the concept of Single Minute Exchange of Dies (SMED) to reduce set up times; for instance, setup times in large punch presses could be reduced from hours to less than ten minutes. This has a big effort on reducing lot sizes. Another way to reduce inventory is by trying to minimize machine downtime (Shingo, 1997). This can be done by preventive maintenance. It is clear that when inventory is reduced other sources of waste are reduced too. For example, space that was used to keep inventory can be utilized for other things such as increase facility capacity. Also, reduction in setup times as a means to reduce inventory simultaneously saves time, thus is reducing time as a source of waste.
maintenance is one way to eliminate defects and scrap. Manufacturing parts that are fault free from the beginning has profound consequences for productivity (Cheng. & Podolsky, 1996).
There is no question that the elimination of waste is an essential ingredient for survival in today's manufacturing world. Companies must strive to create high quality, and low cost products that can get to the customers in the shortest time possible. There are sets of JIT components, tools, and techniques that were developed at Toyota and that can be utilized to eliminate or at least reduce the sources of waste. Lean manufacturing philosophy developed from JIT has been described as one, which seeks to eliminate unnecessary processes, to align processes in a continuous flow and to use resources in order to solve problems in a never-ending process (Upadhye et al. 2010)
3.0 IDENTIFICATION OF ISSUES
JIT as a management idea that attempts to eliminate source of waste by producing the right part in the right place at the right time (Nahmias, 1997). In this study, to identify the key enablers and to set up their relationship among enablers, brainstorming sessions were performed with the expert’s of corrugating packaging firm. Those sessions were conducting along with the ten managerial level experts of corrugating packaging firms. Previous and existing theory related to JIT implementation was distributed amongst the expert’s panel. Then, a session was conducted of brainstorming to identify key enablers from given literature and asked them to establish the inter-relationship among the enablers that how these particular enablers affect to each other. A total of nine key enablers were finalized related to JIT implementation and they are showing in table 2.
Table 2: Identification of Key JIT Enablers
J-1 Leadership: Leadership for successful JIT implementation includes clear vision and strategic initiatives by management, a good level of education and the willingness to support productivity improvement initiatives.
S.No. Key Enablers
J-1 Leadership
J-2 Produce to order (JIT)
J-3 Process improvement, reduction in cycle time and setup reduction J-4 Automation & material handling system
J-5 Customer satisfaction
J-2 Produce to order (JIT): Produce to order means that under JIT manufacturing actual order dictate what should be manufactured, So that the exact quantity is produced at the exact time that is required.
J-3 Process improvement, reduction in cycle time and setup reduction: Setup reduction and cycle time reduction is important indicator for process improvement. The capability of any organization is demonstrated by how flexible it is change between products to meet customer demand.
J-4 Automation & material handling system: Automation is an alternative to manual work owing to its numerous advantages. Waste identification and elimination in material handling system through JIT leads to lead time improvement; reduce throughput time reduction and minimization of rejections due to transportation
J-5 Customer satisfaction: Customer satisfaction is measure of the degree to which a product or service meets the customer’s expectations.
J-6 Use of Information Technology: Information Technology helps to minimize the wastage due to repetitive nature of work. It also save a lot of time, which is very crucial in today’s competitive world. A well planned information technology system for the business is must to implement JIT in any organization.
J-7 Involvement of employees: Entire work force is placed on teams formed to continuously improve quality in all aspects of an organization.
J-8 Total Quality Management: Organized, continuous process improvement activities involving an entire organization, managers and workers, in a totally integrated effort to improve performance at every level focusing on customer satisfaction.
J-9 Total Productive Maintenance: Total productive maintenance is a companywide maintenance system, which support sophisticated productions facilities. The dual goal of total productive maintenance is zero breakdowns and zero defects.
4.0 INTERPRETIVE STRUCTURAL MODELLING
The Interpretive Structural Modeling (ISM) process transforms unclear, poorly articulated mental models of systems in to visible, well defined models useful for many purposes. A set of different directly and indirectly related variables are structured in to a comprehensive systemic model. The model is so formed portrays the structure of a complex issue, a system of a field of study, in a carefully designed pattern implying graphics as well as words. ISM is interpretive as the judgment of the group decides whether and how the variables are related. It is structural as on the basis of relationship, an overall structure is extracted from the complex set of variables. It is a modeling technique as the specific relationships and overall structure are portrayed in a graphical model.
system or a field of study, in a carefully designed pattern implying graphics as well as words [Faisal, 2006). Therefore, we can say that ISM is not only provides insights into the relationships between the various enablers but also helps develop the hierarchy based on the importance of each enabler and provides a visual representation of the scenario. The method is interpretative as the judgment of the group decides whether and how the variables are related. It is structural as the basis of relationship is an overall structure that is extracted from a complex set of variables. It is a modeling technique as the specific relationships and overall structure is portrayed in a digraph model. ISM has been applied in various fields.
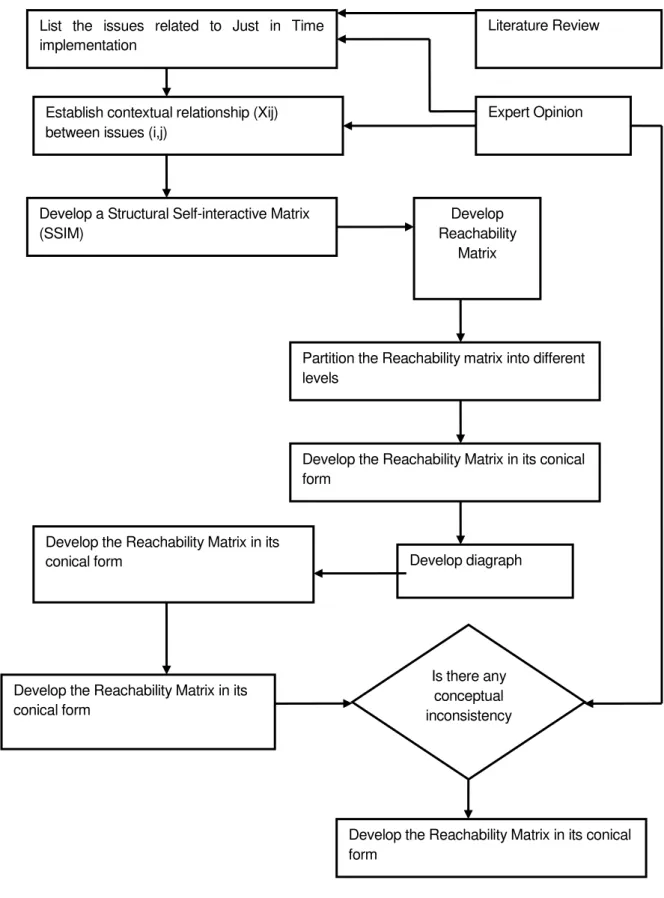
4.1 Steps Involved in Interpretive Structural Modeling
The steps involved in ISM are listed below and shown in Fig. 5.1:
STEP 1: Enablers affecting the system under consideration are listed. A survey of group problem solving technique can be used for identification of the enabler related to the defined problem.
STEP 2: From the step 1, a relative relationship is pointed out among the enablers with respect to which pairs of enabler would be examined.
STEP 3: Structural self interaction matrix (SSIM) is developed for enablers, which shows pair-wise relations between enablers.
STEP 4: Initial reachability matrix is formed on the basis of structural self interaction matrix and checked for transitivity to go in to final reachability matrix.
STEP 5: After developing the final reachability matrix, next partitions are done in order to find hierarchy of each enabler.
STEP 6: Next, conical matrix is developed from the partitioned reachability matrix by clubbing together of enablers according to their level position.
4.2 Structural Self-Interaction Matrix (SSIM)
Interpretive structural modeling implies about expert’s session and their opinions on various process like brainstorming and nominal technique in developing ideal relationship between the enablers. The enablers for JIT implementation were identified through the literature review. The systematic analysis of the enablers is expected to be of great value for the effective implementation of the JIT. A study of the linkages among
List the issues related to Just in Time implementation
Literature Review
Expert Opinion
Develop a Structural Self-interactive Matrix (SSIM)
Develop Reachability
Matrix
Partition the Reachability matrix into different levels
Develop the Reachability Matrix in its conical form
Develop diagraph
Develop the Reachability Matrix in its conical form
Develop the Reachability Matrix in its conical form
Develop the Reachability Matrix in its conical form
Is there any conceptual inconsistency Establish contextual relationship (Xij)
between issues (i,j)
the enablers can also help in thorough understanding of the enablers relating to the various enablers, and also the role of the various agencies involved, and an appreciation of their problems. The idea is to develop an integrated approach. There is also a need for a structural relationship among the enablers, as the enablers considered together may seem equally important and sometimes overriding each other. Such a situation makes it difficult to understand the situation clearly and decide a clear cut strategy. The development of structure will assist top management and decision makers in effective planning, scheduling, monitoring and control. For analyzing the JIT enablers, which helps in the JIT implementation, a contextual relationship “helps to achieve” is selected. This means that one enabler will help in achieving another enabler. Based on this the contextual relationship is developed.
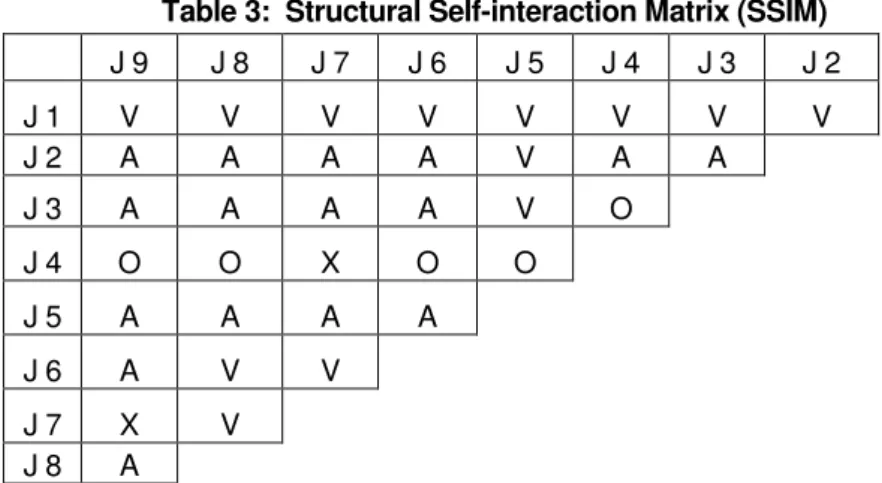
The group of experts from corrugating packaging industries decided after brainstorming sessions about the nature of contextual relationships among the enablers. After identifying nine key enablers through brainstorming technique, appropriate relationships amongst key enablers are achieved. The four symbols (V, A, X, O) have been used to denote the direction of relationship between enablers (i and j) during the analysis of the enablers in developing SSIM (Table 3).
V – Enabler i will help to achieve enabler j; A – Enabler j will help to achieve enabler i;
X – Enabler i and j will help to achieve each other; and O – Enabler i and j are unrelated.
Table 3: Structural Self-interaction Matrix (SSIM)
J 9 J 8 J 7 J 6 J 5 J 4 J 3 J 2
J 1 V V V V V V V V
J 2 A A A A V A A
J 3 A A A A V O
J 4 O O X O O
J 5 A A A A
J 6 A V V
J 7 X V
J 8 A
4.3 Development of Reachability Matrix
If the (i, j) entry in the SSIM is V, the (i, j) entry in the reachability matrix becomes 1 and the (j, i) entry becomes 0;
If the (i, j) entry in the SSIM is A, the (i, j) entry in the reachability matrix becomes 0 and the (j, i) entry becomes 1;
If the (i, j) entry in the SSIM is X, the (i, j) entry in the reachability matrix becomes 1 and the (j, i) entry also becomes 1; and
If the (i, j) entry in the SSIM is O, the (i, j) entry in the reachability matrix becomes 0 and the (j, i) entry also becomes 0.
Table 4: Initial Reachability Matrix
Next step is to get final reachability matrix which is achieved by incorporating the transitivity. Basically, transitivity concept is introduced for this purpose, and few cells of the initial reachability matrix are filled by inference. After incorporating the transitivity concept in table 4, the final reachability matrix is developed and is depicted in table 5. Moreover, the dependence and driving power are calculated by summing up the number of 1s in the columns and rows respectively. A final reachability matrix (Table5) is drawn as under:
Table 5: Final Reachability Matrix
J-1 J-2 J-3 J-4 J-5 J-6 J-7 J-8 J-9
J-1 1 1 1 1 1 1 1 1 1
J-2 0 1 0 0 1 0 0 0 0
J-3 0 1 1 0 1 0 0 0 0
J-4 0 1 0 1 0 0 1 0 0
J-5 0 0 0 0 1 0 0 0 0
J-6 0 1 1 0 1 1 1 1 0
J-7 0 1 1 1 1 0 1 1 1
J-8 0 1 1 0 1 0 1 1 0
J-9 0 1 0 0 1 1 0 1 1
J-1 J-2 J-3 J-4 J-5 J-6 J-7 J-8 J-9
J-1 1 1 1 1 1 1 1 1 1
J-2 0 1 0 0 1 0 0 0 0
J-3 0 1 1 0 1 0 0 0 0
J-4 0 1 0 1 0 0 1 0 0
J-5 0 0 0 0 1 0 0 0 0
J-6 0 1 1 0 1 1 1 1 0
J-7 0 1 1 1 1 1* 1 1 1
J-8 0 1 1 0 1 0 1 1 0
4.4 Level Partitions
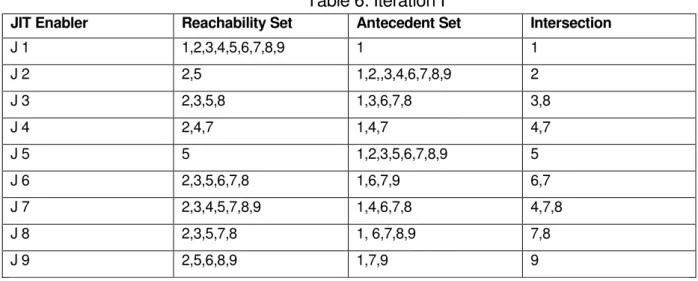
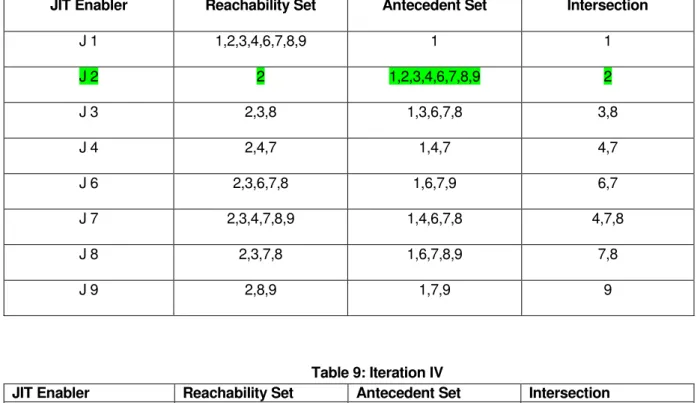
The various levels of this analysis (Table 6 to 12) involve the enabler reachability set, antecedent set and intersection set. The reachability set consists of the enabler itself and the other enabler, which it may help achieve. The antecedent set consists of the enabler itself and other enabler, which may help achieving it. Thereafter, intersection of these two sets is derived for all enablers. One by one the enablers having the same reachability set and intersection set are eliminated during consecutive iteration. Having identified the levels of the enablers through a number of iterations, the relationship between the enablers is drawn indicating the serial number of the enablers and the direction of the relation with the help of an arrow. The digraph is examined to eliminate transitivity of relationships. The final model arrived at is represented by fig. 2.
Table 6: Iteration I
JIT Enabler Reachability Set Antecedent Set Intersection
J 1 1,2,3,4,5,6,7,8,9 1 1
J 2 2,5 1,2,,3,4,6,7,8,9 2
J 3 2,3,5,8 1,3,6,7,8 3,8
J 4 2,4,7 1,4,7 4,7
J 5 5 1,2,3,5,6,7,8,9 5
J 6 2,3,5,6,7,8 1,6,7,9 6,7
J 7 2,3,4,5,7,8,9 1,4,6,7,8 4,7,8
J 8 2,3,5,7,8 1, 6,7,8,9 7,8
J 9 2,5,6,8,9 1,7,9 9
Table 7: Iteration II
JIT Enabler Reachability Set Antecedent Set Intersection
J 1 1,2,3,4,5,6,7,8,9 1 1
J 2 2,5 1,2,,3,4,6,7,8,9 2
J 3 2,3,5,8 1,3,6,7,8 3,8
J 4 2,4,7 1,4,7 4,7
J 5 5 1,2,3,5,6,7,8,9 5
J 6 2,3,5,6,7,8 1,6,7,9 6,7
J 7 2,3,4,5,7,8,9 1,4,6,7,8 4,7,8
J 8 2,3,5,7,8 1,6,7,8,9 7,8
Table 8: Iteration III
JIT Enabler Reachability Set Antecedent Set Intersection
J 1 1,2,3,4,6,7,8,9 1 1
J 2 2 1,2,3,4,6,7,8,9 2
J 3 2,3,8 1,3,6,7,8 3,8
J 4 2,4,7 1,4,7 4,7
J 6 2,3,6,7,8 1,6,7,9 6,7
J 7 2,3,4,7,8,9 1,4,6,7,8 4,7,8
J 8 2,3,7,8 1,6,7,8,9 7,8
J 9 2,8,9 1,7,9 9
Table 9: Iteration IV
JIT Enabler Reachability Set Antecedent Set Intersection
J 1 1,3,4,6,7,8,9 1 1
J 3 3,8 1,3,6,7,8 3,8
J 4 4,7 1,4,7 4,7
J 6 3,6,7,8 1,6,7,9 6,7
J 7 3,4,7,8,9 1,4,6,7,8 4,7,8
J 8 3,7,8 1,6,7,8,9 7,8
J 9 8,9 1,7,9 9
Table 10: Iteration V
JIT Enabler Reachability Set Antecedent Set Intersection
J 1 1,6,7,9 1 1
J 6 6,7 1,6,7,9 6,7
J 7 7,9 1,6,7 7
J 8 7,8 1,6,7,8,9 7,8
J 9 9 1,7,9 9
Table 11: Iteration VI
JIT Enabler Reachability Set Antecedent Set Intersection
J 1 1,7 1 1
Table 12: Iteration VII
JIT Enabler Reachability Set Antecedent Set Intersection
J 1 1 1 1
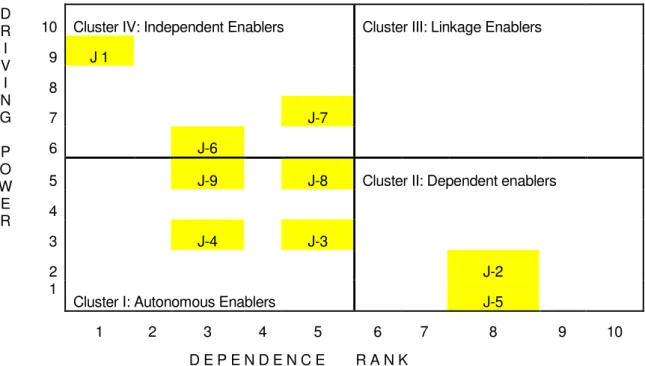
4.5 MICMAC Analysis
The JIT implementation enablers are classified into four groups as autonomous enablers, dependent enablers, linkage enablers, and independent enablers on the basis of their driving power and dependencies, as shown in Fig. 5.2. The first group is of autonomous enablers that have a weak driving power and weak dependence power. The enablers are relatively disconnected from the system. They may have only a few links. Enablers having strong dependence and weak driver are called dependent enablers. The third group consists of linkage enablers that have strong driving and dependence power. Any action on these enablers will have an impact on the other enablers and also a feedback effect on themselves, which may amplify any moves or measures. The fourth group consists of independent enablers that have strong driving power and weak dependence, these enablers condition all the other enablers, while being unaffected by them in return.
D R I V I N G
P O W E R
10 Cluster IV: Independent Enablers Cluster III: Linkage Enablers
9 J 1
8
7 J-7
6 J-6
5 J-9 J-8 Cluster II: Dependent enablers
4
3 J-4 J-3
2 J-2
1
Cluster I: Autonomous Enablers J-5
1 2 3 4 5 6 7 8 9 10
D E P E N D E N C E R A N K
Figure 2: Cluster of Enablers in The Implementation of JIT
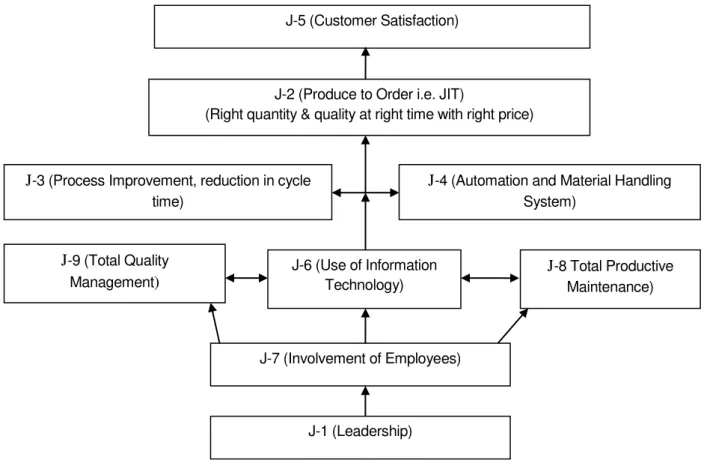
final digraph is formed after removing the transitivity’s. This final digraph is converted into the ISM-based model for the implementation of JIT (Figure 3).
Figure 3: Interpretive Structural Model of Implementation Enablers of JIT
5.0 DISCUSSION
It is important to know the levels of enablers are JIT implementation enablers for the successful implementation of JIT. The ISM emphasizes that J-1 (Leadership) along with J-7 (Involvement of employees) are the most important enabler due to their high driving power and low dependence among all the JIT enablers. These are the basic enablers, who help to develop organization where JIT can be implemented; hence top management must pay its full attention to develop a bond of trust between management and employees with a visionary leadership. These enablers are positioned at the lowest level in the hierarchy of the ISM-based model.
The enablers J-6 (Use of information technology), J-8 (Total Quality Management), and J-9 (Total productive Maintenance), which are at the fourth level in the model with highest driving power are known as ’strategic enablers’. These enablers play a key role in the JIT implementation. These enablers require greater attention from the top management.
The enablers J-3 (Process improvement, reduction in cycle time, setup reduction) and J-4 (Automation and Material Handling system) are at middle level. These enablers help to achieve Organizational goals & objectives. The driving power and dependence rank of these enablers is medium, so require attention from both level of management
J-5 (Customer Satisfaction)
J-2 (Produce to Order i.e. JIT)
(Right quantity & quality at right time with right price)
J-4 (Automation and Material Handling System)
J-3 (Process Improvement, reduction in cycle time)
J-6 (Use of Information Technology)
J-9 (Total Quality Management)
J-8 Total Productive Maintenance)
J-7 (Involvement of Employees)
i.e. top and middle. These enablers drive organizations to develop the required structural model & integration mechanisms among them. The enablers J-2 ((Produce to Order - JIT i.e. Right quantity & quality at right time with right price) will lead to J-5 (Customer Satisfaction).
6.0 KEY CONCLUSIONS & FUTURE DIRECTIONS
The key enablers are essential in JIT manufacturing and considerably challenges for policy makers and managers in Indian corrugated packaging industries. Some important enablers have been shown up in this chapter and put in to an interpretive structural modeling model to explore the relationship among them. Key enablers need to evaluate for the success and efficient JIT in Indian corrugated packaging industries. The ISM methodology was used to establish the driving power and the dependencies of the enablers identified for JIT implementation. It is clear from
ISM proves that all the nine enablers play an important role in the successful implementation of JIT. In this research only nine enablers have been used to develop the ISM model, but more JIT enablers can be included to develop the relationship among them using the ISM methodology.
7.0 LIMITATIONS OF THE STUDY
This research paper is based on the expert opinions of ten persons with a focus on Indian corrugated packaging industries. The limitation of this study is that it is not based on a wide cross-section of persons representing the global corrugated packaging industries. The ISM model developed has not been statistically validated
REFERENCES:
Abdullah Fawaz, 2003. Lean Manufacturing tools and Techniques in the process industry with a focus on steel, Dissertation of department of Industrial Engineering, Pennsylvania,University of Pittsburgh,
Cheng.T.C.E., S. Podolsky, 1996. Just-in-Time manufacturing: an introduction .(2nd ed.), London, Chapman and Hall.
Darley,V. Sanders,D. & Tessin,P.V., .2004, “An agent-based model of a corrugated box factory: The tradeoff between finished finished-goodsstock and on-time-full delivery” In:
Faisal, M N., Banwet, D K., and Shankar, Ravi, 2006. “Supply chain risk mitigation: modeling the enablers”, Business Process Management, Volume 12, Issue 4, Pages 535-552
Nahmias, S., 1997. Production & Operations Analysis. Mcgraw-Hill , Inc.
Ohno, T., 1997. Toyota production system: Beyond large scale production. Portland, Productivity Press.
Sage, A. P., 1977. “Interpretive structural modeling: Methodology for large scale systems.“ New York, McGraw-Hill
Shingo, S., 1997. A study of Toyota production system from an industrial engineering point views. Cambridge, MA, Productivity press.
Upadhye, N., Deshmukh, S.G. and Garg, S “Lean Manufacturing in Biscuit Manufacturing Plant: A Case” International Journal of Advanced Operations Management (IJAOM), 2010 - Vol. 2, No.1/2 pp. 108 – 139.
Upadhye, N., Deshmukh, S.G. & Garg, S. “Interpretive Structural Modeling for Implementation issues of Lean Manufacturing System” International Journal of Modeling in Operations Management - IJMOM (Inderscience Publication) Vol. 1, No. 4., pp. 311-343.
Warfield, J. W., 1974. Developing interconnected matrices in structural modeling. IEEE transcript on systems, Volume 4, Issue 1, Pages 51-58