Scope of Value Stream Mapping to Initiate Lean Manufacturing: An Analysis
in the Apparel Industry of Bangladesh
Mimnun Sultana*
School of Business and Economics, United International University, Road-8/A(Old 15), Satmasjid Road, Dhanmondi, Dhaka-1209, Bangladesh,
E-mail: mimnun@bus.uiu.ac.bd
M. M Nazrul Islam
Deputy Managing Director, Manvill Styles Limited, The Manvill Trading, 728, South Shyampur, Hemayetpur, Savar, Dhaka, E-mail: mallick.nazrul@gmail.com
A B S T R A C T K E Y W O R D S
A R T I C L E I N F O
Value Stream Mapping, Lean,
Apparel.
Received 09 March 2013 Accepted 04 May 2013 Available online 30 June 2013
Recently, Bangladesh readymade garments sector has started the
trend of implementing ‘lean manufacturing’. To remain
competitive in the global market the most important task for garments industry is to reduce the lead time which is also important for long-term stable development. A headlong rush to reduce lead time by becoming lean has created urgency for researchers and practitioners to apply new tools and techniques for dictating wastages. This research addresses the application of value stream mapping in garments industry to implement lean manufacturing. Value stream mapping is different than conventional recording approaches as it helps in the visualization of Material Flow, Information Flow, cycle times and utilization of resources. With the assurance of effective integration and communication, lean systems can be achieved with better efficiency. This research will stand as a benchmark to implement lean for other garment industries in Bangladesh.
________________________________ * Corresponding Author
1. Background of the study
“Readymade garment industry started in the late 1970s, expanded heavily in the 1980s and
boomed in the 1990s”. Bangladesh garments goes to marks and Spencer. The quick expansion
of the industry was possible because of the following unique nature of the industry such as the less complicated (easy to transfer) technology, cheap and easily operating machineries (sewing machines) and a large cheap female labor. In global apparel business, Bangladesh contributes less than 5% which consist 75% of total export earnings in our country (BGMEA, 2007). By the
coming years, China will lose their competitive advantage so it’s high time to tap the
21
Analysis of the internal and external environment suggests eliminating inefficiencies and irregularities
distinctively lessening production lead time and wastages from the country’s apparel production and
exporting processes. Under the highly competitive environment, the garment industry has numerous opportunities for improvement using lean principles (Mercado, 2007). This is mainly because of the nature of operation of the export-oriented RMG firms. The improvement of deep-level competitiveness through a reduction in total “production and distribution” time will improve surface-level competitiveness by reducing lead time.
This study analyzes several aspects of a garments manufacturing system as either normal mass production model (mass production) or as lean. The article highlights the following aspects:
•The first activity of the research project team was to gain a better understanding of the overall process
flow of garments industry.
•To visualize the implementation of value stream mapping as an identification tool for the common value added and non value added activities in apparel production line
•To analyze the issues of processing time, retention time, product family identification, production lead
time as a part of value stream mapping.
1. Literature Review
Wikipedia says “Lean is the set of tools that assist in the identification and steady elimination of waste (muda), the improvement of quality, and production time and cost reduction. The Japanese terms from Toyota are quite strongly represented in lean which has a number of tools to solve the trouble of waste
disposal. The tools include continuous process improvement (kaizen), the ‘5 Whys’ and mistake-proofing (poka-yoke), Just in Time (JIT) etc. The majority purpose is process improvement at the system level. Effective business strategy and management information systems are required for instilling proper mapping and continuous wastes dictation programs. Lean manufacturing is most frequently associated with elimination of seven wastes (Shah and Ward, 2007). The purpose of implementing it is to increase productivity, reduce lead time and cost, and improve quality (Karlsson and Ahlstrom, 1996). Under the highly competitive environment, the garment industry has numerous opportunities for improvement using lean principles (Mercado, 2007). Now, many countries have started to practice lean tools in the garment industry and observed tremendous improvement (Mazany, 1995). Rother and Shook (1999) and Pavnaskar et al. (2003) said that, Value Stream Mapping (VSM) is a functional method aimed at
recognizing production systems with lean vision. “A value stream is a collection of all actions value added
as well as non value added that are required to bring a product or group of products that use the same resources through the main flows, from raw material to the arms of customer” (Rother and Shook, 1999).
Jones and Womack (2000) define value stream mapping as‘the simple process of directly observing the
flows of information and materials as they now occur summarizing them visually and then envisioning a
future state with much better performance’. Value stream mapping originally developed by Toyota is used
to first map the current state and then to identify the sources of waste and to identify lean tools to eliminate the waste. Value steam maps show the process in a normal flow format to plan and meet the
customer’s normal demands. The typical VSM is called a “stock to dock” or “door to door” value stream
22
overall optimization of the entire value stream. Specific value stream evaluations and action items include identifying the target product, product family, or service, drawing a current state value stream map which shows the shop floor current steps, delays, and information flows required to deliver the target product or service. This may be a production flow (raw materials to consumer) or a design flow (concept to launch). There are 'standard' symbols and performance measures for representing supply chain entities. VSM also redesigns process to reduce waste and prepare a future state value steam map to work toward the future state condition. As a quantitative tools for analyzing non-value added steps, lead time, the amount of inventory etc., the power of value stream mapping persist to visualize more than just the single-process level, to observe the sources of waste, to offer a common language for talking about manufacturing processes, to formulate decisions about the flow apparent, to form the basis of an implementation plan, to show the linkage between the information flow and the material flow.
2. Methodology
The methodology of the research was based on theory and process observation to apply value stream mapping in garments sector and this research used empirical as well as quantitative information from thirteen (13) renowned garments industries as Ananta, IDS, Standard, jamona, Panash, Helicon, Apex, Adury, DBL, Hoplun, PN Composite, Palmal, Radial group of Bangladesh implementing lean. Non value added operations were identified through lead time which was calculated from processing time (where pieces suppose to flow continuously pertaining Value and non value added) and retention time (Materials staging before 1st process or between previous and next processes). The future state mapping or recommendations have been set up discussing with the industries as mentioned.
4. Steps of value stream mapping for apparel industry
Lean is not a one-size-fits-all recipe. Instead of trying to apply the original Toyota Production System, the precursor of the lean philosophy, each garment factory attempting to go lean must custom design a lean roadmap. This unique research is designed specifically for guiding garment industry on the lean journey to learn about the application of lean principles and concepts’ all elements and tools of the lean approach from value stream mapping are covered.
Lean is about eliminating waste. Before eliminating, wastes must be visualized and identified. Without identification, nothing can be targeted for elimination. Furthermore without proper identification wastes remain and add cost. Composition of Value Stream wastes at three levels such as in the materials and information flow through the processes, in the set up and function of process flow and finally in the operations within each process. The steps in value stream mapping as mentioned earlier is explained below:
4.1 Product family identification
The purpose of product family identification is to identify which product family would result in the maximum business impact after improvement. A product family is typically a group of products that share a common processing sequence (cutting, printing, embroidery, sewing, washing and finishing) and, in some cases, the same type of machinery. Product family is identified from the total produced time for all products. The percentage of production time (already produced) for each product is calculated from the given formula as:
Produced time for specific product=Percentage % of Produced time/ Total produced time for all products
23
for value stream mapping. The benefit of product family identification can be explained by the Pareto principle (also known as the 80-20 rule, the law of the vital few) which states that, for many events, roughly 80% of the effects come from 20% of the causes.
4.2 Current state mapping
Once the target product family was chosen, the next activity will be value stream mapping (VSM) of
the factory’s current state. Current state follow a product’s production (materials) path from beginning to
end, then draw a visual representation of every process in the material & information flows including materials retention which will demonstrate the throughput time of first bundle from door to door. The VSM tool allows a visual representation of value streams to help identify and categorize the wastes in the current state. This map is used to plan actions to eliminate the wastes and obtain the future state.
Fusing Fusing Spreading
Spreading Pre CuttingPre Cutting Sewing/ Finishing Sewing/
Finishing Band Knife
Band Knife
WIP WIP WIP
Storage WIP
Excessive Space, Unnecessary Workers, Retention, Transport, Inventories Materials and Information Flow
WIP
Value Stream Mapping
Excessive Space, Lack of Balancing, WIP, Workers waiting, Line set ups, Overproduction, Excess motions, Underutilized equipment,
Delays, Excessive handling, Unnecessary activities etc. Operations Scanning
& Process Razing
WASTE
WASTE
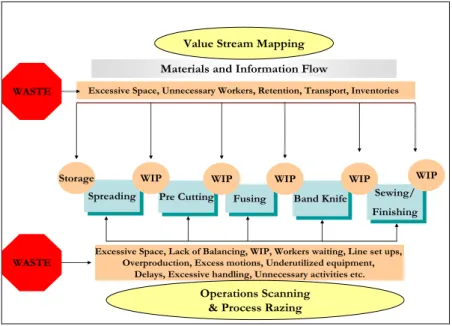
Figure 1: Garments production process and VSM
Source: DCG-ASDA/GEORGE Lean Project, 2011
Figure 1 explains an ongoing process of garments industry which clarifies standardized production process and application of VSM to detect the types of wastes. Process Razing is the most comprehendible method for reducing manpower on production lines. Operation Scanning is used to reduce cycle time and overstaffing through the elimination of wasteful motions or through the combination and
simplification of targeted operations within a given process. Also, it serves to eliminate motions between team members to synchronize cycle time. It’s an elemental or micro-motion analysis of one single operation-one worker such as Sewing operator or group of workers on one single operation.
4.3 Future state mapping
24
5 Findings and analysis
5.1 Current state mapping, Lead time
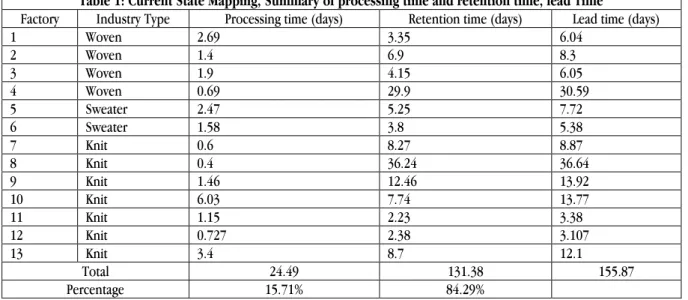
Time-line is used to identify the value-adding steps, as well as wastes, in the current system. The comparison between the processing times and the retention time (calculated as Available
Capacity/Customer Demand) is a preliminary measure of the value and waste. This retention time is mostly used as an ideal time for each operation to achieve. Based on the analysis of the Current State Map, one then develops a Future State Map by improving the value-adding steps and eliminating the non-value adding steps (waste).
Lead Time = Processing time + Retention Time
Percentage of processing time or retention time=Total Processing time or Total Retention time/ Total Lead Time
Table 1: Current State Mapping, Summary of processing time and retention time, lead Time
Factory Industry Type Processing time (days) Retention time (days) Lead time (days)
1 Woven 2.69 3.35 6.04
2 Woven 1.4 6.9 8.3
3 Woven 1.9 4.15 6.05
4 Woven 0.69 29.9 30.59
5 Sweater 2.47 5.25 7.72
6 Sweater 1.58 3.8 5.38
7 Knit 0.6 8.27 8.87
8 Knit 0.4 36.24 36.64
9 Knit 1.46 12.46 13.92
10 Knit 6.03 7.74 13.77
11 Knit 1.15 2.23 3.38
12 Knit 0.727 2.38 3.107
13 Knit 3.4 8.7 12.1
Total 24.49 131.38 155.87
Percentage 15.71% 84.29%
Source: DCG-ASDA/GEORGE Lean Project, 2011
Figure 2: Current State Processing andRetention Time
25
activities which create more customers value (Michael Porter) and which change the material state with right first time.
5.2 Steps to improve current state:
The basic steps to improve the current state mapping includes 1. Identifying the Process Loops
2. Prioritizing the Process Loops
3. Tying Priority to Key Performance Indicators 4. Establishing the Criteria for Prioritization 5. Prioritizing the Work within Each Loop 6. Presenting the Maps to the Workforce
7. Presenting the Maps to the Steering Committee 8. Assigning a Value Stream Manager
9. Attacking the Action Plan
5.3 Improvement of current state by prioritizing KPIs in garments industry
If inefficient process is allowed to continue, it results in the accumulation of no-value-added work, which is not covered in the price the customer pays for the product, and therefore increases production costs. To identify the wastages through VSM, the current state of the following measures will be considered for future state development as key performance indicators (KPI).
Overproduction is probably the most common form of waste in a garments environment. The fear of
absenteeism, potential machine breakdowns, anticipated rework and scrap, and ‘not looking busy’ will
generally cause operators to overproduce. Line supervisors and managers cannot always control absenteeism and employee turnover, and build product ahead of schedule just in case they are short on employees the following day.
Machine breakdown occurs because many companies either have a poor preventive maintenance program or continually purchase equipment that is cheap and unreliable. Rather than fixing the equipment issues,
operators prepare for possible equipment malfunctions by producing more product than is required, “just in case.” Typically, the same unreliable machines are unable to yield the required tolerances for fit, form,
and function, so rework and scrap become standard procedures.
Lead time or waiting occurs when all manufacturing processes are out of synchronization, causing an operator to be idle. Lack of parts, work content imbalances, inaccurate standards and methods, long setup times, bad equipment, poor communication, and rejects all create wait time.
In any and all cases, reducing work in process and inventory will lower costs tremendously. Inventory on the assembly line should be kept at a minimum. After identifying the parts necessary for specific workstations, proper quantities should be set. Every company has different volumes with multiple part
configurations. Part quantities should be established based on organization’s needs.
Wasted motion is any movement that does not add value to the product. Wasted motion does not only apply to the production line; moving equipment, unnecessary reaching, looking for parts and tools, confusing standards, walking to and from maintenance, poor visual management, floor layout, and improper work content order are all wasted motions.
26
instructions, and the inability to hold people accountable for continuous mistakes. Rejects can cause line stoppages, requiring operators to rework product that should have been manufactured correctly the first time.
Lastly, one major flaw in today’s management is the inability to identify individual employee skill sets
and then properly utilize those skills to effectively balance their workloads. Not utilizing individual employee potential or placing employees in positions where they feel uncomfortable and are likely to make errors are wasteful decisions, both of which impact quality and productivity, creating waste issues that will lead to additional waste: the domino effect.
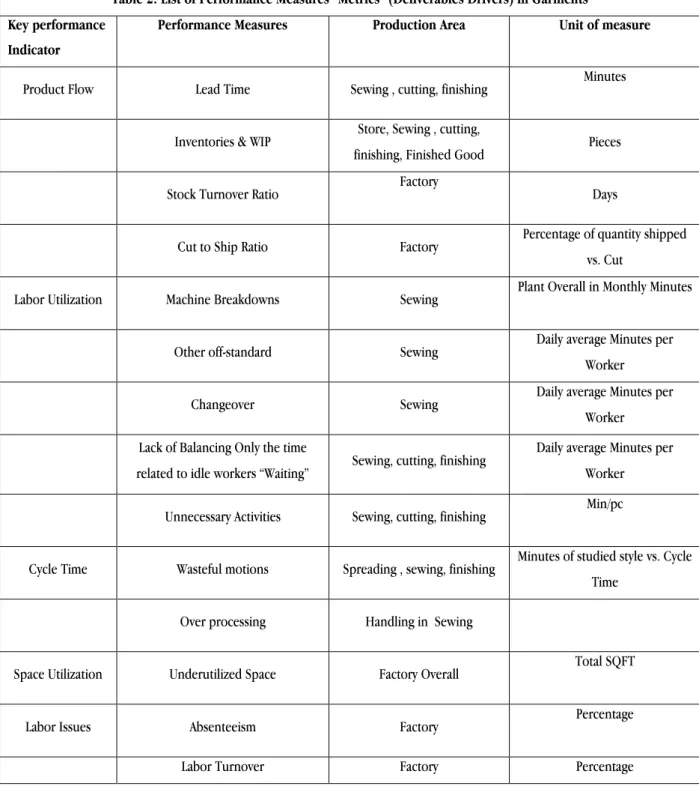
Table 2: List of Performance Measures “Metrics” (Deliverables Drivers) in Garments Key performance
Indicator
Performance Measures Production Area Unit of measure
Product Flow Lead Time Sewing , cutting, finishing Minutes
Inventories & WIP Store, Sewing , cutting,
finishing, Finished Good Pieces
Stock Turnover Ratio Factory Days
Cut to Ship Ratio Factory Percentage of quantity shipped
vs. Cut
Labor Utilization Machine Breakdowns Sewing Plant Overall in Monthly Minutes
Other off-standard Sewing Daily average Minutes per
Worker
Changeover Sewing Daily average Minutes per
Worker
Lack of Balancing Only the time
related to idle workers “Waiting” Sewing, cutting, finishing
Daily average Minutes per
Worker
Unnecessary Activities Sewing, cutting, finishing Min/pc
Cycle Time Wasteful motions Spreading , sewing, finishing Minutes of studied style vs. Cycle
Time
Over processing Handling in Sewing
Space Utilization Underutilized Space Factory Overall Total SQFT
Labor Issues Absenteeism Factory Percentage
27
Source: DCG-ASDA/GEORGE Lean Project, 2011
5.4 Future State mapping, Lead Time
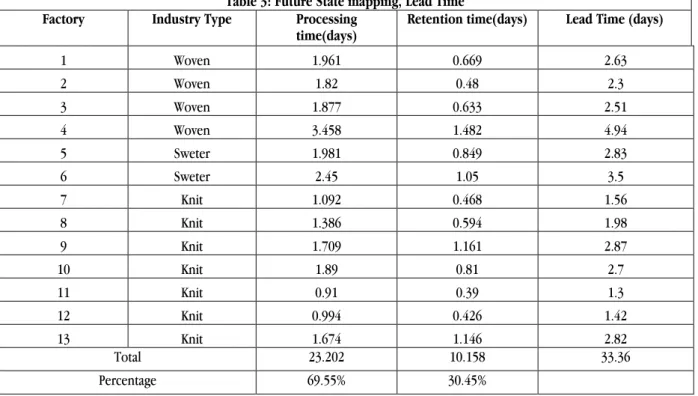
Using the chart of deliverables, the ratio of potential improvement is calculated by identifying the value added and the elimination of waste at100%. The future state is mapped and the table value is achievable if the waste is properly handled.
Table 3: Future State mapping, Lead Time
Factory Industry Type Processing
time(days)
Retention time(days) Lead Time (days)
1 Woven 1.961 0.669 2.63
2 Woven 1.82 0.48 2.3
3 Woven 1.877 0.633 2.51
4 Woven 3.458 1.482 4.94
5 Sweter 1.981 0.849 2.83
6 Sweter 2.45 1.05 3.5
7 Knit 1.092 0.468 1.56
8 Knit 1.386 0.594 1.98
9 Knit 1.709 1.161 2.87
10 Knit 1.89 0.81 2.7
11 Knit 0.91 0.39 1.3
12 Knit 0.994 0.426 1.42
13 Knit 1.674 1.146 2.82
Total 23.202 10.158 33.36
Percentage 69.55% 30.45%
Source: DCG-ASDA/GEORGE Lean Project, 2011
28
Figure 3: Future State Processing andRetention Time
5.5 Future State mapping, Deliverable Drivers
Similar to lead time VSM has been used to identify the current state and future state mapping of the key performance indicators or deliverable drivers of the garments industry. The below summarized data of table 4 gives a general view of the key performance indicator, current and future state calculated from the information of renowned garments factories.
Table 4: Future State mapping, Deliverable Drivers
KPI Unit of Measure Current State Future State
Labor Utilization Percentage 45% 64%
Space Utilization Pieces/SQFT/Day 0.34 1.20
Productivity Daily Pieces 27998 37769
Right First Time Percentage 88% 96%
Stock turnover ratio Days 26.80 13.57
Cut/knit to Ship Ratio Percentage 96% 99%
Lead Time Minutes 7102 2457
WIP & Inventory Piece 1253574 858461
Efficiency Percentage 45% 66%
Balancing ratio Percentage 62% 84%
Source: DCG-ASDA/GEORGE Lean Project, 2011
6. Conclusion
29
which are necessary to gather the information for the value stream maps. The prioritization and action must follow the VSM. In short, there needs to be a management presence in the value stream map construction process. However, beyond the advantages, VSM fails to handle multiple products that do not have identical maps and tends to bias a factory designer to consider only continuous flow, assembly line layouts, kanban-based Pull scheduling, etc. that are suitable mainly for high volume and low variety
manufacturing systems. VSM lacks the capability, due to the manual process of creation, for rapid
development and evaluation of multiple “what if” analyses required to prioritize different alternatives for
improving a Current State Map when time and/or budget constraints exist. Finally, this research has the proof of advantages, feasibility and applicability of value stream mapping which will stand as a benchmark to implement lean for other garment industries in Bangladesh. We hope that this paper contains its worth for practitioners in the garment industries.
7. References
Amar S. Patil, 2002, Incorporating Environmental Index as Waste into Value Stream Mapping, Master of Science Thesis, B. E., Mumbai University, Mumbai.
Charles Dagher, 2010, Productivity and Social Enhancement Project – Bangladesh, GTZ-ASDA Pilot Project.
Chandandeep Singh Grewal and Bhim Singh, 2006, Application of Value Stream Mapping in a Traditional Indian Environment: A Case Study, Proc. Int. Conf. on Advances in Mechanical Engineering-2006 (AME 2006)
Chris A Ortiz (2006), Kaizen Assembly Designing, Constructing, and Managing a Lean Assembly Line, Taylor and Francis
Dinesh Seth and Vaibhab Gupta, 2005, Application of Value Stream Mapping for Lean Operations and Cycle time reductions: an Indian Case Study, Journal of Production Planning and Control, vol. 16, No.
Farhana and A. Amir, 2009, Lean Production Practice: the Differences and Similarities in Performance between the Companies of Bangladesh and other Countries of the World, Asian Journal of Business management, vol. 1, no. 1.
Fawaz Abdullah, 2003, Lean Manufacturing Tools and Techniques in the Process Industry with a Focus on Steel, Ph. D Thesis, University of Pittsburgh, Pennsylvania, United States.
Karlsson C., Ahlstrom P. Assessing Changes Towards Lean Production. International Journal of Operations & Production Management 1996; 16; 2; pp. 24-41.
30
Mazany P. A Case Study-Lesson from the Progressive Implementation of Just-in-Time in a Small Knitwear Manufacturer. International Journal of Operations and Production Management 1995; 15; 5; pp. 271-228.
Mercado G. Question Garments- Ask the Lean Manufacturing Experts Applying Lean in the Garment Industry. Thomas Publishing Company, 2007.
Mohammed Ziaul Haider, 2007, “Competitiveness of the Bangladesh Ready-made Garment Industry
in Major International Markets”, Asia-Pacific Trade and Investment Review, Vol. 3, No. 1.
Pavanskar S.J. Gershenson J.K., Jambekar A.B. Classification Scheme for Lean Manufacturing Tools. International Journal of Production Research 2003; 41; 13; pp. 3075-3090.
Peter Hines and Nick Rich, 1997, The seven value stream mapping tools, International Journal of Production and Operations Management, vol. 17., no. 1
Ravikumar Marudhamut et. al., 2010, “The Development and Implement of Lean Manufacturing Techniques in Indian Garment Industry”, International Journal of Lean Thinking.
Rother M., Shook J. (1999), Learning to see: Value stream mapping to add value and eliminate muda;Brookline, MA; The Lean Enterprise Institute Inc.
Shahidur Rahman, 2004, Global Shift: Bangladesh Garment Industry in Perspective, CDRB Publication and Journal of Asian Affairs, Vol. 26, No. 1.
Shah R., Ward P.T. Defining and Developing Measures of Lean Production. Journal ofOperations Management 2007; 25; 4; pp. 785-805.
William M. Feld (2001), Lean Manufacturing Tools, Techniques, and How To Use Them, St. Lucie Press.


