FUNDAÇÃO GETULIO VARGAS
ESCOLA BRASILEIRA DE ADMINISTRAÇÃO PÚBLICA E DE EMPRESAS MESTRADO EXECUTIVO EM GESTÃO EMPRESARIAL
MODIFIED VALUE STREAM MAPPING OF AIRPORT CHECK-IN
PROCEDURES
DISSERTAÇÃO APRESENTADA À ESCOLA BRASILEIRA DE ADMINISTRAÇÃO PÚBLICA E DE EMPRESAS PARA OBTENÇÃO DO GRAU DE MESTRE
BRIAN E. O’CONNOR
Ficha catalográfica elaborada pela Biblioteca Mario Henrique Simonsen/FGV
!"#$
81 f.
Dissertação (mestrado) - Escola Brasileira de Administração Pública e de Empresas, Centro de Formação Acadêmica e Pesquisa.
Inclui bibliografia.
# % % &' ! % ( ) *
% &' (+, - &'
% . ( / ** 01
MODIFIED VALUE STREAM MAPPING OF AIRPORT CHECK-IN
PROCEDURES
ABSTRACT
In June 2014 Brazil hosted the FIFA World Cup and in August 2016 Rio de Janeiro hosts the Summer Olympics. These two seminal sporting events will draw tens of thousands of air travelers through Brazil’s airports, airports that are currently in the midst of a national modernization program to address years of infrastructure neglect and insufficient capacity. Raising Brazil’s major airports up to the standards air travelers experience at major airports elsewhere in the world is more than just a case of building or remodeling facilities, processes must also be examined and reworked to enhance traveler experience and satisfaction.
This research paper examines the key interface between airports and airline passengers—airport check-in procedures—according to how much value and waste there is associated with them. In particular, the paper makes use of a value stream mapping construct for services proposed by Martins, Cantanhede, and Jardim (2010). The uniqueness of this construct is that it attributes each activity with a certain percentage and magnitude of value or waste which can then be ordered and prioritized for improvement.
Working against a fairly commonly expressed notion in Brazil that Brazil’s airports are inferior to the airports of economically advanced countries, the paper examines Rio’s two major airports, Galeão International and Santos Dumont in comparison to Washington D.C.’s Washington National and Dulles International airports. The paper seeks to accomplish three goals:
- Determine whether there are differences in airport passenger check-in procedures between U.S. and Brazilian airports in terms of passenger value
- Present options for Brazilian government or private sector authorities to consider adopting or implementing at Brazilian airports to maximize passenger value
- Validate the Martins et al. construct for use in evaluating the airport check-in procedures Observations and analysis proved surprising in that all airports and service providers follow essentially the same check-in processes but execute them differently yet still result in similar overall performance in terms of value and waste. Although only a few activities are categorized as completely wasteful (and therefore removed in the revised value stream map of check-in activities), the weighting and categorization of individual activities according to their value (or waste) presents decision-makers a means to prioritize possible corrective actions. Various overall recommendations are presented based on this analysis. Most importantly, this paper demonstrates the viability of using the construct developed by Martins et al to examine airport operations, as well as its applicability to the study of other service industry processes.
TABLE OF CONTENTS
LIST OF TABLES ... 1
LIST OF FIGURES ... 2
1. INTRODUCTION ... 3
1.1. Problem Description and Objective ... 3
1.2. Background Information – Brazilian Infrastructure ... 4
1.2.1. General Information. ... 4
1.2.2. Airports. ... 5
1.2.3. Growth Acceleration Programs. ... 6
1.2.4. Airport Privatization. ... 6
1.2.5. Airport Infrastructure – Current PAC and Privatization Status. ... 7
1.3. Focus and Objectives of Thesis ... 8
1.4. Thesis Structure ... 14
2. THEORETICAL BACKGROUND ... 15
2.1. Possible Research Streams ... 15
2.1.1. Lean. ... 15
2.1.2. Six Sigma. ... 18
2.1.3. Lean Six Sigma. ... 18
2.2. Literature and Study Review ... 19
2.2.1. A Note on Lean, Six Sigma, and Lean Six Sigma Literature. ... 19
2.2.2. Entities Concerned with Airport Passenger Operations. ... 20
2.2.3. Airport Passenger Check-In Studies. ... 21
3. METHODOLOGY ... 22
3.1. Research Design ... 23
3.1.1. Value Stream Mapping (VSM). ... 24
3.1.2. Enhanced VSM. ... 24
3.2. Sources of Evidence ... 25
3.3. Data Collection Process ... 25
3.4. Evaluation Process ... 27
3.5. Limitations ... 28
4. ANALYSIS ... 29
4.1. Notes on Data and Process. ... 29
4.2. Apportionment of Value and Waste for American Airports ... 34
4.3. Qualitative Analysis of Value and Waste. ... 37
4.3.1. Passenger Perspective. ... 37
4.4. Quantitative Analysis ... 42
4.4.1. Passenger Perspective. ... 42
4.4.2. Service Provider Perspective. ... 44
4.5. Future Process Considerations. ... 45
4.5.1. New Process Map. ... 45
4.5.2. Data and Comparison Considerations. ... 47
5. RECOMMENDATIONS AND CONCLUSION ... 49
5.1. Recommendations ... 49
5.2. Conclusion ... 52
6. REFERENCES ... 54
6.1. Endnotes ... 55
APPENDIX ………...58
1
LIST OF TABLES
Table 1: Percentage of perceived value ... 27
Table 2: Classification standards for waste ... 28
Table 3: Passenger observations ... 30
Table 4: Value and Waste Apportionment of Passenger Check-In Activities - Galeão International Airport – TAM Airlines ... 36
Table 5: Value and Waste Apportionment of Service Provider Check-In Activities - Galeão International Airport – TAM Airlines ... 36
Table 6: Consolidated Waste Percentages – Passenger Perspective ... 37
Table 7: Consolidated Waste Percentages – Service Provider Perspective ... 37
Table 8: Classification of Value and Waste - All Activities - Passenger Perspective ... 38
Table 9: Classification of Waste - Galeão Airport - TAM Airlines (Passenger Perspective) ... 39
Table 10: Classification of Waste – All Airports – Provider Perspective ... 41
Table 11: Pareto – Galeão/TAM ... 43
Table 12: Consolidated Time of Waste – Service Provider Perspective ... 45
Table 13: Value and Waste – Proposed Future State Versus Current State ... 47
2
LIST OF FIGURES
Figure 1: Typical sponsor and study team roles (assuming an airport is the sponsor) ... 9
Figure 2: Typical Passenger Flow for U.S Domestic and International Departures ... 10
Figure 3: Typical Passenger Flow for U.S Domestic Arrivals ... 11
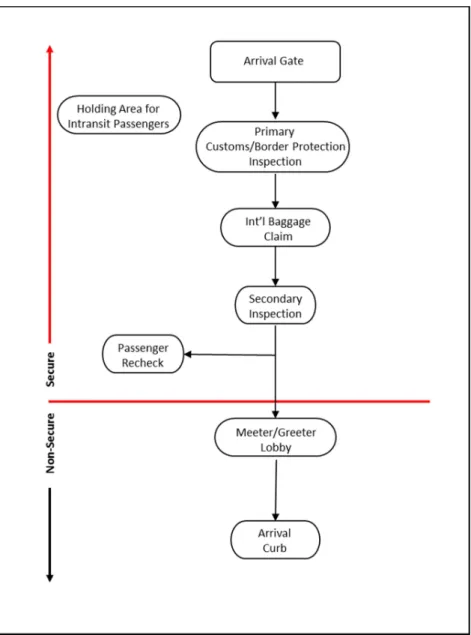
Figure 4: Typical Passenger Flow for U.S International Arrivals ... 12
Figure 5: Check-In Activities – Reagan National Airport ... 32
Figure 6: Check-In Activities – Dulles, Galeão, and Santos Dumont ... 33
Figure 7: Cumulative Waste: Galeão Airport – TAM Airlines ... 44
3
1. INTRODUCTION
The chapter presents a broad overview of the thesis and consists of four parts. First, there is a brief description thesis problem and its objectives. Next, is a discussion on the state of infrastructure in Brazil, with an emphasis on airports and the efforts of the government and private sector to improve infrastructure. This background information provides context to the utility of examining airport passenger handling in Brazil and establishes that timing may be conducive to pursuing opportunities to improve passenger operations. The chapter next delves into the focus and objectives of the paper, airport passenger processing and whether there are opportunities for improvement in comparison with passenger handling at airports in the United States. Finally, the structure of the thesis is laid out.
1.1. Problem Description and Objective
Traveling by air into and out of Brazil is an experience frequent Brazilian travelers do not hold in high regard and one that often surprises foreign travelers who accustomed to transiting more modern and seemingly more efficient terminals. The widespread critiques of facilities and services by local and foreign travelers alike are well-founded because Brazil’s airport infrastructure is aging, suffers from a lack of capacity, and has not kept pace with the growth of Brazil’s economy over the past 25 years. Within the last seven years, Brazil’s government has undertaken ambitious plans to modernize and improve airports throughout the country. Modernizing and increasing the size and capacity of terminals addresses physical elements of airport shortfalls, however travelers would affirm that processes, especially passenger check-in process, need to be revamped as well, and not just in terms of efficiency but also in terms of the quality or value they experience while during the check-in process.
4 1. Determine whether there are differences in airport passenger check-in procedures
between U.S. and Brazilian airports in terms of passenger value.
2. Present options for Brazilian government or private sector authorities to consider adopting or implementing at Brazilian airports to maximize passenger value.
3. Utilize and validate a construct for evaluating the customer (passenger) and provider (airline) value of airport check-in procedures.
1.2. Background Information – Brazilian Infrastructure
1.2.1. General Information.
In 2007, when Brazil bid for and eventually won the right to host the 2014 Football
World Cup and the 2016 Summer Olympics, the two largest sporting events in the world, it forced itself into a dizzying pace of modernization to ready itself for the influx of tens-of-thousands of sports fans and tourists. Momentum had already been building for infrastructure improvements since the turn of the millennium, courtesy of improved economic conditions and widespread dissatisfaction with Brazil’s infrastructure, which are generally aged and well overdue for either repair, replacement, or modernization. After decades of military rule which ended in 1985, exploitation of oil resources paved the way for Brazil to expand its economy to beyond that of a developing country but political and economic instability made the transition difficult. Successive presidential administrations in the 1980’s and 1990’s set about addressing key economic issues such as price controls, hyperinflation, trade liberalization, deregulation, privatization, and the introduction of new currencies all of which slowly stabilized the economy and set the stage for economic improvement.1
5 the global average of 3.8%.3 Given that the latter statistic represents the high point of the government’s attention to infrastructure over the past several decades, it is understandable that dissatisfaction with the current state of Brazilian infrastructure has risen over recent years. A 2012 Gallup poll revealed that Brazilian dissatisfaction with roads and highways has risen from 47% to 56% since 2010 and dissatisfaction with public transportation increased from 48% to 56%.4
1.2.2. Airports.
Brazilian airports, which are the primary subject of this thesis, are themselves representative of the infrastructure issues affecting Brazil, both in terms of inadequate capability and insufficient capacity. With the explosive dual growth of Brazil’s economy (now the sixth largest in the world in terms of GDP5) and its middle class, the demand for air travel has exploded as well. More Brazilians can and do fly domestically and internationally, and more tourists, business people, and international employees travel to Brazil. In February, 2013, Brazil’s Ministry of Finance reported that the total number of passengers processed by national airports increased from an average of 34.8 million between 2000 and 2003 to 105 million in 2012.6 The U.S. Department of Commerce estimates the total to rise to 195 million passengers in 20207 and Price, Waterhouse, Cooper asserts that by 2030 the number of passengers serviced will reach 312 million.8
6 reported that, as of 2012, 11 of the country’s top 20 airports had reached “saturated” status in terms of parking apron or terminal capacities.10
Aside from the increased strain on handling passengers, airports supporting World Cup venues are forecasted to experience overwhelming numbers of business aircraft flying in attendees. United Aviation Services estimates upwards of 3,000 business aircraft will fly in for the World cup, a number which those airfields cannot accommodate.11 As a result, the government plans to make Brazilian Air Force installations available to park and house overflow business aircraft.
1.2.3. Growth Acceleration Programs.
By 2007, the country’s economy had grown sufficiently enough for the President of Brazil, Luiz Inácio Lula da Silva (“Lula”), his cabinet, and the National Congress to take decisive action on Brazil’s pervasive infrastructure woes. They devised, obtained approval for, and implemented the first of a two-phase stimulus program entitled, “Programa de Aceleração de Crescimento,” the “Brazilian Growth Acceleration Program” (commonly called “PAC”).
During Phase 1 (PAC 1), which lasted from 2007 to 2010, $349B (USD)12 was allocated to three general areas: logistics, energy, and social/urban. In PAC 2, which runs from 2011 to 2014, $526B (USD) have been allocated for 6 areas: urban infrastructure, housing, safety and social inclusion, sanitation, and access to energy, electricity, and transportation.13 A further $364B (USD) is planned for energy and transportation projects after 2014.14 Airport projects account for approximately $19B (USD)15 of PAC monies, which is being spread across 270 airports. These infrastructure projects range from minor improvements to large scale construction activities which add new or replacing outdated facilities.
1.2.4. Airport Privatization.
7 emphasis on profitability. INFRAERO acknowledged its own short-comings in 1999 when it authorized certain non-major airports to operate on a commercial basis.16 In 2006, the Lula Administration created the Agency for Civil Aviation (Agência Nacional de Aviação Civil – ANAC) to regulate and oversee the safety of civil aviation. In creating ANAC, the government further signaled its openness to allowing private companies to manage airports so as to obtain profitable operations and to encourage domestic and international investment to engender airport modernization and new efficiencies.17
In February 2012, major airport privatization came to fruition when the government held an auction to grant concessions to operate Guarulhos International Airport in São Paulo (20-year term), Kubitschek International Airport in Brasilia (25-year term), and Campinas International Airport in Viracopos (30-year term). The winning bids totaled $10.19B (USD) and were four times the required minimum bid.18 The bids thrilled many in President Rousseff’s government however critics countered that airport privatization has its drawbacks including the possibility of increased airport fees, decrease in wages due to loss of government control over wages, and environmental impacts. Furthermore, as the International Air Transport Association (IATA) noted in a public statement, the auction winners were determined exclusively on how much they bid and not on which bidder(s) planned to create the best efficiencies.19 Despite later difficulties in obtaining minority partners, the government went ahead with a second auction in November 2013. Brazilian corporation Odebrecht and Singapore’s Changi Airport Group successfully bid $9B (USD) to operate Galeão International Airport in Rio (25-year term) and Confins International Airport in Belo Horizonte (30-year term); both are host cities for the World Cup.20
1.2.5. Airport Infrastructure – Current PAC and Privatization Status.
8 monies have been slow to translate to actual work on the ground. For instance, Infraero reported in September, 2013, that work on seven of the airports supporting World Cup matches is behind schedule, with work on Rio’s Galeao Airport being the furthest ahead at 35% completion while work has yet to start on three other airports.22
Airport privatization is also not materializing benefits as quickly as President Roussef and proponents had hoped for but some of that disappointment is justified while some is not. It is true that private sector interest in privatization efforts for airports and other sectors has waned, which is proving to be very disconcerting given the premium bidders paid during the two airport concession auctions.23 As a result, in early December 2013, the government halted further airport concessions for an unspecified period of time.24 On the other hand, criticism of the pace of privatization appears excessive given that only five major airports have gone through the auction process and those auctions were in the recent past, February and November of 2013, so the winning bidders have had little or no time to affect improvements and efficiencies.
1.3. Focus and Objectives of Thesis
The previous section highlights that Brazil’s airports are in a state of transition; years of institutional neglect are giving way to government and private sector improvements. The general focus of this thesis is to examine whether there may be opportunities to improve
Brazilian airport terminal passenger operations perhaps even beyond that which may currently be envisioned for airports in the process of or scheduled for modernization.
9
Figure 1: Typical sponsor and study team roles (assuming an airport is the sponsor)26
10
Figure 2: Typical Passenger Flow for U.S Domestic and International Departures
11 Figure 3 depicts the process for U.S. domestic flight arrivals. The process is straight forward; upon landing the passenger either proceeds to baggage claim or departs the airport directly. Figure 4 below depicts the typical process that international passengers follow when arriving in the U.S. The primary difference with this process is the necessity to pass through customs and border protection screening.
12
Figure 4: Typical Passenger Flow for U.S International Arrivals
13 differently. Businesses strive for efficiency to speed production, reduce the expenditure of resources, reduce costs, and so forth. Customers, look for efficient operations to reduce or preclude unnecessary effort or the expenditure of time to obtain or utilize a product or service, and to reduce the cost of a product or service. Efficiency, however, does not necessarily go hand-in-hand with what customers often truly desire—namely, quality.
It is increasingly routine for customers to be disappointed or dissatisfied with a product or service because measures taken for the sake of efficiency have degraded the product or experience in one or more ways. Most of us can relate to experiences in the service sector, where efficiencies gained by the provider seemed to come at the expense of the customer. Austerity measures and cost and resource reductions made under the guise of actual or assumed efficiencies have forced providers to “do more with less” which has adversely impacted the customer. Too often, more responsibility has been placed on customer to realize efficiencies for the provider, which has actually lead to longer customer lead times and increased customer dissatisfaction. Telephoning a company to obtain information for a product or service, for example, routinely consists of listening to numerous “computer” options and making various selections until we ultimately reach (we hope) a human to speak with. In terms of passenger airport operations, airline passengers now are encouraged or required to access their flight information for pre-check-in ahead of time on-line, must check-in themselves at self-service kiosks, and declare their baggage requirements before ever reaching the check-in counter. While these measures can save an airline money, many people chaff at having to bear the personal burden of executing a portion of what they believe they are paying the airline to do.
Returning to the topic of narrowing the focus of this thesis to a manageable undertaking, and postponing further discussion on quality to follow-on sections, it is advisable to select a sub-process for study that potentially may emphasize the variability between airports and allows for possible positive impact on Brazilian passenger operations. The sub-process which best fits that combination is the passenger check-in process. The narrowed focus of this thesis, therefore, is to examine and compare the check-in processes for Brazilian airports with that of mainstream
American airports.
14 1. Determine whether there are differences in airport passenger check-in procedures
between U.S. and Brazilian airports in terms of passenger value.
2. Present options for Brazilian government or private sector authorities to consider adopting or implementing at Brazilian airports to maximize passenger value.
3. Utilize and validate a construct for evaluating the customer (passenger) and provider (airline) value of airport check-in procedures.
1.4. Thesis Structure
This thesis is composed of five chaptersand starts with this chapter, which introduces the subject of airport infrastructure in Brazil, specifies the focus and objectives of the thesis, and lays out the structure.
Chapter 2 – “Theoretical Background” begins with a discussion on types of research streams appropriate for the thesis focus, which includes value stream mapping (VSM), Lean, Six Sigma, and Lean Six Sigma, and includes a review of literature on these tools. A review of studies on airport passenger procedures follows, emphasizing material covered and any gaps that may exist. The chapter concludes with a way ahead for the subsequent analysis.
Chapter 3 – “Methodology” is broken into several sections. First, the research design is laid out, which is the utilization of value stream mapping and the application of a methodology proposed by Martins, et al. (2010) that focuses on value. Second, sources of evidence are described. Third, the data collection process is elaborated on in detail. Fourth, the evaluation process and how data will be compared to each other is covered. Finally, methodology limitations are discussed.
Chapter 4 – “Analysis” presents an overview of collected data and how it relates to airports within Brazil and between airports in Brazil and select U.S. airports.
15
2. THEORETICAL BACKGROUND
The purpose of this chapter is to examine theoretical considerations for this paper, which fall within the realms of operations management. The chapter begins with an accounting of various operations management approaches by which terminal passenger operations might be examined. There is a brief discussion on literature pertaining to these approaches followed by a review of studies on airport passenger check-in procedures. This theoretical discussion paves the way in the next chapter for determining and commenting on the research methodology utilized.
2.1. Possible Research Streams
The overarching intent of examining passenger check-in procedures is to determine whether or not there are inefficiencies that can be addressed in some fashion by Brazilian airport authorities as they modernize and privatize Brazilian airports. The operations management processes of lean production, value stream mapping (VSM), Six Sigma, and Lean Six Sigma are now discussed as possible means by which inefficiencies and efficiencies can be discerned for passenger check-in procedures. While these processes do not represent an exhaustive accounting of operations management processes, they do constitute major methodologies airport authorities can employ to improve processes to enhance customer value and satisfaction.
2.1.1. Lean.
Lean is a generalized term for lean manufacturing or production and lean thinking. There are also a number of tools and methods that collectively have taken on the “lean” moniker. As the Lean Enterprise Institute puts it, “the core idea [of lean] is to maximize customer value while minimizing waste.”27 The concept that anything which doesn’t contribute to customer value constitutes waste has its genesis with the Toyota Production System (TPS), which Sakichi Yoyoda, the founder of Toyota, developed with several of his key engineers and son, over the course of three decades while at the helm of Toyota.
16 precursor activities of planning and preparation while mura concentrates on how design plans and characteristics are implemented affect more consistent operations. These activities go far to eliminate waste/muda but waste can be ever-present so TPS categorizes waste into seven types that must be constantly monitored and addressed. These seven categories are:28
1. Waste of Defects
2. Waste of Over-Production 3. Waste of Waiting
4. Waste of Transportation 5. Waste of Over-Processing 6. Waste of Inventory 7. Waste of Movement
Various individuals and organizations have added new classifications of waste over recent years including waste of skills, waste of space, waste caused by poor metrics, waste from improper use of computers, and so on. Whatever the category, the aim for supervisors and managers is to collectively and continuously manage processes and procedures to bring about what is commonly referred to as “continuous improvement”.
Three Japanese-inspired principles are at the heart of lean: to have a long-term vision, embrace the mantra that continuous improvement is always necessary because good is never enough (kaizen), and for individuals to obtain first-hand knowledge of production activities in order to effectively accomplish goals (Genchi Genbutsu). These core concepts have been refined over time in practice and in theory to the point that lean is now regarded in four general fashions: lean as a philosophy, a set of tools, a process of continuous improvement, and a goal. The common element of whichever approach an organization or supervisor embraces is the set of tools, which there are many of. Numbering in the dozens, some are individual or single-focus processes while others encompass a wide range of activities. It is typical for multiple tools to be used simultaneously. In terms of lean tools, many of those identified for production activities can be utilized for service operations; there are also tools specific to service operations. Discussion on which tools are applicable to this research question is saved for the “Methodology” section to come.
17 Daniel Jones, two foremost lean management analysts, authors of the seminal work, Lean Thinking, and founders of the Lean Enterprise Institute (LEI), formulated five principles for
implementing lean which guide lean efforts in any type of industry. Taken directly from LEI’s website, they are:29
1. Specify value from the standpoint of the end customer by product family.
2. Identify all the steps in the value stream for each product family, eliminating whenever possible those steps that do not create value.
3. Make the value-creating steps occur in tight sequence so the product will flow smoothly toward the customer.
4. As flow is introduced, let customers pull value from the next upstream activity.
5. As value is specified, value streams are identified, wasted steps are removed, and flow and pull are introduced, begin the process again and continue it until a state of perfection is reached in which perfect value is created with no waste.
While perhaps intuitively obvious that lean thinking and procedures are viable for service operations, the preceding overarching principles are quite general. Bicheno and Holweg (2009) recognized this fact and therefore created a modified version of the Toyota’s classic seven wastes for use with service operations; taken directly from their study they are:30
1. Delay – Delays imposed on customers (e.g. waiting in line, waiting for responses) 2. Duplication – Re-entering data, repeating data on forms
3. Unnecessary Movement – Multiple queuing; lack of one-stop capability, poor counter ergonomics
4. Unclear Communication – Confusion over instructions, having to seek clarification, excessive time finding a location
5. Incorrect Inventory – Out-of-stock, incorrect items, substitute services
6. Opportunity Lost – Failing to win or retain customers, poor customer interaction, ignoring customers
7. Errors – Errors occurring during a service transaction, defects with service bundles, lost or damaged goods.
18 2.1.2. Six Sigma.
Six Sigma is a set of tools and techniques, rooted in statistical analysis, which is used to obtain process improvements. The focus of Six Sigma is to improve quality by eliminating production or service defects and to minimize variability in production or service processes. The benefits championed of Six Sigma include reducing waste, increasing customer satisfaction, and improving financial results.31 Developed by Motorola in 1980s and famously embraced by Jack Welch of General Electric, Six Sigma is a structured approach based on the assertion that processes can be measured, analyzed, and controlled in a quantifiable fashion and that stable, non-variable processes are essential to business and service processes. Defining and capturing key metrics and analyzing them statistically are at the core of Six Sigma applications. Six Sigma practitioners employ one of two structured methodologies: DMAIC (define, measure, analyze, improve, and control) or DMADV (define, measure, analyze, design, verify). Given the structured and analytical nature of Six Sigma, a formal training and certification process has evolved by which practitioners are qualified (ex: green belts, black belts, champions).
Eliminating variance to improve quality is not just for the producer’s or provider’s benefit but also to the customer’s benefit. This emphasis on quality and quality control underlie other benefits: the importance of the customer, result-oriented methodologies, disciplined application methodologies, definable measures of success, the enabling of quick project completion, and defined roles for practitioners and leadership.32 As alluring as the characteristics are, they create or mask short-comings that users should be aware of. In general, Six Sigma can be expensive for an organization to train and certify its personnel in. Atmaca and Girenes (2011) note that Six Sigma’s focus on quality can come at the expense of speed and inventory (inventory amount are usually ignored); and realizing financial gains may take time due to the structural requirements and complexity of the data involved.33
2.1.3. Lean Six Sigma.
19 neither approach could be the answer for all situations; some situations demanded one or the other, while others were conducive to utilizing both approaches. As a result, Lean and Six Sigma underwent a loose integration process during the 2000s which produced the concept of Lean Six Sigma (LSS).
In a similar fashion to how Six Sigma utilized on its own can produce less than optimal results in terms of speed or inventory (see above), Atmaca and Girenes (2011) highlight that relying solely on Lean, “processes are not under statistical control”, importance is not attached to variation, and process improvements can be realized which are not linked to mathematical tools to discover flaws once the waste has been eliminated.34 Judging from the number of studies and articles on the subject, the evolution of LSS over the past decade has kept many a pen and keyboard busy. It is not germane to the intent of this paper to delve into the intricacies of this evolution but it is worthwhile to note that there is general agreement both approaches are valuable and can be quite complimentary if used in parallel.
2.2. Literature and Study Review
2.2.1. A Note on Lean, Six Sigma, and Lean Six Sigma Literature.
20 Bäckman (2013)35 and Atmaca, Girenes (2011)36 provide a good review of literature on the evolution of LSS in their respective works. These and other authors advocate for structuring and standardizing LSS and its application.
2.2.2. Entities Concerned with Airport Passenger Operations.
There is a wealth of guidance and literature on airport passenger operations. In terms of guidance, various national and international governing authorities which are responsible for or concerned with airport operations offer regulatory or recommended guidance. At the international level, there is the International Civil Aviation Organization (ICAO), which is a UN-chartered body that governs the development and execution of Standards and Recommended Practices (SARPs) for civil aviation throughout its 191-member countries.37 The IACO has published a wide range of material on passenger operations via regulatory documents, independent studies, and various trade and technical journals and periodicals.
At the national level, many countries have regulatory and government-associated advisory organizations associated with airport operations. In terms of the former, the Federal Aviation Agency (FAA) immediately comes to mind. The limits of regulatory agencies such as the FAA or Brazil’s Infraero vary from country to country, organization to organization. The Airport Cooperative Research Program (ACRP) of the Transportation Research Board of the National Academies, is an example of the latter category. The ACRP is an interesting example because it is actually sponsored by the FAA. The ACRP has produced dozens of reports on various aspects of airport operations. ACRP Report 23 – Airport Passenger-Related Processing Rates Guidebook, ACRP Report 25 – Airport Passenger Terminal Planning and Design, and ACRP Report 41 – Guide to the Decision-Making Tool for Evaluating Passenger Self-Tagging relate directly to airport passenger operations and are thus of consequence to consider for this thesis.
21 passengers. IATA utilizes the World Airports Group and Regional Airports Steering Group forums (consisting of dozens of individual groups) to address select issues such as passenger operations. One such IATA enterprise is the Fast Travel Program. IATA’s Fast Travel Program is a long-term program to provide passengers more choice, convenience, and control when they travel through by way of enhanced self-service capabilities.39 Proposed elements of the program will enable 80% of air travelers by 2020 capabilities for service check-in, self-tagging personal bags, scanning personal identification documents, rebooking cancelled or delayed flights, self-boarding, and self-reporting of missing bags.40 The Fast Travel and other IATA initiatives are rooted in various studies which the Association posts on its website.
The Airports Council International – North America (ACI-NA), which labels itself as “the voice of airports” and whose members encompass 95% of all air travel in North America, is a private, not-for-profit entity that offers reports in over 40 categories to “strengthen the ability of commercial airports to serve their passengers, customers and communities.”41 SITA is an example of a for-profit international company which specializes in information technologies (IT) related to air transportation. Its 2013 Passenger IT Trends study provides current data on topics such as passenger trends, desires, and concerns for using technologies to make traveling easier and passenger priorities for mobile and self-service applications.42 This report, and several others like it, provide elements to consider in examining current airport processes in terms of current and potential airport passenger (customer) value.
2.2.3. Airport Passenger Check-In Studies.
22 Buffalo Niagara International Airport (USA) which they contend demonstrates the utility of simulation to other aspects of airport operations. Palar and Sharafali (2008) make a case for dynamic stochastic programming (i.e. mathematical modeling) of check-in counter operations
and waiting. Guizzi, Murino, and Romano (2009) detail a simulation model they developed and utilized to examine check-in and security passenger flows at Naples International Airport. Tang (2010) presents a case for a network model to determine the number of counter assignments while Bruno and Genovese (2010) present a mathematical model for doing the same. Hsu, Chao, and Shih (2012) present a synopsis of a modeling exercise they utilized to execute the dynamic allocation of check-in counters. Parlar, Rodriques, and Sharafali (2012) examine “exclusive-use” counters (counters designated for a specific amount of time to specific flights) in terms of whether the number of counters should be fixed or dynamic; with dynamic meaning the number of counters vary based on mathematical or simulated derivations.
There are a few studies whose focus is on something other than mathematical modeling or simulation. Correia and Wirasinghe (2006) demonstrate the viability of developing levels of service standards based upon quantitative manipulation of qualitative survey data for check-in counter experiences and assert such level of service analysis can be utilized for other aspects of airport operations. Abdelaziz, Hegazy, and Elabbassy (2010) use analytics to prove the advantage of using modern common use self-service technology, as is in use with most western, first-world airports, over that of common user terminal equipment, which at the time of their writing was still the standard for Egypt’s airports. Finally, Ren Xinhui (2011) purports the benefits of utilizing a Six Sigma approach to determining and routing out deviations in check-in counter operations.
3. METHODOLOGY
23
3.1. Research Design
The previous chapter illustrates there is more than one operations management approach suitable for examining passenger airport operations; the choice of which to utilize—Lean, Six Sigma, and Leans Six Sigma—rests with which approach best addresses the research focus area of passenger value. Recounting the discussion on Lean, maximizing customer value and minimizing waste are at the core of Lean, but those attributes aren’t enough on their own to automatically choose it over the other two approaches, after all, cases could certainly be made that through proper application of the right tools, Six Sigma and Lean Six Sigma can be utilized to eliminate variance and deficiencies to produce more customer value. The decision, therefore, prompts repeating my earlier assertion that efficiencies do not necessarily equate to value. Creating a check-in process that is efficient and fast from the perspective of an airline by way of eliminating process (service) inhibitors but the places more responsibility on the shoulders of the passenger may not be palatable to the customer and could induce customer dissatisfaction.
The choice for a methodology also accounts for the fact that airport check-in procedures constitutes more than just check-in counter activities, yet as the review of studies reflects, most of the studies concentrated almost exclusively on check-in counter procedures. Perhaps it is partly due to a case of semantics or simply a lack of a handy phrase like “checking in” or “check-in” but the process of readying or setting one’s self up to fly once at the terminal (ignoring the activities of getting to the terminal’s “curb” such as transportation and parking) encompasses some or all of the activities portrayed in Figure 2—from curbside arrival to arriving at the departure gate.
ASSUMPTION: For the purpose of ease of reference in this paper, the “check-in” process is hereby defined as all the activities between curbside arrival and arrival at the departure gate.
24 whether Lean Six Sigma provides complimentary applications. There is, in fact, a Lean tool which can capture check-in activities, whether they be actual events such as obtaining boarding passes or checking bags, or the activities of “transiting” and/or “waiting” in between individual activities—value stream mapping.
3.1.1. Value Stream Mapping (VSM).
Value stream mapping is a tool by which individuals can depict and analyze process flows. Although often regarded as a tool for visualizing manufacturing processes, VSM is equally applicable to the service sector. There are numerous benefits to VSM:43
- VSM can portray a process from beginning to end - It is easy to learn
- Can identify bottlenecks
- Presents a means to depict current and desired future states
- Inexpensive; can be done by hand though software programs are available - Easy to critique
The complexity of VSM drawings are proportional to the complexity of the process(es) under scrutiny and the amount of data a user elects to annotate with each depicted event or step.
3.1.2. Enhanced VSM.
Carrying out VSM for the airport check-in process is a fairly straight forward but accounting for and utilizing the amorphous nature of value requires additional measures beyond traditional VSM. A typical passenger does not regard the accomplishment (or non- or slow accomplishment) of individual components of the check-in process equally; each passenger weights them differently in his or her own mind. This indeterminate or dynamic facet of analyzing the check-in process poses a serious dilemma to the researcher. Martins, Cantahede, and Jardim (2010) cleverly address this dilemma in their analysis of their experience buying lunch at food truck/trailer located on their university’s campus in São Paulo, Brazil. It is their unique approach to analyzing a process and accounting for customer value that is utilized to analyze passenger check-in operations in this paper.
25 - To capture the element of value to a customer, they created a scale in which a percentage of value to the customer for any activity was defined on a quartile basis (0%, 25%, 50%, 75%, or 100%). For example, an apportionment of 75% meant that an activity closely related to the primary process.
- The scale and categories of perceived value can be defined as necessary to fit the analytical situation.
- The process is repeated for the service provider.
- The activities of the customer and the provider are sequentially mapped and coupled to show the interaction of both parties.
- Types of waste are qualitatively depicted by defining categories of waste.
- Quantitative data (such as time recordings) and qualitative data (the apportionment of value, the qualification of waste) are tabularized to facilitate analysis.
- Pareto diagrams are created to depict the activities that are wasteful in order of wastefulness.
3.2. Sources of Evidence
Examining airport check-in processes is readily conducive to first-hand observation. Although the activities of individual passengers vary depending on whether they checked in online prior to arriving at the airport, have bags to check, and so forth, the overall check-in process is discrete and defined. First-hand observation also permits visual understanding of how the check-in process actually occurs. A printed diagram of the process can depict the steps but it can’t capture layout, distances travelled, or impediments. Since this paper seeks to compare the processes of Brazilian and U.S. airports to each other, it follows that first-hand observations should be made at airports of those countries.
The aspect of passenger satisfaction and value—which is largely based on time—is appropriately studied with first-hand observation. Interviews and/or participant observation are appropriate given that the planned methodology includes devising numeric-based qualitative scales to apportion the quality of perceived value and categorizing a percentage of waste for activities. Determining categories of value and waste should not be carried out by one individual but through the joint input of multiple individuals.
3.3. Data Collection Process
26 U.S.
1. Washington Dulles International Airport (Dulles, Virginia)
2. Ronald Reagan Washington National Airport (Arlington, Virginia) Brazil
1. Galeão International Airport (Rio de Janeiro) 2. Santos Dumont Airport (Rio de Janeiro)
3. Optional: Guarulhos International Airport (São Paulo) 4. Optional: Congonhas Airport (São Paulo)
The actual number of airports at which first-hand observations were to be made is not large but that should not pose a problem to for two primary reasons. First, the actual steps involved in passenger check-in is essentially the same at most large airports, regardless of the country; what differs are the peculiarities characteristic of individual airports such as size, congestion, and capacity. Second, the data collected at any one airport will at least be usable to craft results for consideration by appropriate parties at that airport.
The number of observations to conduct at an airport (i.e. the number of people to observe) for timing trials can be variable as well. At the extreme, one person observed from start to finish can provide the basis for evaluating check-in procedures (which is what Martins et al. did), however there are obvious benefits to larger sampling. What is important is to observe the different permutations of utilizing the self-service kiosk or not, going to the counter or not, checking in bags or not, etc. The timing of observations also matters; the flow of passengers checking in depends on numerous variables such as the time of day, whether the flight is international or domestic, the timing between other flights, when the check-in window is, and the capacity of the aircraft (which determines how many passengers), and so on. Here again, however, whatever data is collected and analyzed for an airport can be useful to that airport or airline if the data and results are properly categorized, attributed, and caveated. The goal was to observe at least 25people complete the check-in process from curbside to departure arrival at the personal security screening venue. (It is not feasible to follow passengers to their gates because that would require special permission from airport authorities to transit back and forth between the security screening zones).
27 whatever number of people are queried for inputs, the resulting scale will be subjective and relative. Properly describing the rationale for categorizations will preserve their utility and understanding with the recipients of the information. Five seasoned travelers were consulted to obtain their opinions and for developing and determining the categorizations.
3.4. Evaluation Process
Timing, value, and waste data will be tabularized for each airport. The timing of activities and the percentage of perceived value or waste will be used (multiplied) to determine numeric values for time-value and waste. The percentage of value perceived will be based upon Table 1 and waste will be categorized Table 2.
% Value Type of Activity Example (Passenger’s Point of View)
0% Activity does not relate to the goal of Traveling to bag screening location the primary process
25% Activity somewhat relates to the Queuing for check-in kiosk primary process
50% Activity moderately relates to the Gathering personal items following
primary process personal screening
75% Activity closely relates to the primary Checking in electronically but do not
process receive a boarding pass
100% Activity totally relates to the primary Obtaining a boarding pass
Process
Table 1: Percentage of perceived value
Green - Value-adding
- Activities related to the primary purpose of the process; the passenger is willing to accept the process in its entirety.
- Example: checking bags
Red - Non-value adding - Eliminate immediately.
- Example: having to walk and take bags to baggage screening/drop-off
Yellow - Necessary but partially wasteful within passenger expectation
- This waste occurs in the execution of the process and is within a passenger’s expectations.
- Example: walking to personal screening
Purple - Necessary but partially wasteful in excess of passenger expectation
28 expectations; it is sufficient enough to cause the passenger to not want to return or reutilize the company or service.
- Example: waiting for an airline’s self-service check-in kiosk
Table 2: Classification standards for waste
The numeric determination of time of value and time of waste, the categorization of waste, and the value stream mapping of the current check-in process enables the analysis of individual airports or airline(s) according to passenger value, wants, or expectations. Pairing the passenger and provider value stream maps can provide a ready reference for what activities are of no value and should be eliminated as soon as possible, or of little value and should be altered to improve value. This same analysis can be carried out by examining and comparing the results for airports within a country or between countries. Obvious benefits of this construct, therefore, are that it can be useful at the individual and group levels, and it can reveal opportunities for improvement or prove processes are executing well.
3.5. Limitations
There are several types of limitations to this study. First, although the basic process for airport check-in is fairly standardized among most airports, the execution of these procedures varies widely. Every airport is unique in terms of its terminal layout, airport capacity, the number of airlines it serves and whether those airlines have their own areas, kiosks, and so forth. Even modern airports regarded as well-organized and efficient may have drawbacks just given their size and layout. It can be difficult, therefore, to readily compare certain airports to each other the results of this study’s construct.
Second, airport check-in procedures continue to evolve as new technologies (such as mobile technologies) are developed and put into use which makes the execution of this study a snapshot in time for a particular airport. That isn’t to say the data and results aren’t valid, rather adopters of this construct should re-run it as new technologies and sub-processes come into effect.
29 Passenger-Related Processing Rates Guidebook, recommends a dedicated team of researchers
with distinct responsibilities for studying passenger operations.
Four, the subjectivity of the qualification scaled for value and waste can skew the results or at least qualify them as relative. Care should be exercised by both the researcher and any reader or consumer of the study. This author needs to ensure the scales are sufficiently thought out and rationalized through the inclusion of other people’s opinion and readers need to keep in mind there is subjectivity to the scales and resultant data.
Five, observations are focused on the passenger experience and less so on the service providers. This is both intentional and a factor of not being able to obtain sufficient permissions to be present “on the other side of the counter” or screening stations to make observations. There is a chance certain insights may be missed that are germane to the provider’s perspective.
Once again, it bears repeating that the a key goal of this paper is to provide, as Martins et al. did in their original study (the progenitor for this effort), a construct for examining the value of check-in procedures, which should be realizable in spite of the limitations outlined above.
4. ANALYSIS
This chapter of analysis begins with a description of the check-in procedures, apportionment of value and waste, and a value stream map for the non-Brazilian airports studied and is followed with those of Brazil’s Galeão and Santos Dumont airports. Qualitative and quantitative analysis and comparisons are next covered followed by revised value stream maps that account for recommended changes to increase passenger value and decrease waste in the respective check-in processes.
4.1. Notes on Data and Process.
30 generally abided by the process outlined in Figure 2 but they varied in the execution in certain ways such as how many kiosks and counters they had and utilized, or whether or not they had one or more representatives in front of the counter to assists passengers with issues. The layout, spaces, and distances involved also varied between airports and airlines but such geographic differences were minimized within an airport by selecting airlines whose counters were close to each other in location and function.
Table 3. Passenger Observations
Airport Airline
Observed
Number of Passengers Observed
Reagan National Delta 50
United 50
Dulles International Delta 50
American 50
Galeão International TAM 100
Santos Dumont TAM 100
Table 3: Passenger observations
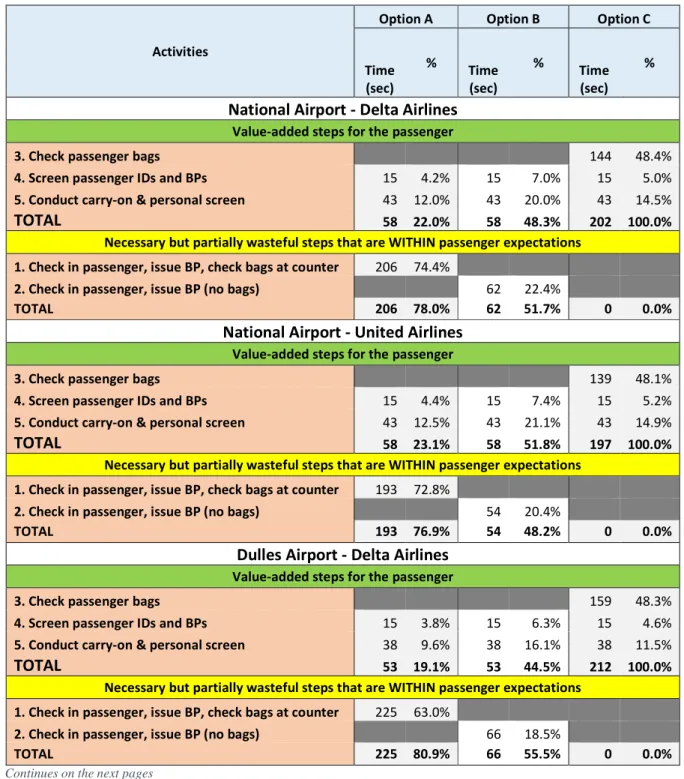
As mentioned previously, Martins et al’s construct includes mapping the activities of the customer (passenger) to those of the provider (airline, screening authority). Figure 5 below illustrates the procedures for Delta and United airlines at Washington National Airport. Figure 6 displays those for Dulles, Galeão, and Santos Dumont airports. The two figures differ in that for Delta and United domestic flights at Washington National, the passengers must take their bags from the check-in counter and drop them off at separate processing points for baggage screening. The color coding of each activity box corresponds to the categories specified Table 2 (Section 3.4). The dearth of activity boxes on the “provider’s” side is a consequence of several factors. First, most process steps are carried out by passengers. Second, I was not able to physically position myself to discern the exact time when a counter employee transitioned from checking in a passenger—to issuing the boarding pass—to initiating the baggage check. For a number of passengers, I had to estimate when the transition occurred based on visual clues. Overall, I believe the counter timings are fairly accurate and the calculated averages benefit from the number of timings I did accomplish.
32
33
34
4.2. Apportionment of Value and Waste for American Airports
Utilizing the activities detailed in Figures 5 and 6, Tables 4, 5, 6, 7, 8, and 9A and B detail the apportionment of value percentages which were then multiplied by the time of the activity to determine the time—or amount—of value for check-in procedures from the passenger and service provider perspective. Waste constitutes that which doesn’t provide value so the time/amount of waste was calculated in a similar fashion using the percentage adjudged to be waste. The total time of value and the total time of waste were then compared to the total time of all activities and percentages of each are provided. Using Activity #3 as an example (queuing for kiosk), the nine seconds of average queuing time is multiplied by .25 (subjectively determined value of that activity) to obtain a time of value of 2.25 seconds. That same nine seconds is then multiplied by .75 to obtain the time of waste, which is 6.75 seconds.
Note: For ease of readability, only Tables 8A and 8B (Galeão International) are shown
below. All the test case tables (4A thru 9A and 4B thru 9B) are presented in Appendix A.
Each of the passenger value/waste tables lists each possible activity and their associated values however passengers do not undertake all these activities; the activities they undertake depends on whether they utilized the kiosks, checked bags, and so forth. At the bottom of each table, therefore, are the values for 5 options which a passenger may take. These options are:
Option A
- counter → check in/receive BPs/check bags → bag screen → personal screen Option B
- counter → check in/receive BPs/no bags → personal screen Option C
- counter → check bags → bag screen → personal screen Option D
- kiosk → check in/get BPs → counter → check bags → bag screen → personal screen Option E
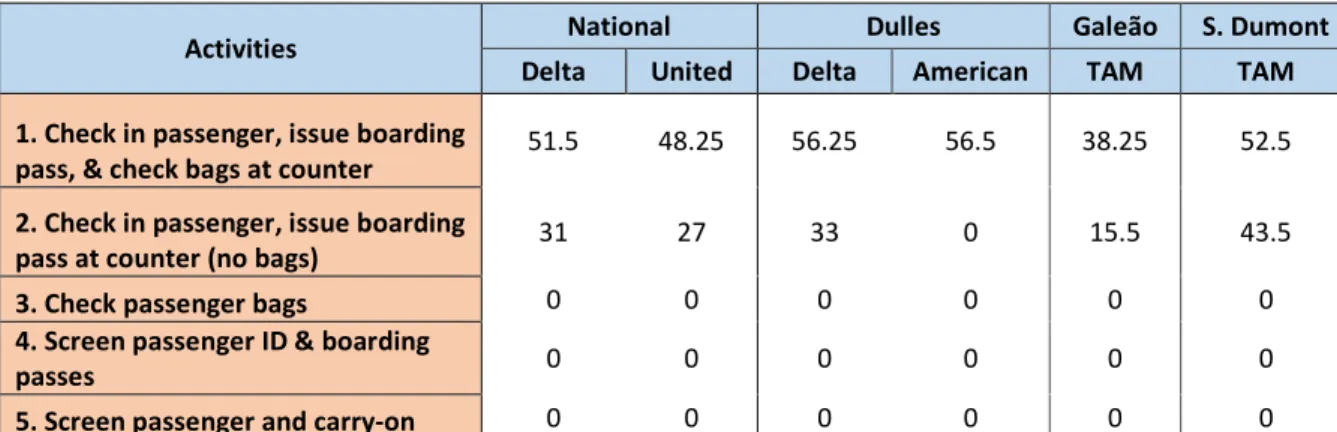
35 The service provider likewise annotate various options however there are only three for actions from their perspective.
Option A
- counter → check in/issue BPs/check bags → ID & BP screen → personal screen Option B
- counter → check in/issue BPs → ID & BP screen → personal screen Option C
- counter → check bags → ID & BP screen → personal screen
36
Table 4 (text reference – table 8A): Value and Waste Apportionment of Passenger Check-In Activities - Galeão
International Airport – TAM Airlines
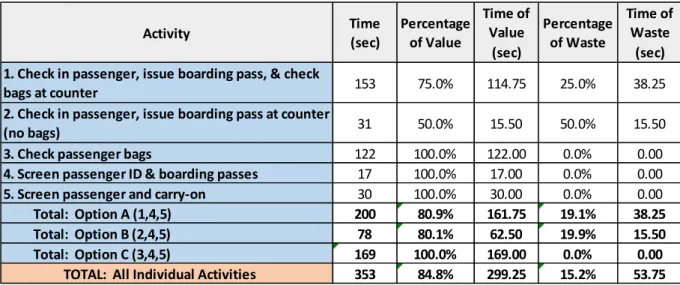
Table 5 (text reference table 8b): Value and Waste Apportionment of Service Provider Check-In Activities - Galeão
International Airport – TAM Airlines
Activity Time (sec) Percentage of Value Time of Value (sec) Percentage of Waste Time of Waste (sec)
1. Travel curb to counter 36 0% 0 100% 36
2. Travel curb to kiosk 31 0% 0 100% 31
3. Queue for kiosk 12 25% 3 75% 9
4. Check in and receive boarding pass at kiosk 98 100% 98 0% 0
5. Queue for counter 420 25% 105 75% 315
6. Check in, receive boarding pass, check bags at counter 153 100% 153 0% 0
7. Check in, receive boarding pass, no bags at counter 31 100% 31 0% 0
8. Check bags at counter 122 100% 122 0% 0
9. Travel to baggage screen (N/A) 0 0% 0 100% 0
10. Queue for baggage screen (N/A) 0 0% 0 100% 0
11. Drop off bags at baggage screening (N/A) 0 0% 0 100% 0
12. Travel to personal screen 48 0% 0 100% 48
13. Queue for boarding pass & ID screen 168 25% 42 75% 126
14. Boarding pass & ID screen 17 100% 17 0% 0
15. Queue for personal security screen 45 25% 11.25 75% 33.75
16. Carry-on & personal security screen 30 100% 30 0% 0
17. Gather personal belongings 10 50% 5 50% 5
Total: Option A (1,5,6,9-17) 927 39.2% 363.25 60.8% 563.75
Total: Option B (1,5,7,12-17) 805 30.0% 241.25 70.0% 563.75
Total: Option C (1,5,8-17) 896 37.1% 332.25 62.9% 563.75
Total: Option D (2,3,4,5,8-17) 1001 43.3% 433.25 56.7% 567.75
Total: Option E (2,3,4, 12-17) 459 44.9% 206.25 55.1% 252.75
TOTAL: All Individual Activities 1221 50.6% 617.25 49.4% 603.75
Activity Time (sec) Percentage of Value Time of Value (sec) Percentage of Waste Time of Waste (sec) 1. Check in passenger, issue boarding pass, & check
bags at counter 153 75.0% 114.75 25.0% 38.25
2. Check in passenger, issue boarding pass at counter
(no bags) 31 50.0% 15.50 50.0% 15.50
3. Check passenger bags 122 100.0% 122.00 0.0% 0.00
4. Screen passenger ID & boarding passes 17 100.0% 17.00 0.0% 0.00
5. Screen passenger and carry-on 30 100.0% 30.00 0.0% 0.00
Total: Option A (1,4,5) 200 80.9% 161.75 19.1% 38.25
Total: Option B (2,4,5) 78 80.1% 62.50 19.9% 15.50
Total: Option C (3,4,5) 169 100.0% 169.00 0.0% 0.00
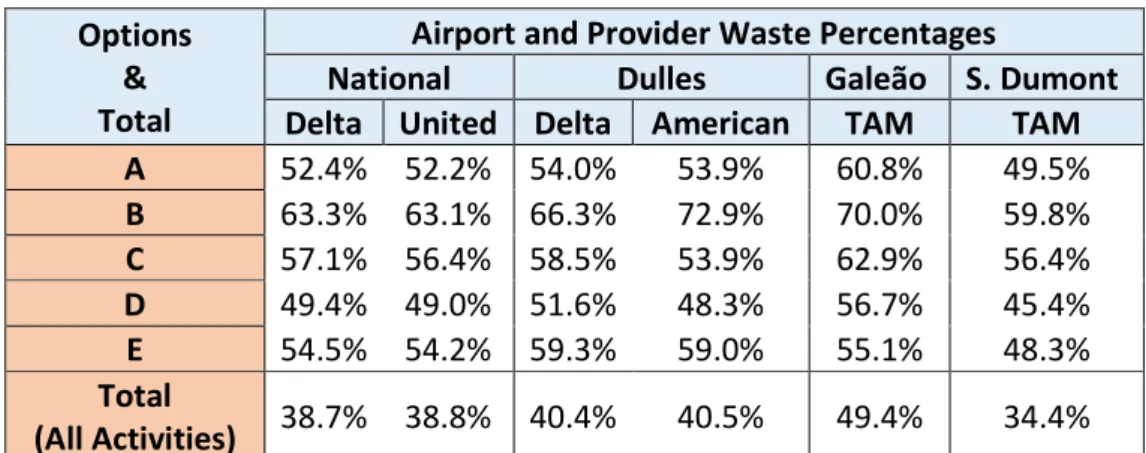
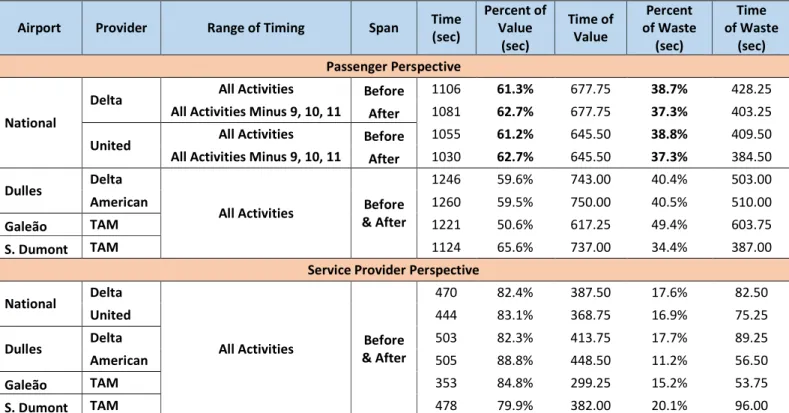
37 Table 10A presents the waste totals for the five passenger options and all activities for each airport and airline from a passenger perspective. Table 10B does the same from the provider’s perspective.
Options & Total
Airport and Provider Waste Percentages
National Dulles Galeão S. Dumont
Delta United Delta American TAM TAM
A 52.4% 52.2% 54.0% 53.9% 60.8% 49.5%
B 63.3% 63.1% 66.3% 72.9% 70.0% 59.8%
C 57.1% 56.4% 58.5% 53.9% 62.9% 56.4%
D 49.4% 49.0% 51.6% 48.3% 56.7% 45.4%
E 54.5% 54.2% 59.3% 59.0% 55.1% 48.3%
Total
(All Activities) 38.7% 38.8% 40.4% 40.5% 49.4% 34.4%
Table 6 (text reference table 10A): Consolidated Waste Percentages – Passenger Perspective
Options & Total
Airport and Provider Waste Percentages
National Dulles Galeão S. Dumont
Delta United Delta American TAM TAM
A 19.5% 19.2% 20.2% 20.3% 19.1% 19.5%
B 25.8% 24.1% 27.7% 0.0% 19.9% 25.8%
C 0.0% 0.0% 0.0% 0.0% 0.0% 0.0%
Total
(All Activities) 17.6% 16.9% 17.7% 11.2% 15.2% 17.6%
Table 7 (text reference table 10B): Consolidated Waste Percentages – Service Provider Perspective
4.3. Qualitative Analysis of Value and Waste.
4.3.1. Passenger Perspective.
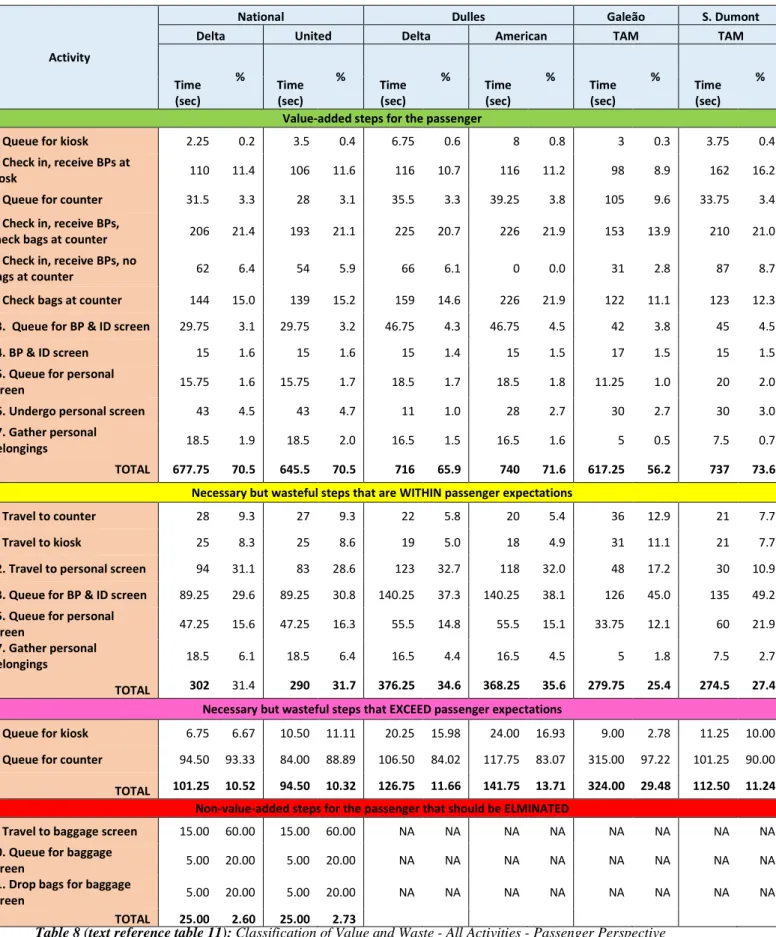
Utilizing the data captured in Tables 4-9A/B, it is now possible to segregate value and waste data based on the classifications of Table 2. The first table, Table 11, captures all activities for the 6 test cases. Tables 12, 13, 14, 15, 16, and 17 annotate waste classifications from a passenger perspective according to the five options previously covered. Differentiating waste in this manner will facilitate subsequent quantitative analysis and recommendations.
Note: For ease of readability, only Tables 16A and 16B (Galeão International) are
38 Activity
National Dulles Galeão S. Dumont Delta United Delta American TAM TAM
Time (sec) % Time (sec) % Time (sec) % Time (sec) % Time (sec) % Time (sec) %
Value-added steps for the passenger
3. Queue for kiosk 2.25 0.2 3.5 0.4 6.75 0.6 8 0.8 3 0.3 3.75 0.4 4. Check in, receive BPs at
kiosk 110 11.4 106 11.6 116 10.7 116 11.2 98 8.9 162 16.2 5. Queue for counter 31.5 3.3 28 3.1 35.5 3.3 39.25 3.8 105 9.6 33.75 3.4
6. Check in, receive BPs,
check bags at counter 206 21.4 193 21.1 225 20.7 226 21.9 153 13.9 210 21.0 7. Check in, receive BPs, no
bags at counter 62 6.4 54 5.9 66 6.1 0 0.0 31 2.8 87 8.7
8. Check bags at counter 144 15.0 139 15.2 159 14.6 226 21.9 122 11.1 123 12.3
13. Queue for BP & ID screen 29.75 3.1 29.75 3.2 46.75 4.3 46.75 4.5 42 3.8 45 4.5
14. BP & ID screen 15 1.6 15 1.6 15 1.4 15 1.5 17 1.5 15 1.5 15. Queue for personal
screen 15.75 1.6 15.75 1.7 18.5 1.7 18.5 1.8 11.25 1.0 20 2.0 16. Undergo personal screen 43 4.5 43 4.7 11 1.0 28 2.7 30 2.7 30 3.0 17. Gather personal
belongings 18.5 1.9 18.5 2.0 16.5 1.5 16.5 1.6 5 0.5 7.5 0.7 TOTAL 677.75 70.5 645.5 70.5 716 65.9 740 71.6 617.25 56.2 737 73.6
Necessary but wasteful steps that are WITHIN passenger expectations
1. Travel to counter 28 9.3 27 9.3 22 5.8 20 5.4 36 12.9 21 7.7
2. Travel to kiosk 25 8.3 25 8.6 19 5.0 18 4.9 31 11.1 21 7.7
12. Travel to personal screen 94 31.1 83 28.6 123 32.7 118 32.0 48 17.2 30 10.9
13. Queue for BP & ID screen 89.25 29.6 89.25 30.8 140.25 37.3 140.25 38.1 126 45.0 135 49.2 15. Queue for personal
screen 47.25 15.6 47.25 16.3 55.5 14.8 55.5 15.1 33.75 12.1 60 21.9 17. Gather personal
belongings 18.5 6.1 18.5 6.4 16.5 4.4 16.5 4.5 5 1.8 7.5 2.7
TOTAL 302 31.4 290 31.7 376.25 34.6 368.25 35.6 279.75 25.4 274.5 27.4 Necessary but wasteful steps that EXCEED passenger expectations
3. Queue for kiosk 6.75 6.67 10.50 11.11 20.25 15.98 24.00 16.93 9.00 2.78 11.25 10.00
5. Queue for counter 94.50 93.33 84.00 88.89 106.50 84.02 117.75 83.07 315.00 97.22 101.25 90.00
TOTAL 101.25 10.52 94.50 10.32 126.75 11.66 141.75 13.71 324.00 29.48 112.50 11.24 Non-value-added steps for the passenger that should be ELMINATED
9. Travel to baggage screen 15.00 60.00 15.00 60.00 NA NA NA NA NA NA NA NA 10. Queue for baggage
screen 5.00 20.00 5.00 20.00 NA NA NA NA NA NA NA NA 11. Drop bags for baggage
screen 5.00 20.00 5.00 20.00 NA NA NA NA NA NA NA NA TOTAL 25.00 2.60 25.00 2.73