SPECIES RICHNESS AND DIVERSITY IN THE ATLANTIC RAINFOREST AND ASSOCIATED ECOSYSTEMSN NICHE ASSEMBLY THEORIES AND
NEUTRAL FORCES
Tese apresentada à Universidade Federal de Viçosa, como parte das exigências do Programa de Pós#Graduação em Botânica, para obtenção do título de
.
VIÇOSA
ii
Delight itself, however, is a weak term to express the feelings of a naturalis who, for the first time, has wandered by himself in a Brazilian forest.
iii
AGRADECIMENTOS
À minha esposa Patrícia por ser um ótimo cônjuge, mas também pela convivência de
todas as decepções e dificuldades, bem como as conquistas e descobertas
enfrentadas durante esse doutoramento, pela correção da minha produção textual
e pelo preparo de um coquetel delicioso e inesquecível para comemorar a conclusão
do meu curso.
À minha filha Emmily, que indica o que realmente importa na vida quando fala
“Papai, brincar!”.
Aos meus pais, por tudo que me ofereceram na vida e pela formação excelente que
me habilitou concluir esse curso num pais que não é o meu.
Aos orientadores, professores, colegas dos diversos programas que cursei,
estagiários, ajudantes de campo e os amigos que contribuíram para esse tese e para
iv
Resumo vi
Abstract viii
General Introduction 1
Chapter 1N Floristic Composition, Species Richness and Diversity of campo rupestre vegetation from Itacolomi
State Park, Minas Gerais, Brazil 8
Abstract 10
Resumo 11
1. Introduction 13
2. Material and Methods 14
3. Results 17
4. Discussion 28
5. Conclusions 30
6. References 31
Chapter 2N How many species are there in the Itacolomi
State Park? 40
Abstract 42
Introduction 43
Methods 44
Results 45
Discussion 47
Conclusions 51
Notes on Contributers 52
References 53
Chapter 3N Primary forests diagnosis in Brazilian Atlantic
Rainforest 61
Abstract 63
Introduction 64
Material and Methods 66
Results 67
Discussion 74
Acknowledgements 77
Resumo 78
References 79
v
growth Forest Patch from Viçosa, Minas Gerais,
Southeastern Brazil 99
Resumo 101
Abstract 102
Introduction 103
Materials and Methods 104
Results 106
Discussion 118
Acknowledgments 121
Bibliografic references 121
Chapter 5N Hubbell´s Theory at Age TenN (Counter8) Evidence for Neutral Species Distribution in a Primary
Forest Patch from Southeastern Brazil? 129
Abstract 131
Introduction 132
Methods ‚134
Results 138
Discussion 149
BOX 1. What do the Fitting Parameters of Hubbell´s
Algorithm mean? 154
Acknowledgements 155
References 155
Supplement Material 163
vi
GASTAUER, Markus, D.Sc., Universidade Federal de Viçosa, abril de 2012.
Riqueza das espécies e diversidade na Mata Atlântica e ecossistemas associadosN Teorias de nichos e forças neutras. Orientador: João Augusto Alves Meira Neto. Coorientadora: Andreza Viana Neri.
Na primeira parte desta tese, dois levantamentos fitossociológicos realizados
em vegetação de são apresentados e comparados. A
primeira área de estudo fica bem protegida dentro do Parque Estadual do Itacolomi. Asegunda área é afetada por agropecuária, fogo, e demais atividades de urbanização. Como a área impactada mostra maior riqueza e diversidade, outros indicadores para a avaliação dessa vegetação são apresentados como o número de espécies invasoras, endêmicas ou ameaçadas de extinção. A partir desses dois estudos fitossociológicos, o
número de espécies de plantas de todo do Parque Estadual
vii
viii
GASTAUER, Markus, D.Sc., Universidade Federal de Viçosa, April, 2012.
Species richness and diversity in the Atlantic Rainforest and associated ecosystemsN Niche assembly theories and neutral forces. Adviser: João Augusto Alves Meira Neto. Co#adviser: Andreza Viana Neri.
ix
1
3
threatened and influenced by climate change (IPCC 2007), habitat loss and landscape´s fragmentation (Wright 2010), the discussion about what maintains species richness and diversity is still not at end. This lack of knowledge comprises especially the underlying – ecological – mechanisms like neutrality (Hubbell 2001), environmental sorting (Carvender#Bares . 2004) or niche assembly due to environmental heterogeneity (Hutchinson 1957) and negative density#dependant factors (Janzen 1971, Connell 1971) that may form and maintain species rich and diverse ecosystems.
Before the Europeans arrived in South America, the Atlantic Rainforest, once classified as a of biodiversity (Myers 2001) due to high species richness and a high degree of endemism (Stehmann 2010), covered between 1.300.000 and 1.500.000 km2 (Câmara 2005). Much of that has been logged and until today only 11 to 16 % of the original vegetation cover remainedin isolated fragments (Ribeiro 2009). Most of these fragments are secondary forests smaller than 100 ha.
In the Espinhaço Mountain Range, these forests are displaced by rocky outcrop vegetation types above certain altitudes (usally above 900 m).These
(literally rockfields) are species#rich ecosystems containing many endemic species (Giulietti 1987, Conceição & Giulietti 2002; Caiafa & Silva 2005) over sandstones and shallow sandy soils.
Because most natural ecosystems are influenced by direct or indirect anthropogenic impacts, it is a great challenge to find out which part of natural ecosystems is pristine, which part is altered due to anthropogenic activities and how to evaluate intactness of a natural ecosystem. For whom is interested in these aspects of biodiversity and species richness, chapters 1 and 3 are recommended. In the first chapter, the importance of alternative indicators for intactness of vegetation like invasive, endemic or endangered species is discussed. In the third chapter, the hypothesis is tested that the Forest of Seu Nico (FSN), which never has been logged, still shows characteristics of a primary, pristine Atlantic Rainforest patch.
4
(Lewis 2006), declare biological hotspots (Myers 2000) and learn more about ecosystem function. Departing from two phytosociological surveys, the author tried to estimate the number of plant species from the Itacolomi State Park in the second chapter.
By forest dynamic studies, alterations within natural communities can be detected and – taken ecological theory in account (e.g. MacArthur & Wilson 1967, Hubbell 2001, Ernest et al. 2009) – assigned to major environmental alterations due to economic activities of humans. Like that, the role of habitat loss, landscape´s fragmentation and climate change on species richness, diversity and accumulation of biomass in the FSN are highlighted in the forth chapter.
Finally, in the fifth chapter of this thesis, different theory – neutral and non# neutral ones – competingin explaining spatial species distribution patterns are tested by different methods (Leibold 2004, Chave 2008). Looking for species#environment correlations, fitting species abundance distributions, comparing similarity between different tree communities and revealing the phylogenetic community structure, neutral models (Hubbell 2001) are tested versus non#neutral ones (Hutchinson 1957, Carvender#Bares 2004). From that, the author hopes to answer questions about the factors that guarantee the co#existence of a high variety of species in tropical forests and associated ecosystems.
References
CAIAFA,N. A. AND A.F. SILVA. 2005. Composição floristica e espectro biológico de um campo de altitude no Parque Estadual da Serra do Brigadeiro, Minas Gerais – Brasil. Rodriguésia 56: 163#173.
5
Atlântica/Conservação Internacional, São Paulo/Belo Horizonte, BR.
CARVENDER#BARES , J., D. D. ACKERLEY, D. A. BAUM, AND F. A. BAZZAZ. 2004. Phylogenetic overdispersion in Floridian oak communities. Am Naturalist 163: 823#843.
CHAVE,J.2009.Competition, Neutrality, and Community Organization. In: LEVIN, S.A. (Ed.). The Princeton Guide to Ecology, pp. 264#273. Princeton University Press, Princeton, UK.
CONCEIÇÃO, A. A. AND A. M. GIULIETTI, 2002. Composição florística e aspectos estruturais de campo rupestre em dois platôs do Morro do Pai Inácio, Chapada Diamantina, Bahia, Brasil. Hoehnea 29:37#48.
CONNELL, J.H. 1971. On the role of natural enemies in preventing competitive exclusion in some marine animals and in rain Forest trees. In: BOER, P.J. AND GRADWELL, G. R. (Eds.). Dynamics of Populations, pp 198#310. Center for Agricultural Publishing and Documentation, Wageningen, BE.
ERNEST K. M.,E.P.WHITE AND J.H.BROWN. 2009. Changes in a tropical forest support metabolic zero#sum dynamics. Ecol Lett 12: 507–515.
GIULIETTI A. M., N. L. MENEZES, J. R. PIRANI, M. MEGURO, AND M. G. L. WANDERLEY. 1987. Flora da Serra do Cipó, Minas Gerais: Caracterização e lista das espécies. Bol Bot Univers São Paulo 9:1#151.
HUBBEL, S. P. 2001. The Unified Theory of Biodiversity and
Biogeography.Princeton University Press, Princeton, UK.
HUTCHINSON,G.E. 1957. Concluding remarks.Cold Spring Harbor Symposia on
6
2007 – The Physical Science Basis. Contribution of Working Group I to the Forth Assessent Report of the IPCC. Cambridge University Press,Cambridge, UK.
JANZEN, D. H. 1970. Herbivores and the number of tree species in tropical forests. Am Naturalist 104: 501#528.
LEWIS, O. T. 2006. Climate change, species#area curves and the extinction crisis. PhilTrans R Soc B 361:163#171.
LEIBOLD, M. A., M. HOLYOAK, N. MOUQUET, P. AMARASEKARE, ET AL. 2004. The metacommunity concept: a framework for multi#scale community ecology. Ecology Letters 7: 601#613. doi: 10.1111/j.1461#0248.2004.00608.x
MACARTHUR, R., AND E. O. WILSON. 1967.The Theory of Island Biogeography. Princeton University Press, Princeton, 203 p.
MYERS, N., R. A. MITTERMEIER, C. G. MITTERMEIER, G. A. B. FONSECA, AND J. KENT.2000. Biodiversity hotspots for conservation priorities. Nature 403:453# 458.
RIBEIRO, M.C., J. P. METZGER, A. C. MARTENSEN, F. J. PONZONI, AND M. M. HIROTA. 2009. The Brazilian Atlantic Forest: How much is left, and how is the remaining forest distributed? Implications for conservation. BiolConserv 142: 1141–1153.
STEHMANN, J. R., R. C. FORZZA, A. SALINO, M. SOBRAL, D. P. COSTA, AND L. H. Y.KAMINO (Org.) 2009. Plantas da Floresta Atlântica. Instituto de Pesquisas Jardim Botânico do Rio de Janeiro, Rio de Janeiro, BR.
8
CHAPTER 1*
Floristic Composition, Species Richness and Diversity
of campo rupestre vegetation from the Itacolomi State
Park, Minas Gerais, Brazil
9
Floristic Composition, Species Richness and Diversity of
vegetation from the Itacolomi State Park, Minas Gerais, Brazil
Markus Gastauer1, Maria Cristina Teixeira Braga Messias2 & João Augsuto Alves Meira Neto1*
1
Plant Ecology Laboratory, Plant Biology Department, Federal University of Viçosa, Viçosa, 36570#000, Minas Gerais, Brazil
2
Department of Biodiversity, Evolution and the Environment. Federal University of Ouro Preto, 35400#000, Ouro Preto, Minas Gerais, Brazil. e#mail: cristina@iceb.ufop.br
*
10
Abstract
Nevertheless are considered species rich and diverse vegetation formations, phytosociological surveys from the Itacolomi State Park, Minas Gerais, Brazil are lacking in scientific literature. To close this gap, we compared floristic composition, species richness and diversity from two sites, Lagoa Seca and Calais, situated within the park. Calais is moderately impacted by extensive pasture, fire, and settling activities. Both surveys contained 15 plots of 10 x 10 m, cardinality of each species was estimated. Beside species#richness, the indexes of Shannon#Wiener, Fisher’s α, the community richness estimator Jackknife 1 and the numbers of endemic, endangered and invasive species were compared. With 107 species, the moderately impacted Calais showed higher species richness than Lagoa Seca (76 species). The indices of Shannon#Wiener and Fisher’s α, the community richness estimator, as well as point diversity and spatial turnover derived from the species#area relationship (SAR) indicated higher diversity for Calais. From Lagoa Seca, 30% of all species are endemic to the Atlantic Rainforest or to Cerrado, and four species are endangered, not any species found in Lagoa Seca is described as an invasive one. On the other hand, 23 species found in Calais are invasive species, only one from all 107 species is endangered. Only 19% of all species found in Calais are endemic. Nevertheless species richness and diversity differ between both study sites, they are exceptionally high compared to similar vegetation formations from further regions. This justifies the declaration of the park as a local hotspot of biodiversity. Furthermore, our results prove that species richness or diversity measures are inappropriate criteria to evaluate the intactness of
vegetation. More weight should be put on criteria like numbers of invasive, endemic or endangered species.
11
Resumo
12
13
1. Introduction
In the Brazilian Mountain Ranges, forests are displaced by rocky outcrop vegetation types above certain altitudes (usually 900 m, SCOLFORO; CARVALHO, 2006). These rock fields are species#rich ecosystems containing many endemics (CAIAFA; SILVA, 2005; CONCEIÇÃO; GIULIETTI, 2002; GIULIETTI et al., 1987; JACOBI et al., 2008; MESSIAS et al., 2011; PIRANI et al., 1994; ROMERO; NAKAJIMA, 1999). Although endangered due to the intensification of grazing, fire clearing, continued urbanization, dispersion of invasive plant species, collection of endangered (medical) plants, mining activities and nutrient input from industry and traffic (PIRANI et al., 2003), still little is known about species composition and diversity of these ecosystems (ALMEIDA, 2008; MESSIAS et al., 2011; MOURÃO; STEHMANN, 2007).
Due to the geological underground, three different types of rocky outcrop vegetation can be distinguished, but differentiation is not unambiguous (ALVES; KOLBECK, 2009). We adapt the Alves and Kolbeck (2009) system, where (MARTINELLI et al., 1989), a term synonym for Brazilian (SAFFORD, 2007), is restricted to granite and nephelin# syenite soils. (sometimes missleadingly called
) is bound to ironstone outcrops or lateric crusts (JACOBI et al., 2007). Finally, are found on quartzite outcrops or white sand only.
The Espinhaço Mountain Range forms the transition zone between the Atlantic Rainforest and the Cerrado biome (IBGE 2004). In the Iron Quadrangle, the Southern part of the Espinhaço Mountain Range where the
Itacolomi State Park is located, a mosaic of , ,
Seasonal Semideciduous Mountain Forests and associated vegetation forms (DUTRA et al., 2009; PERON, 1989), forms an extremely species#rich and diverse landscape (FUNDAÇÃO BIODIVERSITAS, 2005).
14
2008), but systematic phytosociological surveys measuring and comparing biological diversity are widely lacking for this region.
The aim of this paper is to close this gap presenting phytosociological surveys from two study sites within and nearby the Itacolomi State Park focusing on two topics: It is first tested, if the species richness and diversity found within and around the park is above average as described from literature. As both study sites differ in their disturbance regime, different indicators to measure and evaluate the intactness, i.e. the absence of
impairments, of vegetation.
2. Material and Methods 2.1. Study Sites
The first study site, Lagoa Seca (dry pond in English), is situated near a periodically inundated area at the coordinates 20°26’ S and 43°29’ W, 1600 m above sea level. The second area, joining the margin of the park and the Ouro Preto urban district of Calais, is located at 20°25’ S and 43°30’ W at an altitude of 1270 m above sea level. Distance between both study sites is about three kilometres.
15
2.2. Data collection
The phytosociological survey was carried out in February 2009 using the plot method (MUELLER#DOMBOIS; ELLENBERG, 1974; NEWTON, 2007). In each study site, fifteen plots of 10 x 10 m were arranged in three rows. The distance between plots, both within and between rows, was 10 m.
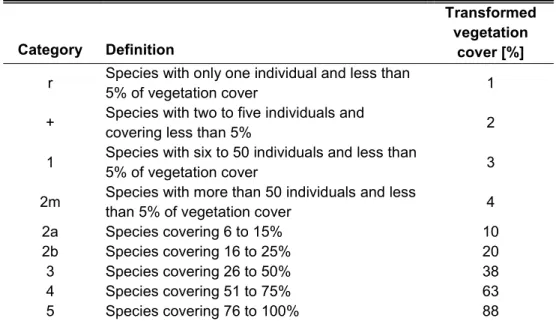
All species within plots were collected, identified and grouped according to the Angiosperm Phylogeny Group (APG III 2009). The cardinality of each species was estimated using a combination of abundance (i.e. number of individuals or shoots) and vegetation cover as proposed by Reichelt and Wilmanns (1973, Table 1). All the collected specimens were herborized and deposited in the “Professor José Badini Herbarium” (OUPR) of the Federal University of Ouro Preto.
2.3. Floristic composition
The presence of invasive, endemic and threatened species was verified. Invasive species are exotic species, i.e. species which do not naturally occur in the studied area, as well as ruderal species indicating disturbances or impacts according to Aranha et al. (1982), Bacchi et al (1984) and Leitão Filho et al. (1982). Endemic species are species endemic to the Cerrado or to the Atlantic rainforest biomes or species occurring in both biomes, but lacking in others. The species endemism data were taken from Stehmann et al. (2009) and Forzza et al. (2010). We consulted COPAM (2008) for information about threatened species. This is the most recent, but still unofficial red list of Minas Gerais.
2.4. Species richness and diversity measures
The number of species (i.e. species richness) was compared between both study sites.
16
Based on presence#absence data only, the community richness for each study site was estimated by Jackknife 1. This estimator was calculated with EstimateS (Colwell; Coddington 1994).
The Sørensen similarity has been calculated between all 15 plots from each study site with the software EstimateS. Furthermore, Sørensen and Jaccard similarity has been computed between both study sites, using the same computer package.
Table 1 – Categories of species cardinality, defined according to Reichelt & Wilmanns (1973) and transformation to vegetation cover, an indirect measure for abundance
Tabela 1 – Categorias de cardinalidade das espécies, definidas de acordo com Reichelt & Wilmanns (1973) e sua transformação para cobertura vegetal, uma medida indireta de abundância
Category Definition
Transformed vegetation
cover [%]
r Species with only one individual and less than
5% of vegetation cover 1
+ Species with two to five individuals and
covering less than 5% 2
1 Species with six to 50 individuals and less than
5% of vegetation cover 3
2m Species with more than 50 individuals and less
than 5% of vegetation cover 4
2a Species covering 6 to 15% 10
2b Species covering 16 to 25% 20
3 Species covering 26 to 50% 38
4 Species covering 51 to 75% 63
5 Species covering 76 to 100% 88
2.5. Species8area relationships (SAR)
17
transformation, the intercept of the SAR with the y#axis is a proxy of point or α#diversity, while the slope describes the difference between plots and might therefore be interpreted as a proxy for spatial turnover, or β#diversity (CONDIT et al., 1996).
3. Results
3.1. Floristic composition
In Lagoa Seca, 76 species from 55 genera and 25 families were found. In Calais the species richness was higher, with 107 species from 82 genera and 33 families (Table 2). The number of species per plot varied between 16 and 33 (on average 23.3 ±4.98) in Lagoa Seca and from 21 to 43 (on average 31.9 ±7.74) in Calais. Twenty two species occurred in both surveys.
The most abundant families in both surveys were Asteraceae, Poaceae, Cyperaceae and Melastomataceae. The family Fabaceae, well#represented in Calais, was absent in Lagoa Seca. Orchidaceae showed a greater richness in the Lagoa Seca area (6 species) compared with Calais (1 species).
From the total of 161 collected species in both study sites, four are considered as endangered according to COPAM (2008):
, ! and which
occurred only in the Lagoa Seca area, while the fourth, " was found in both study sites.
Twenty two species occurring in Calais, but none of those from the Lagoa Seca area, were considered invasive species (Table 2). Three of them,
# , , and $ " are species
introduced to South America by humans.
18
Table 2 – Species list from two phytosociological surveys of
vegetation at Lagoa Seca and Calais, Itacolomi State Park, Minas Gerais, Brazil, with endemism to the Cerrado or Atlantic Rainforest biomes, and further information about endangerment and their invasive character. ARF is species endemic to the Atlantic Rainforest biome; CE is endemic to the Cerrado biome, CE#ARF is endemic to Cerrado and Atlantic Rainforest biomes, EX is exotic species, CR is critically endangered, IP is invasive species, VU is vulnerable threatened according to COPAM (2008). * Information from Stehmann et al. (2009), ** information from Forzza et al. (2010)
Tabela 2 – Lista de espécies de dois levantamentos fitossociológicos de
vegetação de em Lagoa Seca e Calais, Parque Estadual do
Itacolomi, Minas Gerais, Brasil, com endemismo para os biomas Cerrado e Mata Atlântica, e informações sobre sua vulnerabilidade e seu caráter invasivo. ARF é espécie endêmica ao bioma Mata Atlântica; CE é espécie endêmica ao bioma Cerrado, CE#ARF é espécie endêmica nos dois biomas Cerrado e Mata Atlântica, EX é espécie exótica, CR é espécies criticamente ameaçada, IP é espécie invasora, VU é espécie vulnerável. * informações segundo Stehmann et al. (2009), ** informações segundo Forzza (2010)
Family/Species Lagoa
Seca Calais Endemism
Endangerment / invasive character LYCOPODIOPHYTA Selaginellaceae sp. X PTERIDOPHYTA Anemiaceae
% Humb. &
Bonpl. Kunth
X
Blechnaceae
& " '
(Klotzsch) C.Chr.
X CE#ARF**
19
Table 2. Continued.
Family/Species Lagoa
Seca Calais Endemism
Endangerment / invasive character Gleicheniaceae (Schrad.) Underw.
X IP
Polypodiaceae
(L.) M.G.Price
X
ANGIOSPERMS 8 MAGNOLIIDS Annonaceae
( A.St.#Hil. X ARF**
Aristolochiaceae
% sp. X
ANGIOSPERMS 8 MONOCOTS Bromeliaceae
! '
Mez
X CE#ARF**
Cyperaceae
) " sp. X
(Kunth) Boeckeler
X
" (L.) Britton
X IP
cf. Link X IP
sp.1 X
sp.2 X
sp.3 X
Sw. X X
sp. X
*
(C.B.Clarke) H.Pfeiff.
X X ARF*
sp.1 X X
sp.2 X
sp.3 X X
sp.4 X
Commelinaceae
J.C.Mikan
X ARF*
* " Mart. X
Dioscoreaceae
sp. X
Hypoxidaceae
+ " L. X
Iridaceae
, cf. (Seub.
Klatt) Sprague
X CE#ARF**
20
Table 2. Continued.
Family/Species Lagoa
Seca Calais Endemism
Endangerment / invasive character Spreng. X Orchidaceae " (Rchb.f.) Campacci X ! (Rchb.f.) Campacci
X VU
Barb.Rodr.
X
+ " cf. Barb.Rodr.
X CE#ARF**
+ " sp. X
(Aubl.) Garay X sp. X Poaceae %
-X IP
% (Renvoize
& Zuloaga) Zuloaga & Morrone
X CE#ARF**
% sp. X
% (Nees)Kuhlm. X
sp. X
(Kunth)Steud.
X IP
. " "
(Trin.)Döll
X X
# P.Beauv. X EX IP
/
(Döll)Henrard
X
Mez X X
! Hack. X X
Trin. X
Nees Trin.
X
Poir. X
Flüggé X IP
Michx. X
(Sw.)Rich. X IP
cf. L. X EX IP
0
(Retz.) Alston
X X
" Longhi# Wagner & Boechat
X X CE** VU
21
Table 2. Continued.
Family/Species Lagoa
Seca Calais Endemism
Endangerment / invasive character $ " (Stapf)
R.D.Webster
X EX IP
sp.1 X
sp.2 X X
sp.3 X
Smilaceae
" Pohl Grieseb.
X CE**
Velloziaceae
1 0 Mart.
Schult. & Schult. f.
X CE**
Xyridaceae
2 cf. Mart. X CE**
2 sp.1 X
2 sp.2 X
ANGIOSPERMS 8 EUDICOTS Acanthaceae
(Nees) Lindau
X
Amaranthaceae
% sp. X
Apiaceae
Cav. & Dombey F.Delaroche
X Apocynaceae / Mart. X Araliaceae
+ 3 3 " Ruiz & Pav.
X
Asteraceae %
(Loefl.) Kuntze
X IP
% (Lam.)
DC
X X
& (Vell.) DC X
& Vahl X
& DC. X IP
& DC. X
& DC. X
& (Lam.) Pers.
X X
22
Table 2. Continued.
Family/Species Lagoa
Seca Calais Endemism
Endangerment / invasive character
& sp. X X
(L.) Pol. X IP
45 6
H.Rob.
X IP
(DC.) Sch.Bip.
X CE#ARF**
(DC.) MacLeish
X X CE#ARF**
(Less.) Less.
X X
sp. X
-(Gardner) R.M.King & H.Rob.
X
# ' DC. X X CE#ARF**
# ' sp. X
Kuntze X CE**
(Gardner) Kuntze
X CE** VU
Bong. X X CE#ARF**
sp. X
Sch.Bip. Baker
X CE**
* sp. X
1 sp.1 X
1 sp.2 X
Boraginaceae
1 7 3 X
Campanulaceae
5 " Pohl X CE#ARF**
Droseraceae
A.St.#Hil. X
Fabaceae
% Schltdl.
& Cham. X (L.) Greene X (Pers.) Greene X
sp. X
" " Vogel X ARF* (Sw.)
DC.
X IP
" " (L.) Benth.
X IP
23
Continued...
Table 2. Continued.
Family/Species Lagoa
Seca Calais Endemism
Endangerment / invasive character
# sp. X
(Vell.) Taub.
X
(G.Don) H.S.Irwin & Barneby
X
(L.) Sw. X
8 Sm. X
Lamiaceae
+ Pohl
Benth.
X X CE**
+ Mart.
Benth.
X CE#ARF**
Lentibulariaceae
( Benj. X
$ Salzm.
ex A.St.#Hil. & Girard
X
Lythraceae
(Jacq.) J.Macbr.
X
sp. X
" (Cham. & Schltdl.) A.DC.
X CE**
Malpighiaceae &
(A.Juss.) Little
X
& " A.Juss. X X
+ p. X
Malvaceae
Cav. X
9 sp. X
Melastomataceae "
(Kunth) DC.
X X CE#ARF**
5 sp. X
5 cf. (Cham.)
Cogn.
X ARF*
# DC. X CE**
# sp.1 X
# sp.2 X
# Mart. X CE#ARF**
# sp.1 X
# sp.2 X
# sp.3 X
* " (Humb. & Bonpl.) Cogn.
24
Continued...
Table 2. Continued.
Family/Species Lagoa
Seca Calais Endemism
Endangerment / invasive character * " (D.Don)
Cogn.
X CE#ARF**
Myrsinaceae
% sp. X
# " # X ARF**
Myrtaceae
# 0 DC. X
# DC. X
# (Sw.) DC. X X
# " DC. X ARF**
Polygalaceae
L. X X
Aubl. X
Proteaceae
Aubl. X
Rosaceae
" " Mart. X IP
Rubiaceae
(Walter) Small X IP
& (L.) G.Mey X IP
Rutaceae
A.Juss.
X
Salicaceae
Sw. X
Sapindaceae
# " Radlk. X CE#ARF**
Solanaceae
& " (Spreng.) L.B.Sm. & Downs
X CE#ARF**
! ' Rooyen
L.
X
Mill. X IP
cf. Dunal
X X #
Verbenaceae
5 L. X IP
5 Lindl. X IP
5 Cham. X CE**
Schauer
X CE** CR
25
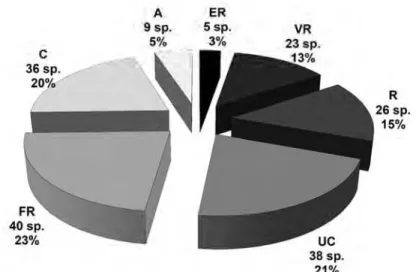
Figure 1 – Percentage of species endemic to the Atlantic Rainforest or the Cerrado biome found in Lagoa Seca (A) and Calais (B), two
phytosociological surveys of vegetation, Itacolomi State Park, Minas Gerais, Brazil. ARF is the percentage of species occurring only in the Atlantic Rainforest biome, CE is the percentage of species occurring only in the Cerrado biome, and CE#ARF is the percentage of species endemic to both biomes.
Figura 1 – Percentagem de espécies endêmicas nos biomas Mata Atlântica e Cerrado encontradas em Lagoa Seca (A) e Calais (B), dois levantamentos fitossociológicos de vegetação de campo rupestre, Parque Estadual do Itacolomi, Minas Gerais, Brasil. ARF é a percentagem das espécies ocorrendo somente dentro do bioma Mata Atlântica, CE é a percentagem das espécies ocorrendo somente dentro do bioma Cerrado, e CE#ARF são espécies endêmicas para ambos os biomas.
3.2. Biodiversity measures
Due to the dominance of # in Calais, the indexes of Shannon#Wiener, Simpson, Berger#Parker and evenness indicated higher biodiversity in the Lagoa Seca study site (Table 3). On the other hand, Fisher’s α suggested higher biodiversity for the Calais area. The estimator Jackknife 1 indicated lower community richness for the Lagoa Seca area (Figure 2).
26
The Sørensen similarity between both surveys is 0.240, the Jaccard similarity 0.158.
Figure 2 – Community richness estimators Jackknife 1 for Lagoa Seca and Calais, two phytosociological surveys from campo rupestre vegetation, Itacolomi State Park, Minas Gerais, Brazil.
Figura 2 – Jackknife 1, um estimador de riqueza da comunidade para Lagoa Seca e Calais, dois levantamentos fitossociológicos de vegetação de
, Parque Estadual do Itacolomi, Minas Gerais, Brasil.
3.3. SAR
The species#accumulation curves of both study sites did not stabilize within the area analysed in both surveys (Figure 3). Their fittings with the power model show strong correlation coefficients (Lagoa Seca: Number of species = 3.308 area0.434, r2 = 0.9915; Calais: Number of species = 4.156 area0.4519, r2 = 0.9908). Linearized after logarithmic transformation, both regressions showed high significance (Lagoa Seca: F1;3 = 350.9, p < 0.001; Calais: F1;3 = 302.8, p < 0.001). This linear regression indicated slightly higher point diversity and spatial turnover for the Calais area (intercept, i.e. point diversity:
0 25 50 75 100 125 150
0 300 600 900 1200 1500
Lagoa Seca Calais
Area [m2]
C
o
m
m
u
n
it
y
R
ic
h
n
e
s
27
0.6187 ±0.0679, slope, i.e. spatial turnover 0.4519 ±0.0259) than for Lagoa Seca (intercept 0.5197 ±0.0607, slope 0.4343 ±0.0232).
Figure 3 – Species#accumulation curves from Lagoa Seca and Calais, two phytosociological surveys in vegetation, Itacolomi State Park, Minas Gerais, Brazil. Vertical bars indicate standard deviation.
Figura 3 – Curva de acumulação de espécies em Lagoa Seca e Calais, dois levantamentos fitossociológicos em vegetação de campo rupestre, Parque Estadual do Itacolomi, Minas Gerais, Brasil. As barras verticais indicam o desvio padrão.
Table 3 – Biodiversity indices of Lagoa Seca and Calais, two areas of
vegetation, Itacolomi State Park, Minas Gerais, Brazil, derived from phytosociological surveys. H’ is Shannon#Wiener index and α is Fisher’s α Tabela 3 – Índices de biodiversidade de Lagoa Seca e Calais, duas áreas de vegetação de campo rupestre, Parque Estadual do Itacolomi, Minas Gerais, Brasil, derivado de levantamentos fitossociológicos. Hʼ é o índice de Shannon#Wiener e α é Fisher´s α
Lagoa Seca Calais
H’ 3.49 3.58
28
4. Discussion
Both study sites showed high levels of species richness compared to other phytosociological studies of and similar vegetation forms (CONCEIÇÃO; GIULETTI, 2002; JACOBI et al., 2008; LEMES 2009). The Shannon#Wiener index showed higher diversity for both study sites in and around Itacolomi State Park than for quartzite#sandstone
in the Pai Inácio Mountains, in Chapada Diamantina, Bahia, Brazil (CONCEIÇÃO et al., 2007). These comparisons give further evidences to the high species richness and diversity already related for the park (ALMEIDA, 2008) and the Iron Quadrangle (FUNDAÇÃO BIODIVERSITAS, 2005) and justify the park´s classification as a local hotspot of biodiversity.
The inclination of the linearized SAR is around 0.25 for terrestrial plants (ROSENZWEIG, 1995). Within our surveys this value is nearly doubled, with 0.43 (Lagoa Seca) and 0.45 (Calais). This might be a consequence of a small sampling area (DOLNIK; BREUER 2008) and non#contiguous plot design (DENGLER, 2008). Nevertheless, the SAR’s high slope values indicated high spatial turnover or beta diversity for the Itacolomi State Park, which have already been described for rock fields in general (JACOBI et al., 2007).
Low similarities between both study sites reinforce the affirmation of
being species#rich ecosystems with a high degree of endemism (GIULIETTI et al., 1987; MENINI NETO et al., 2007; NAKAJIMA; SEMIR, 2001) and highlight once more the importance of the Itacolomi State Park.
Similar Shannon#Wiener diversity index values were found for Cerrado vegetation (NERI et al., 2007), while Atlantic Rainforest sites – either evergreen or deciduous – of nearby regions are more diverse (SILVA et al., 2004; WERNECK et al , 2000).
Fisher’s α ranges from 25 to 195.1 for tropical forests (LOSOS; LEIGH JR., 2004) and from 12.60 (±0.73, ANDRADE et al., 2002) to 19.83 (±1.84, MARIMON; HARIDASAN, 2005) for Cerrado vegetation. Congruently with the index of Shannon#Wiener, Fisher´s α indicates diversity for
29
forests. Its ranking between savannah and forest vegetation highlights the
localization of the from the Espinhaço Mountain Range in
the ecotone between the Cerrado and the Atlantic Rainforest biome.
Nevertheless both study sites show high levels of species richness and diversity, those of Calais are even higher than that of Lagoa Seca. This is an unexpected result, because Lagoa Seca is the better protected area, while evidences for anthropogenic impacts were found during survey.
Although these impacts were not quantified, more registered species, higher community richness, higher biodiversity indices of Shannon#Wiener and Fisher´s α, lower similarity between plots as well as higher point diversity and spatial turnover in Calais support the intermediate disturbance hypothesis (CONNELL, 1978). According to this well accepted hypothesis (i.e. MOLINO; SABATIER, 2001), species richness and diversity are at maximum when disturbances are neither too rare nor too frequent because in this case ruderal, invasive or pioneer species are able to coexist with competitive ones. The presence of 22 invasive species contributed to the higher species richness in Calais and supports the hypothesis because anthropogenic disturbances prevent competitive exclusion of these species (HUGHES, 2010; SAX et al., 2002; SAX; GAINES 2003).
However, as outlined by Hughes (2010), the relationship between disturbance and diversity operates in both directions, since disturbances influence diversity, changing the response to future disturbances (HUGHES et al. 2007; LYONS et al., 2005). This and the lack of true replicates within our research impede generalizations. Further surveys are necessary to test the pattern before its final acceptance.
Although there are no true replicates, this study shows that species richness and diversity are poor predictors of the intactness of
vegetation. Therefore, further parameters should be consulted for their evaluation (USHER, 1980).
30
endangered species than Calais. Furthermore, there are fewer orchid species in the better#accessible Calais. Some of them, especially
spp. and , are popular ornamental plants with
market values. Collecting activities in the less protected Calais area might explain the lack of most orchids in this study site.
Recent studies (i.e. LIEBSCH et al., 2008, GASTAUER et al., unpublished data) highlight the presence of endemic species as indicators for habitat intactness. As vegetation from the Espinhaço Mountain Range is situated on the ecotone between the Cerrado and Atlantic Rainforest biome, endemics from both biomes are expected emphasising the transitional character of this vegetation between both biomes (BENITES et al., 2003).
The absolute number of species endemic to the Atlantic Rainforest and the Cerrado biome does not differ between both study sites. But due to higher species richness, the percentage of endemic species is hence lesser in the impacted Calais than in Lagoa Seca.
We are aware that reduced percentages of endemic species might be due to a dilution effect because of the presence of invasive species increasing overall species richness as observed in Calais. But we can also imagine that endemic species as well as endangered ones show higher risk to go extinct under regimes of high disturbances. Therfore, we suggest the criterion “percentage of endemic species” as an indicator to evaluate the intactness of vegetation in further research activities. The presence of around one third of all species endemic to the biomes Atlantic Rainforest and Cerrado should be used as a reference for further surveys in
.
5. Conclusions
31
vegetation from the Espinhaço Mountain Range between both biomes.
We showed that species richness and diversity are poor indicators for the intactness of vegetation and suggest further parameters like number of endangered, exotic or invasive species, pauperization of ornamental or medical plants as well as percentage of endemic species as more robust indicators. We suggest a magnitude of 30 % of species endemic to the Atlantic Rainforest and the Cerrado biome for intact
patches.
6. References
ALMEIDA, G. S. S. Asteraceae Dumort. nos campos rupestres do Parque Estadual do Itacolomi, Minas Gerais, Brasil. 2008. Tese (Doutorado em Botânica). – Universidade Federal de Vicosa, Viçosa, 2008.
ALVES, R. J. V.; KOLBECK, J. Can campo rupestre vegetation be floristically delimited based on vascular plant genera? Plant Ecology, v. 207, p. 67–79, 2009.
ANDRADE, L. A. Z.; FELFILI, J. M.; VIOLATTI, L. Fitossociologia de uma área de cerrado denso na RECOR#IBGE, Brasília#DF. Acta Botanica Brasilica, v. 16, n. 2, p. 225#240, 2002.
APG III (ANGIOSPERM PHYLOGENY GROUP). An update of the Angiosperm Phylogeny Group classification for the orders and families of flowering plants: APG III. Botanical Journal of the Linnean Society, n. 161, p.105–121, 2009
32
ARRHENIUS, O. Species and area. Journal of Ecology, v. 9, p. 95#99, 1921.
BACCHI, O.; LEITÃO FILHO, H. F.; ARANHA, C. Plantas Invasoras de culturas, volumes 3. São Paulo: HUCITEC, 1984, 308p.
BATISTA, J. A. N.; BIANCHETTI, L. B.; NOGUEIRA, R. E.; PELLIZZARO, K. F.; FERREIRA, F. E. The genus + " (Orchidaceae) in the Itacolomi State Park, Minas Gerais, Brazil. Sitientibus série Ciências Biológicas, v. 4, n 1/2, p. 25#36, 2004.
BENITES, V. M.; CAIAFA, A. N.; MENDONÇA, E. S.; SCHAEFER, C. E.; KER, J. C. Solos e Vegetação nos Complexos Rupestres de Altitude da Mantiqueira e do Espinhaço. Floresta e Ambiente, n. 10, p. 76#85, 2003.
CAIAFA, N. A.; SILVA, A. F. Composição floristica e espectro biológico de um campo de altitude no Parque Estadual da Serra do Brigadeiro, Minas Gerais – Brasil. Rodriguésia, v. 56, n. 87, p. 163#173, 2005.
COLWELL, R. K.; CODDINGTON, J.A. Estimating terrestrial biodiversity through extrapolation. Philosophical Transactions of the Royal Society B,
v. 345, n. 1311, p. 101–118, 1994.
CONCEIÇÃO, A. A.; GIULIETTI, A. M. Composição florística e aspectos estruturais de campo rupestre em dois platôs do Morro do Pai Inácio, Chapada Diamantina, Bahia, Brasil. Hoehnea,v. 29, p. 37#48, 2002.
33
CONDIT, R.; HUBBELL, S. P.; LAFRANKIE, J. V.; SUKUMAR. R.; MANOKARAN, N.; FOSTER, R. B.; ASHTON, P.S. Species#area and species#individual relationships for tropical trees: a comparison of three 50# ha plots. Journal of Ecology, v. 84, p. 549#562, 1996.
CONNELL, J. H. Diversity in Tropical Rain Forests and Coral Reefs.
Science, v. 199, n. 4335, p. 1302#1310, 1978.
COPAM 2008. Lista das espécies ameaçadas de extinção da flora no Estado de Minas Gerais. Deliberação Conselho Estadual de Política Ambiental No 367, Anexo I.
DENGLER, J. Pitfalls in Small#Scale Species#Area Sampling and Analysis.
Folia Geobotanica, v. 43, p. 269#287, 2008.
DOLNIK, C.; BREUER, M. Scale dependency in the Species#Area Relationship of Plant Communities. Folia Geobotanica, v. 43, p. 305#318, 2008.
DUTRA, V. F.; GARCIA, F. C. P.; LIMA, H. C. Caesalpinioideae (Leguminosae) nos Campos Rupestres do Parque Estadual do Itacolomi, MG, Brasil. Acta Botanica Brasilica, v. 22, n. 2, p. 547#558, 2008.
DUTRA, V. F.; GARCIA, F. C. P.; LIMA, H. C. Papilionoideae (Leguminosae) nos Campos Rupestres do Parque Estadual do Itacolomi, MG, Brasil. Acta Botanica Brasilica, v. 23, n. 1, p. 145#159, 2009.
FORZZA, R. C. (Coord.). Lista de Espécies da Flora do Brasil. Acesso online http://floradobrasil.jbrj.gov.br/2010/, Março 2012.
34
GIULIETTI, A. M.; MENEZES, N. L.; PIRANI, J. R.; MEGURO, M.; WANDERLEY, M. G. L. Flora da Serra do Cipó, Minas Gerais: Caracterização e lista das espécies. Boletim de Botãnica da Universidade de São Paulo, v. 9, n. 1, p. 1#151, 1987.
HARLEY, R.M.; SIMMONS, N.A. Florula of Mucugê, a descriptive check8 list of a campo rupestre area. Kew, Royal Botanic Gardens, Kew, Wakehurst Place, Ardingly, West Sussex, 1986.
HUGHES, A. R.; BYRNES, J. E.; KIMBRO, D. L.; STACHOWICZ, J. J. Reciprocal relationships and potential feedbacks between biodiversity and disturbance. Ecology Letters, v. 10, p. 849#864, 2007.
HUGHES, A. R. Disturbance and Diversity: An Ecological Chicken and Egg Problem. Nature Education Knowledge, v. 1, p. 26, 2010.
IBGE (INSTITUTO BRASILEIRO DE GEOGRAFIA E ESTATÍSTICA). Mapa de Vegetação do Brasil 3rd edition. Brasilia: Instituto Brasileiro de Geografia e Estatística, 2004.
JACOBI, C. M.; CARMO, F.F.; VINCENT, R. C.; STEHMANN, J. R. Plant communities on ironstone outcrops: a diverse and endangered Brazilian ecosystem. Biodiversity and Conservation, v.16, p. 2185#2200, 2007.
JACOBI, C. M.; CARMO, F.F.; VINCENT, R.C. Estudo fitossociológico de uma comunidade vegetal sobre canga como subsídio para a reabilitação de áreas mineradas no Quadrilátero Ferrífero, MG. Revista Árvore, v. 32, n. 2, p. 345#353, 2008.
35
LEMES, F. O. A. Relações florísticas, fitossociológicas e aspectos edáficos de comunidade de campos rupestres da Serra do Itacolomi e Serra do Ouro Branco, Minas Gerais. Dissertação (Mestrado em Ecologia de Biomas Tropicais) – Universidade Federal de Ouro Preto, Ouro Preto, 2009.
LIEBSCH, D.; MARQUES, M. C. M.; GOLDENBERG, R. How long does the Atlantic Rain Forest take to recover after a disturbance? Changes in species composition and ecological features during secondary succession.
Biological Conservation, v. 141, p. 1717#1725, 2008.
LOSOS, E. C.; LEIGH JR., E. G. (Eds.) Tropical Forest Diversity and Dynamism. Findings from a Large8Scale Plot Network. The University of Chicago Press, Chicago, 2004. 645p.
LYONS, K. G.; BRIGHAM, C. A.; TRAUT, B. H.; SCHWARTZ, M. W. Rare Species and Ecosystem Functioning. Conservation Biology, v. 19, p. 1019# 1024, 2005.
MARIMON JR., B. H.; HARIDASAN, M. Comparação da vegetação arbórea e características edáficas de um cerradão e um cerrado sensu stricto em áreas adjacentes sobre solo distrófico no leste de Mato Grosso, Brasil. Acta Botanica Brasilica, v. 19, n. 4, p. 913#926, 2005.
MARTINELLI, G.; BANDEIRA, J.; BRAGANÇA, J. O. 1989. Campos de Altitude. Rio de Janeiro: Ed. Index, 1989. 160p.
36
MESSIAS, M. C. T. B.; LEITE, M. G. P.; MEIRA NETO, J. A. A.; KOZOVITS, A.R. Life#form spectra of quartzite and itabirite rocky outcrop sites, Minas Gerais, Brazil. Biota Neotropica, v. 11, n. 1, p. 1#20, 2011.
MOLINO, J. F.; SABATIER, D. Tree Diversity in Tropical Rain Forests: A Validation of the Intermediate Disturbance Hypothesis Science, v. 294, n. 5547, p. 1702#1704, 2001.
MOURÃO, A.; STEHMANN, J. R. Levantamento da flora do campo rupestre sobre canga hematítica couraçada remanescente na Mina do Brucutu, Barão de Cocais, Minas gerais, Brasil. Rodriguésia, v. 58, n. 4, p. 775#786, 2007.
MUELLER#DOMBOIS, D.; ELLENBERG, H. Aims and methods of vegetation ecology. New York: John Wiley & Sons, 1974, 475p.
NAKAJIMA, J. N.; SEMIR, J. Asteraceae do Parque Nacional da Serra da Canastra, Minas Gerais, Brasil. Revista Brasileira de Botãnica, v. 24, n. 4, p. 471#478, 2001.
NERI, A. V.; MEIRA NETO, J. A. A.; SILVA, A. F.; MARTINS, S. V.; BATISTA, M. L. Análise da estrutura de uma comunidade lenhosa em área de cerrado no município de Senador Modestino Gonçalves, norte de Minas Gerais, Brasil. Revista Árvore, v. 31, n. 1, p. 123#134, 2007.
NEWTON, A. C. Forest ecology and conservationN a handbook of techniques Oxford: Oxford University Press, 2007, 454p.
NIMER, E. Climatologia do Brasil. Rio de Janeiro: IBGE, 1989, 421p.
37
PERON, M. V. Listagem preliminar da flora fanerogâmica dos campos rupestres do Parque Estadual do Itacolomi – Ouro Preto/Mariana, MG.
Rodriguésia, v. 41, n. 67, p. 63#69, 1989.
PIRANI, J. R.; GIULETTI, A. M.; MELLO#SILVA, R.; MEGURO, M. Checklist and patterns of geographic distribution of the vegetation of Serra do Ambrósio, Minas Gerais, Brazil. Revista Brasileira de Botãnica, v. 67, n. 2, p. 133#147, 1994.
PIRANI, J. R.; MELLO#SILVA, R.; GIULETTI, A. M. Flora de Grão#Mogol, Minas Gerais, Brasil. Boletim de Botãnica da Universidade de São Paulo,
v. 21, n. 1, p. 1#24, 2003.
REICHELT, G.; WILMANNS, O. Vegetationsgeographie. Braunschweig: Westermann, Braunschweig, 1973. 210p.
ROMERO, R.; NAKAJIMA, J. N. Espécies endêmicas do Parque Nacional da Serra da Canastra, Minas Gerias. Revista Brasileira de Botânica, v. 22, n. 2 (suplemento), p. 259#265, 1999.
ROSENZWEIG, M. L. Species diversity in Space and Time. Cambridge: Cambridge University Press, 1995, 421p.
SAFFORD, H. D. Brazilian Páramos IV. Phytogeography of the campos de altitude. Journal of Biogeography, v. 34, p. 1701–1722, 2007.
SAX, D. F.; GAINES, S. D.; BROWN, J. H. Species invasions exceed extinctions on islands worldwide: a comparison of plants and birds.
American Naturalist,v. 160, n. 6, p. 766–783, 2002.
38
SCOLFORO, J. R.; CARVALHO, L. M. T. Mapeamento e inventário da flora nativa e dos reflorestamentos de Minas Gerais. Lavras: UFLA, 2006. 288p.
SILVA, N. R. S.; MARTINS, S.V.; MEIRA NETO, J. A. A.; SOUZA, A. L. Composição florística e estrutura de uma Floresta Estacional Semidecidual Montana em Viçosa, MG. Revista Árvore, v. 28, n. 3, p. 397#405, 2004.
STEHMANN, J. R.; FORZZA, R. C.; SALINO, A.; SOBRAL, M.; COSTA, D.P.; KAMINO, L. H. Y. (Eds.) Plantas da Floresta Atlântica. Rio de Janeiro: Instituto de Pesquisas Jardim Botânico do Rio de Janeiro, 2009. 505p.
USHER, M. B. An Assessment of Conservation Values within a large site of Special Scientific Interest in North Yorkshire. Field Studies, v. 5, p. 323#348, 1980.
40
CHAPTER2*
How many species are there in the Itacolomi State
Park?
41
RESEARCH ARTICLE
How many species are there in the Itacolomi State park?
Markus Gastauer1 and João A. A. Meira Neto1*
1
Laboratório de Ecologia Vegetal, Departamento de Biologia Vegetal,
Universidade Federal de Viçosa, 36570#000 Viçosa, Minas Gerais, Brazil
* Correspondence: João Augusto Alves Meira Neto, Departamento de
Biologia Vegetal, Campus UFV s/n, 36570#000 Viçosa, MG, Brazil. Tel.: +55 31 3899 1955, Fax: +55 31 3899 2580, Email: j.meira@ufv.br
42
ABSTRACT
BackgroundN As complete censuses of species richness of larger areas are difficult to realize, other approaches are necessary to achieve these interesting figures.
AimN Estimate the vascular plant species richness of
vegetation within the Itacolomi State Park and Brazil by different approaches in order to test consistency of methods for further applications.
MethodsN Species#area relationships (SAR), the taxon ratio and the Krishnamani model are applied on species lists from two phytosociological surveys.
ResultsN Concordantly, species richness has been estimated to the magnitude of 1100 species by the taxon ratio model and the power function of the SAR using the generally accepted slope of 0.25. If we accept a scale break between 0.5 and 1 ha, the total number of plant species of the park´s is estimated within the same magnitude by the Krishnamani model (1048 to 1226 species). Beyond that, the species richness of all in Brazil is estimated to 3467 (Krishnamani model) and to 4866 (power#law SAR´s extrapolation using a slope of 0.25).
ConclusionsN Increased confidence is given to the three methods, because they returned results in the same magnitude for the Itacolomi State Park; this inspires further utilization in other ecosystems.
43
Introduction
Mankind is interested in answering questions as “How many species are there on earth?” and “How many species are we going to lose because of habitat loss or climate changes?” (May 1988; Scotland and Wortley 2003). Variegating latter, we may ask “How many species do we protect?” or even “How many species can we protect?”
There are about 5 to 10 million of non#microbial species in the world (May 1997). But not only the world´s overall species richness summarized in a single, attention claiming number is an interesting figure but also an understanding of the extent of species distribution to predict extinction rates caused by human impacts or climate change (Lewis 2006), evolve conservation policies (Brooks et al. 2006; Killeen and Solórzano 2008; Pardini et al.2009; Ribeiro et al. 2009), declare biological hotspots (Myers et al. 2000; Orme et al. 2005) and learn more about ecosystem function (May and Beverton 1990).
The global species richness for single taxons, communities or ecosystems is rather estimated by extrapolation than being the result of an unaffordable, complete census (Raven 1985, Grassle and Maciolek 1992, Briggs and Snelgrove 1999, Bebber et al. 2007, Joppa et al. 2010). Such estimated numbers of species (e.g. vascular plant) within a regional entity, from a habitat type or a complete ecosystem, are important figures illustrating the state of current research as well as describing the lack of knowledge (Mora et al. 2011).
44
Brazilian States of Minas Gerais and Bahia, as well as on some sites in Goias State (Alves and Kolbek 2010).
Like other tropical ecosystems, : richness and diversity is threatened by habitat loss and climate changes (Pirani et al. 2003). Increased extinction rates exceeded taxonomical efforts, so that the actual loss of biodiversity cannot be recorded; many species vanish before having been described (Dubois 2003) underlining the importance of accurate estimations to gain an idea about what we are going to lose.
The aim of this paper is to estimate the total number of vascular plants of all from the Itacolomi State Park, Minas Gerais, Brazil. Starting from two sets of samples carried out within the park, different approaches are applied and compared. These findings are extrapolated to the whole ecosystem to discuss the actual conservation scenario and outline necessary consequences for the protection of this species#rich ecosystem.
Methods
Starting from two phytosociological surveys of 0.15 ha in Calais and Lagoa Seca, Itacolomi State Park (unpublished data), each one divided in 15 plots of 10 x 10 m, species#area relationships (SAR) were extrapolated using the power model proposed by Arrhenius (1921) as well as the logarithmic function (Gleason 1922). Distance between both surveys is 2.7 km.
As there are some well#studied taxons within the Itacolomi State Park, the taxon ratio model proposed by Colwell and Coddington (1994) is applied. Finally, we present an approach of decreasing z, i.e. the inclination of the SAR fitted by the porwer model and linearized in the log#log space, of the SARs to compute the number of total species (Krishnamani et al. 2004). For that, equation (5) from cited study is transformed to
×
= (1).
45
where z1 changes to z2, and A0 is the whole area of the park. z1 is the average inclination given by the rarefaction of the species#sampling curve with the power model, z2 is calculated by the following equation:
− =
χ
, (2)
whereinχ is the Sørensen index of similarity and d is the medium distance between both study sites.
The Itacolomi State Park holds 7543 ha; from that, 44% are mapped as corresponding an area of 3319 ha (Fujaco et al. 2010).
Results
A total of 161 species had been detected in both study sites, 23 of them occur in both surveys corresponding a Sørensen index of similarity of 0.240. In Lagoa Seca, 76 species had been sampled, the SAR is fitted to S = 3.308 * A0.434 by the power model (R2 = 0.9915, F1;3 = 350.9, p < 0.001) and S = 19.41 * ln(A) – 67.99 by the logarithmic model (R2 = 0.991). In Calais, 107 species had been found resulting in an SAR´s fitting of S = 4.156 * A0.4519 (power model, R2 = 0.9908, F1;3 = 302.8, p < 0.001) respectively S = 28.15 * ln(A) – 100.7 (logarithmic model, R2 = 0.992).
Extrapolating the logarithmic model to the whole park´s area results in an overall plant species richness of 268 (from Lagoa Seca survey) and 387 species (Calais). Using the power model, the number of vascular plant species within the park is estimated to 6077 (Lagoa Seca) or 10409 (Calais).
Accepting an inclination of the SAR´s slope of 0.25, the number of observed species
46
is estimated at average to 1116 species (927 from the Lagoa Seca sample, 1305 from the Calais survey).
Using the taxon ratio model, the total number of species within the park´s is estimated to 1148 species (Table 1) considering 8 recently, well#studied taxons.
Table 1
Taxon ratios and estimation of the park´s plant species richness as proposed by Colwell and Coddington (1994).
Source Taxon
Total number in park´s Number of species in our survey Factor Estimated number of species
Dutra et al. 2008 Caesalpinoideae 13 2 6.5 1047
Dutra et al. 2009 Papilionidae 28 8 3.5 564
Coser 2008 Bromeliaceae 21 1 21 3381
Rolim 2007 Pteridophytes 38 4 9.5 1530
Almeida 2008 Asteraceae 219 27 8.11 1306
Alves 1990 Orchidaceae 36 6 6 966
Batista et al. 2004 + " 15 2 7.5 1207.5
Thiago Rolim, personal communication
Melastomataceae 71 12 5.92 953
* * * Total 442 62 7.129 1148
Applying the Krishnamani (2004) model, the total number of species to be expected within park´s is calculated to 798, when the scale break A2 is set to the same size as the study area (0.15 ha):
( )
≈ = 47
Discussion
Considering the studies cited in Table 1 plus the 161 species found within our two surveys, 541 species have been detected already within the park´s . Further surveys (i.e. Peron 1989; Casarino et al. 2009) might enrich the list. Therefore, approaches estimating the
species richness of the complete park below this value are discarded.
This includes the extrapolations of the species#area curves fitted by the logarithmic function once proposed by Gleason (1922), nevertheless this model has been used to predict complete species richness successfully in surveys from other ecosystems (Condit et al. 2004).
It is not likely that about half or more of the Atlantic Rain Forest flora (Myers et al. 2000; Stehmann et al. 2009) might be found within the limits of the Itacolomi State Park´s . Therefore, the extrapolations of the power model have to be discussed with caution, although this model is well studied and generally well accepted (Brown et al.2002; Martin and Goldenfield 2006), and good fittings (Gastauer, unpublished data) lead into temptation to extrapolate these findings.
In fact, slopes of the linearized species#area relationships are not a sample# size independent figure constant over different magnitudes (Condit et al. 1996; Conner and McCoy 2001), but decrease with increasing sample size (Dolnik and Breuer 2008). This is, because the SAR plotted in the log#log space is triphasic and of sigmoid form (Rosenzweig 1995). Its inclination is scale#dependent: On local spatial scales, the species#area relationship is curvilinear on a log#log plot and follows logarithmic patterns – for that Fisher´s equation does well for extrapolations on local scale as shown by Condit et al.(2004). On regional scales, theory predicts linear species#area curves plotted in the logarithmic space. Rosenzweig (1995) and others propose slopes of about 0.15 for plants from islands and 0.25 for terrestrial plants (Pimm and Raven 2000). Finally, on very large scales exceeding biogeographic units, slopes of SARs steepen toward unity, because processes become uncoupled (Hubbell 2001).
48
regional scale, our SARs change from the logarithmic to the power model. Consequently, both power as well as logarithmic fittings deduced from surveys are fractals only.
All we need for our extrapolation is a model describing the left half of the sigmoid form of the SAR plotted in log#log space. Such an approximation on decreasing slopes of linearized species#area relationship was proposed by Krishnamani et al. (2004). Compared to the findings by the taxon ratio model, this model computes lower values for park´s species richness. This is due to the underlying conservative calculation, where the scale break is defined as sample size. Increasing the scale break of both surveys increases species richness (Table 2). Additionally, intermediate surveys might be helpful to introduce a second scale break substantiating the results.
Table 2
Influence of increasing scale break on Itacolomi´s species richness.
Scale break [ha]
Species richness
0.15 798
0.5 1048
0.7 1131
1 1226
2 1435
5 1766
49
Confidence is given to our estimations, because three different models independently produce similar results. Furthermore, the magnitude of 1100 species for all within the Itacolomi State Park seems to be realistic, as censuses of many species#rich and abundant families like Poaceae, Cyperaceae, Velloziaceae and Rubiaceae are still lacking. Surely, there are many first records for the Itacolomi State Park and undescribed species waiting for research activities. In her taxonomical work, Almeida (2008), for example, succeeded innumerable first records for the Itacolomi State Park and furthermore discovered three new, not yet described species from one family only!
The three approaches have worked as tools to evaluate plant species richness in . Realistic results in the same magnitude proof the consistency of the three approaches and inspire further extrapolations as well as applications in other nature reserves or even ecosystems. Its application in further research activities from different vegetation forms is potentially wide, because required information, if not available from literature, is easily gathered.
In Minas Gerais 617,324 ha of are registered (Scolforo and Carvalho, 2006), but as mappings are lacking for other Brazilian States like Bahia, Goias and Federal District, we estimate the total amount of
to the double of that from Minas Gerais. By inserting this value in our SAR, we expect around 4866 species in 1,200,000 ha (Figure 1). By the Krishnamani et al (2004) model, the ´ total species richness is estimated to 3752 or 4390 assuming a scale break of 0.5 and 1 ha, respectively.
50
is 7.2 times (Caesalpinioideae), 5.6 times (Papillionioideae) more species than have been found in the Itacolomi State Park!
The three models concordantly estimate the richness of all to something between 4000 and 5000 species. But is this realistic? Giulietti et al. (1997) guess that there might be found about 4000 plant species within the Espinhaço Mountain Range, an area of about 70,000 km2 housing most of Brazilian . Because one third of that species has already been found in the Serra do Cipó, a conservation unit covering only 300 km2, their estimation is considered moderate (Rapini et al. 2008).
On the other hand, Stehmann et al. (2009) compile a – still incomplete – list of 14,000 plant species that occur in the Atlantic Rainforest biome. From that, 3,740 species occur in rocky formations. Considering that some area of is inserted in the Cerrado biome and that there are waiting still many species from this vegetation type to be described, this data supports our findings.
Figure 1
51
indicate already protected area (continuous), area to be protected to conserve 70 to 74 % (dashed) and 90 % (dotted) of species richness from
vegetation.
This has consequences for conservation activities: Within the 3319 ha from the Itacolomi State nearly one third of all vascular plants from
are protected from anthropogenic impacts. This exceptional high species richness underlines the importance of the park, justifies conservation activities and it´s declaration as (local) hotspot of biodiversity.
But as the fulfillment and maintenance of ecosystem services depends each species (Isbell et al. 2011), we should protect as much species as possible. Protecting 25% or 300,000 ha of all , would conserve about 70 (SAR) to 74 % (Krishnamani model) of all species richness (Figure 1). If more than 90 % of all plants from
should be conserved, more than a half of all should be protected.
But this is far from reality: In 2005, between 4 to 5% of the whole Brazilian territory has been protected in integral conservation units (Rylands and Brandon 2005). From the Espinhaço Mountain Range, about 3500 km2 from a total of 70,000 km2 are protected in federal or state conservation units # that is only five percent. With other words, only the half of all species potentially occurring in vegetation is protected.
Therefore, we should enlarge immediately the area of protected
to some 10 to 15 %. This would guarantee that relicts of this highly diverse, species#rich and endemic flora are conserved for further generations.
Conclusions
The species richness of the Itacolomi State Park´s cannot