Synergistic Control of Kinetochore Protein
Levels by Psh1 and Ubr2
Eva Herrero, Peter H. Thorpe*
The Francis Crick Institute, Mill Hill Laboratory, London, United Kingdom
Abstract
The accurate segregation of chromosomes during cell division is achieved by attachment of chromosomes to the mitotic spindle via the kinetochore, a large multi-protein complex that assembles on centromeres. The budding yeast kinetochore comprises more than 60 differ-ent proteins. Although the structure and function of many of these proteins has been investi-gated, we have little understanding of the steady state regulation of kinetochores. The primary model of kinetochore homeostasis suggests that kinetochores assemble hierar-chically from the centromeric DNA via the inclusion of a centromere-specific histone into chromatin. We tested this model by trying to perturb kinetochore protein levels by overex-pressing an outer kinetochore gene,MTW1. This increase in protein failed to change protein recruitment, consistent with the hierarchical assembly model. However, we find that deletion of Psh1, a key ubiquitin ligase that is known to restrict inner kinetochore protein loading, does not increase levels of outer kinetochore proteins, thus breaking the normal kineto-chore stoichiometry. This perturbation leads to chromosome segregation defects, which can be partially suppressed by mutation of Ubr2, a second ubiquitin ligase that normally restricts protein levels at the outer kinetochore. Together these data show that Psh1 and Ubr2 synergistically control the amount of proteins at the kinetochore.
Author Summary
As cells divide, their replicated chromosomes must be correctly allocated to the two nascent daughter cells. This is achieved by the kinetochore, which provides a physical link between the chromosomes and the microtubules that drive their movement. If chromo-some separation fails, the resulting cells have an abnormal number of chromochromo-somes. This state is called aneuploidy and is a hallmark of cancer cells. The regulation of the kineto-chore is therefore of critical importance in maintaining genome integrity. Since a number of cancer cells have over-active kinetochore genes, it has been proposed that an excess of kinetochore proteins can disrupt the normal assembly or maintenance of kinetochores. We tested this idea in yeast by increasing the amount of a specific kinetochore protein, but found no effect upon the normal loading of kinetochore proteins. Instead, we find that two ubiquitin ligases play a role in maintaining the normal balance of the different kinetochore proteins and that this correlates with correct segregation of the chromosomes.
OPEN ACCESS
Citation:Herrero E, Thorpe PH (2016) Synergistic Control of Kinetochore Protein Levels by Psh1 and Ubr2. PLoS Genet 12(2): e1005855. doi:10.1371/ journal.pgen.1005855
Editor:Kerry Bloom, University of North Carolina, UNITED STATES
Received:July 31, 2015
Accepted:January 19, 2016
Published:February 18, 2016
Copyright:© 2016 Herrero, Thorpe. This is an open access article distributed under the terms of the Creative Commons Attribution License, which permits unrestricted use, distribution, and reproduction in any medium, provided the original author and source are credited.
Data Availability Statement:All relevant data are within the paper and its Supporting Information files.
Introduction
Accurate chromosome segregation is necessary for the equal distribution of genetic material between daughter cells during cell division and is achieved by kinetochores which link chromo-somes to spindle microtubules [1]. Perturbations of kinetochore function result in aneuploidy, i.e. changes in chromosome number, and genome instability [2,3]. Thus kinetochore regula-tion is of critical importance in replicating cells. A number of different cancers overexpress kinetochore genes [4,5] leading to the notion that disrupting kinetochore stoichiometry and regulation may be a driver of aneuploidy and genomic instability.
Budding yeast is a key model to study kinetochore composition and assembly because of its comparatively simple structure; there is only one microtubule attachment per chromosome and per kinetochore [6,7]. Kinetochores are composed of more than 60 proteins organized into various sub-complexes that are thought to assemble hierarchically initiating at the centro-meres [1]. The inner part of the kinetochore mediates centromere binding whereas the outer part mediates microtubule binding. Kinetochore structure and composition is remarkably well conserved from yeast to humans [8].
In budding yeast the position of the centromeres is sequence specific. Cbf1 and the CBF3 complex associate to centromere DNA elements (CDE), CDEI and CDEIII, respectively [9– 13]. The CDEII region wraps around the centromeric nucleosome that contains the centro-meric histone H3 variant CENP-A (Cse4 in budding yeast) [14–17]. Mif2 (CENP-C) and the COMA complex mediate the association between centromere and outer kinetochore. Mif2 binds to both the Cse4 nucleosome and the outer kinetochore MIND complex [18–20]. The COMA complex proteins Okp1 and Ame1 form a dimer that binds directly to DNA and the MIND complex [20,21].
The outer kinetochore mediates interactions with microtubules emanating from opposite spindle pole bodies. The yeast homologues of the KNL1/ MIS12/ NDC80 network (KNM) are the essential complexes SPC105, MIND and NDC80, respectively [1]. The MIND complex is composed of two heterodimers: Mtw1-Nnf1, which associates with both Mif2 and the COMA complex, and Dsn1-Nsl1, which associates with the NDC80 complex [21,22]. Both the NDC80 complex and the yeast-specific DAM-DASH complex, which may play an orthologous func-tion to the human SKA proteins [23], bind to microtubules in a cooperative process [24,25].
Although the centromeric DNA sequence (CEN) is essential to assemble kinetochores, pro-tein degradation has been shown to be important to control cellular levels of various kineto-chore proteins. The E3 ubiquitin ligase Psh1 restricts the localization of Cse4 to centromeres [26]. Psh1 localizes to centromeres throughout the cell cycle, and its destabilizing role is opposed by the Cse4 chaperone Scm3 [27,28]. Levels of Cse4 are increased inpsh1Δcells [26]
and these cells have a chromosomal instability phenotype [29]. More recently, the E3 ubiquitin ligase Ubr2 has been shown to control levels of the MIND complex protein Dsn1 [30]. Thus kinetochore assembly may be regulated differently from steady state homeostasis. Surprisingly, yeast kinetochores can assemble in reverse from the microtubule interface back to the inner kinetochore as shown via artificial recruitment of proteins to DNA [31]. In this situation, the conserved yeast centromere is not necessary, although inner kinetochore proteins are required [32]. These data point to a kinetochore with more flexibility in its assembly and stoichiometry than was previously assumed.
Numerous studies in budding yeast have revealed the stoichiometry of the various protein sub-complexes forming the kinetochore [20,21,33–37]. It is thought that the kinetochore assembles hierarchically from the centromere [37]. However, little is known about how these sub-complexes assemble to form the kinetochorein vivoand how much flexibility exists in and analysis, decision to publish, or preparation of
the manuscript.
kinetochore composition. To investigate this, we tested how increased levels of kinetochore proteins affect kinetochore composition. We used fluorescence microscopy to quantify the lev-els of proteins at kinetochore foci. We found that Mtw1 levlev-els at the kinetochore correlate with chromosome number and they are not transcriptionally controlled. Moreover, we found that
psh1Δmutants, in addition to the elevated Cse4 protein, have increased levels of inner
kineto-chore proteins but not outer kinetokineto-chore proteins. However, the levels of outer kinetokineto-chore proteins are increased in thepsh1Δubr2Δdouble mutant, in which both Cse4 and Dsn1 are
unconstrained. Finally, we found thatubr2Δsuppressespsh1Δmitotic and meiotic defects.
These findings are consistent with multiple regulatory pathways acting independently on the different kinetochore complexes.
Results
Loading of Mtw1 onto kinetochores is not restricted by its gene
expression
To investigate whether we could perturb kinetochore homeostasis by overexpression of kineto-chore genes, we chose to studyMTW1. Mtw1 forms part of the essential MIND complex [21,
38] and the levels of one of these proteins, Dsn1, is controlled via phosphorylation status and subsequent ubiquitylation by the E3 ligase, Ubr2 [30]. We used an ectopically-expressed plas-mid-encoded version of Mtw1 to elevate the levels of Mtw1 within the cell and assessed the recruitment of Mtw1 to kinetochores by fluorescence imaging. The plasmid is a single copy
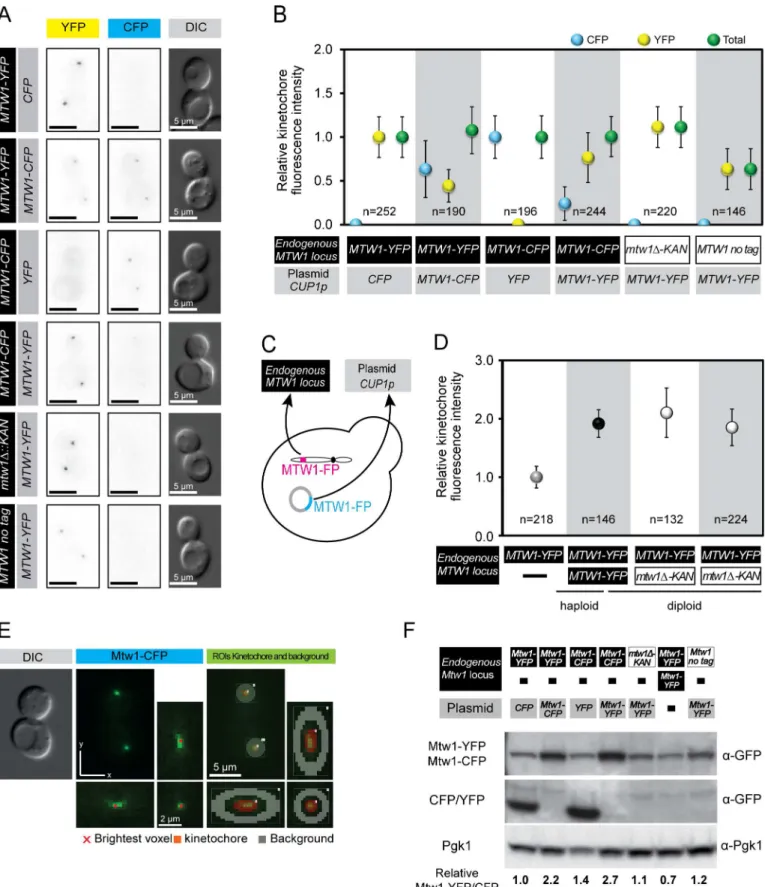
CENplasmid and itsMTW1gene is driven by a constitutively-active copper promoter (CUP1) [39]. We used differential fluorescence tagging of endogenously-encoded and plasmid-encoded Mtw1 to differentiate between and quantitate the proteins loaded into kinetochores (Fig 1A, 1B and 1C). TheMTW1plasmid produced significant ectopic expression as judged by loading of plasmid-encoded Mtw1 at the kinetochore (Fig 1A). We quantified the levels of fluorescence at kinetochores using Volocity image analysis software. In brief, the mean fluorescence within a 3-dimensional spherical region around each kinetochore was assessed and a background region around each kinetochore was also measured by dilating each kinetochore selection (Fig 1E). Each background measurement was subtracted from each kinetochore measurement to pro-duce a relative value representing the levels of fluorescence signal from the kinetochore. When we expressed an ectopicMTW1-CFPgene in cells containingMTW1-YFPat the endogenous locus, we found that the resulting fluorescence at kinetochores was approximately 50% of the haploid CFP signal and 50% of the haploid YFP signal (Fig 1B). This is consistent with an approximately equal contribution of the two proteins to the kinetochore, but not consistent with an elevation of Mtw1 loading at the kinetochore. To determine whether one fluorescent tag is preferred over the other, we then performed the same analysis but with the tags reversed i.e. ectopicMTW1-YFPand endogenousMTW1-CFP. In this case the levels of the plasmid encoded Mtw1-YFP at the kinetochore are somewhat higher than the CFP signal, although both still contribute to the kinetochore signal (Fig 1B). Again, no increase in total kinetochore fluorescence was measured. We also examined the effect of deleting the endogenousMTW1
Thus, these quantitative data support the notion that the fluorescently tagged proteins compete for inclusion into the kinetochore and that the total levels of kinetochore Mtw1 remain con-stant. There are two likely reasons for this homeostasis of Mtw1 at the kinetochore. First, an uncharacterised negative feedback mechanism could limit transcription, translation or protein stability of the endogenous Mtw1, thus maintaining a steady state level of Mtw1 protein within the cell. Second, the loading of Mtw1 onto the kinetochores is limiting, such that there is a strong affinity to load Mtw1 as part of the MIND complex but once the protein reaches a threshold level (perhaps through stoichiometric interaction with other kinetochore compo-nents), no more Mtw1 is loaded. To discriminate between these two ideas we used western blotting to assess the total cellular levels of Mtw1. We find that the ectopic expression of
MTW1causes an increase in the levels of Mtw1 protein in the cell (Fig 1F). Thus, we exclude the possibility that total Mtw1 protein levels are tightly regulated by translation or protein stability.
Our results are also consistent with the notion of hierarchical assembly of the kinetochore building up from inner kinetochore components such as Cse4. To test this notion we compared the loading of Mtw1 in diploid strains withMTW1-YFPat either one or two of the endogenous
MTW1alleles. We find that diploid kinetochore Mtw1 levels are approximately double that of haploids and heterozygousmtw1Δ/MTW1-YFPstrains compensate by loading equivalent
Mtw1 as diploid strains (Fig 1D). We note here that these heterozygousmtw1Δ/MTW1-YFP
strains are haplo-sufficient in that they do not show sensitivity to microtubule poison drug benomyl (S2B Fig). We also confirmed that overexpression ofMTW1does not render cells sen-sitive to benomyl (S2C Fig), nor does it affect cell cycle progression (S3A Fig), plasmid loss (S3B Fig), or chromosome segregation (S3C and S3D Fig). We also checked whetherMTW1
overexpression resulted in changes to the levels of other kinetochore proteins and consistent with the levels of Mtw1, we find no change in Dsn1 or Ndc80 (S3E and S3F Fig). In order to test more generally the effects of high levels of kinetochore proteins, we expressed various inner and outer kinetochore proteins from aCENplasmid under the control of aCUP1 pro-moter. OnlyNDC10overexpression showed a reduced growth in the presence of benomyl (S4 Fig) We then tested whether Mtw1 kinetochore levels were affected by the deletion of genes encoding several inner kinetochore components: the DNA-binding protein Cbf1, the Monopo-lin complex components Mam1 and Csm1, and the COMA complex component Ctf19. We found no change in Mtw1 levels in any of these mutants (S5A and S5B Fig), consistent with Mtw1 loading hierarchically based upon the number of centromeres present in the cell.
Elevated Cse4 levels increase loading of inner kinetochore proteins
The hierarchical loading model is consistent with the hypothesis that the loading of inner kinetochore proteins is critical for determining kinetochore stoichiometry as a whole. To test this idea we decided to attempt to manipulate the levels of an inner kinetochore protein to test whether the MIND complex is regulated in parallel.
The levels of the inner kinetochore protein Cse4 are controlled in part by degradation via an ubiquitylation-dependent degradation pathway. Psh1 was identified as the E3 ubiquitin ligase responsible for restricting Cse4 levels at the kinetochore [26,27]. In apsh1Δstrain Cse4 levels
was deleted (mtw1Δ). Ectopic Mtw1-YFP or Mtw1-CFP was expressed from a CEN plasmid under the control of theCUP1promoter (no copper was added to the media). (D) Mtw1 levels at the kinetochore correspond with chromosome number. Levels of Mtw1 at kinetochore foci are plotted relative to mean intensity in haploid Mtw1-YFP cells. Error bars indicate standard deviation of the mean. (E) Strategy used for automatic identification of kinetochore and background regions and quantification of fluorescence at kinetochore foci using Volocity software. The region of interest (ROI) quantified for the kinetochore is highlighted in red and the background ROI highlighted in grey. (F) Total Mtw1 protein increases by ectopic expression ofMTW1. Western blot of total cell extracts. Quantification of cellular levels of Mtw1-YFP/-CFP relative to Pgk1 is shown below. An extended blot is shown inS2A Fig.
are elevated and furthermore overexpression of theCSE4is lethal inpsh1Δcells, consistent
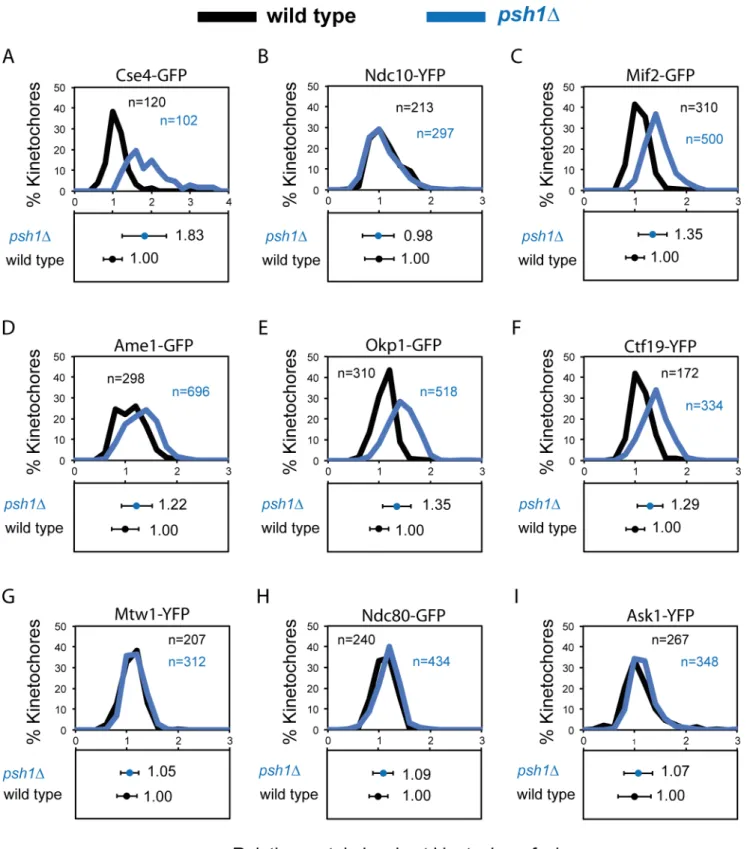
with a failure to constrain Cse4 loading [26,27]. We used the same fluorescence quantitation method described above to compare endogenous kinetochore protein levels of wild-type cells with those ofpsh1Δcells. Consistent with previous studies we find thatpsh1Δcells have
ele-vated levels of Cse4 at kinetochore foci, although with considerable heterogeneity between cells (Fig 2A). We found no change in the protein levels of the inner kinetochore protein Ndc10 (Fig 2B). In addition, we find that Mif2, the ortholog of human CENP-C, (Fig 2C) and mem-bers of the Ctf19/COMA complex are also elevated in thepsh1Δ(Fig 2D, 2E and 2F). However,
contrary to our expectation Mtw1 kinetochore levels are unchanged in apsh1Δstrain
com-pared with wild type (Fig 2G). We therefore examined whether other outer-kinetochore com-plexes are affected by deletion ofPSH1. Like Mtw1, the kinetochore levels of Ndc80 and Ask1 (a member of the decameric DAM1/DASH complex) are both unaffected inpsh1Δcells (Fig 2H and 2I). These data show that although Cse4 levels may influence the inner kinetochore, the protein levels of the entire kinetochore are not affected. This result shows that for the fluo-rescence focus that is widely considered to represent the structural kinetochore the stoichiome-try is not fixed.
One possible reason for the non-stoichiometric increase in kinetochore protein levels in
psh1Δcells is that the increased Cse4, Ctf19 etc. are not part of the canonical kinetochore
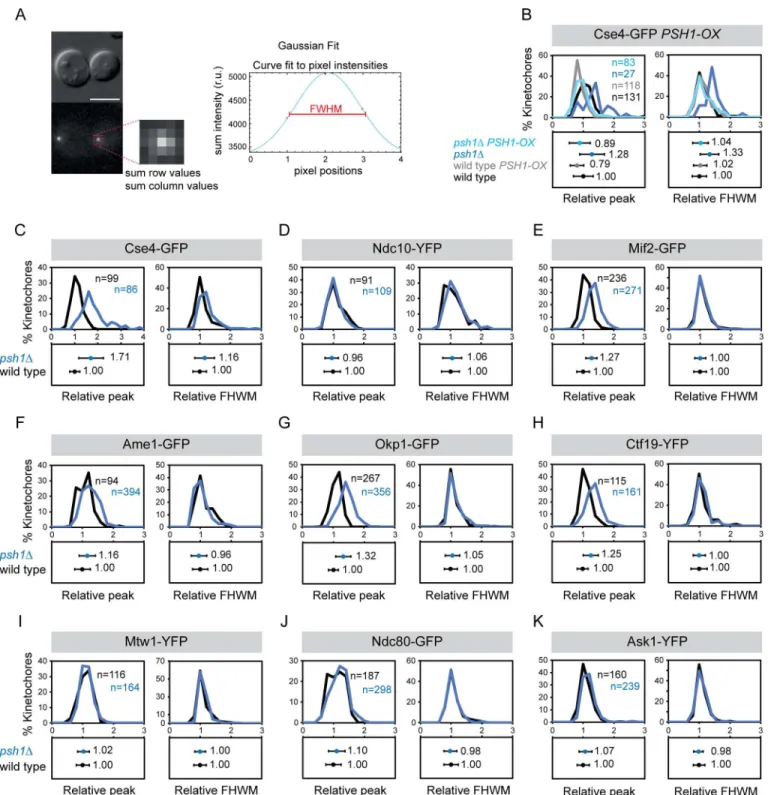
struc-ture, but rather represent a pericentromeric‘cloud’of protein. There is precedent for this from fluorescence studies of Cse4 [40,41]. We therefore re-analysed our images to evaluate the size each of the fluorescence foci. The rationale is that pericentric protein recruitment will result in a larger area of fluorescence, which can be measured by fitting a Gaussian distribution to the kinetochore foci (Fig 3A). We find thatpsh1ΔCse4 foci are considerably larger than WT,
con-sistent with the notion of a cloud of pericentric Cse4 and this is rescued by overexpressing
PSH1(Fig 3B and 3C). However, the other kinetochore proteins hadpsh1Δfoci comparable in
size to WT cells (Fig 3C–3K). We cannot say for sure that protein that is located in a compara-bly-sized focus is part of a structural complex, it is possible that for certain proteins the kineto-chore can accommodate additional proteins within the confines of the WT diffraction limited region.
Psh1 and Ubr2 work together to control kinetochore proteins levels
We next asked whether the effect of Psh1 upon kinetochore protein levels would function in synergy with the Mub1/Ubr2 ubiquitylation pathway. The MIND complex member Dsn1 is ubiquitylated by the E3 ubiquitin ligase Ubr2 [30]. Dsn1 contains two AuroraB (Ipl1) phos-phorylation sites (serines 240 and 250) and versions of Dsn1 that cannot be phosphorylated at these residues are ubiquitylated and degraded [30,42]. Such a mechanism may restrict the lev-els of MIND proteins even in the presence of excess inner kinetochore proteins. Sincepsh1Δ,
ubr2Δand the double mutant cells are all viable we were able to assess their relative
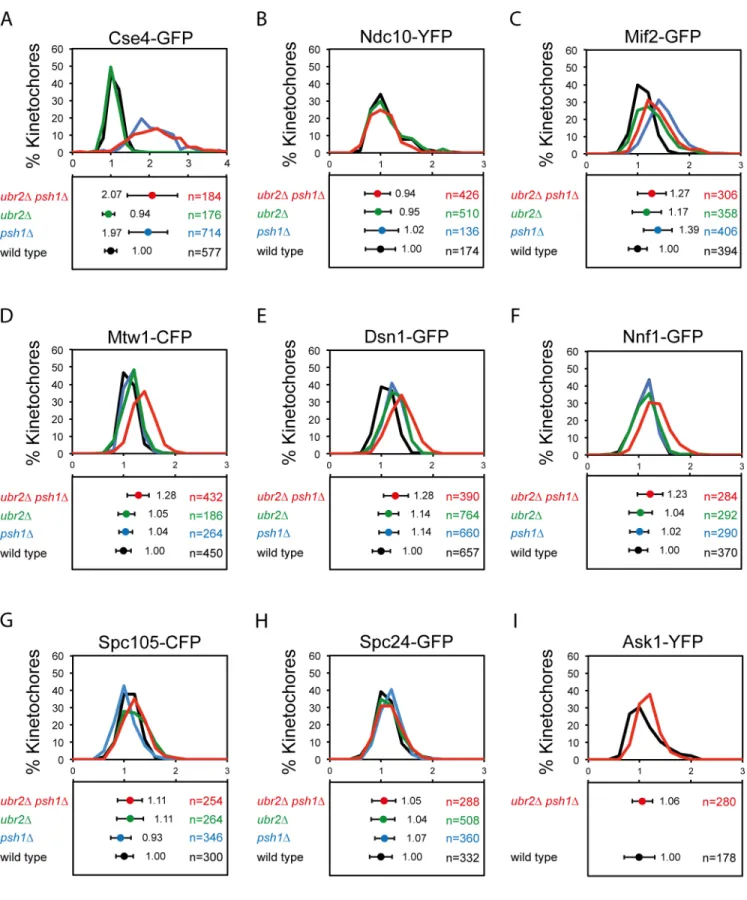
contribu-tion to the kinetochore focus fluorescence levels. We find thatUBR2deletion has no effect upon inner kinetochore protein levels of Cse4 or Ndc10. Cse4 levels are elevated byPSH1 dele-tion, but not further affected by the additional deletion ofUBR2(Fig 4A). Also addition of
ubr2Δmutation did not further increase the size of Cse4-GFP foci (S6A Fig). Ndc10 is
unaf-fected by either of these mutants (Fig 4B). Mif2 is elevated in apsh1Δmutant, but unaffected
by further deletion ofUBR2(Fig 4C). The MIND complex shows little change in either of the single mutants but both Mtw1 and Dsn1 are modestly elevated in the doublepsh1Δubr2Δ
strain (Fig 4D and 4E). The size of Mif2 and Dsn1 foci was unaffected in theubr2Δand in the
doublepsh1Δubr2Δcells (S6B and S6C Fig). Another MIND complex protein Nnf1 is also
Fig 2. Increased levels of Cse4 does not affect all kinetochore protein complexes.Quantitation of protein levels at kinetochore foci in wild type (black) andpsh1Δ(blue) cells. Fluorescence intensity levels are normalised relative to wild-type mean intensity±standard deviation. Top panels and bottom panels display the distribution of intensities and the mean intensity±standard deviation, respectively. (A) Cse4-GFP wild type 1.00±0.25,psh1Δ1.83±0.57***. (B) Ndc10-YFP wild type 1.00±0.29,psh1Δ0.98±0.31. (C) Mif2-GFP wild type 1.00±0.18,psh1Δ1.35±0.25***. (D) Ame1-GFP wild type 1.00±0.26,psh1Δ1.22
±0.30***. (E) Okp1-GFP wild type 1.00±0.18,psh1Δ1.35±0.28***. (F) Ctf19-YFP wild type 1.00±0.18,psh1Δ1.29±0.25***. (G) Mtw1-YFP wild type 1.00
±0.19,psh1Δ1.05±0.18. (H) Ndc80-GFP wild type 1.00±0.19,psh1Δ1.07±0.22. (I) Ask1-YFP wild type 1.00±0.32,psh1Δ1.07±0.28.***p-value<0.0001 is attest comparing relative intensity levels of wild-type andpsh1Δcells.
Fig 3. Changes in the size of kinetochore foci inpsh1Δmutant.(A) Strategy to fit Gaussian distribution to kinetochore foci. (B-K) Quantitation of size of kinetochore foci in wild type (black) andpsh1Δ(blue) cells. The images used forFig 2quantitation were re-analysed to calculate peak height and FHWM shown in panels C-K. Fluorescence peak height values and full width at half maximum (FHWM) values are normalised relative to wild-type mean
intensity±standard deviation. Top panels and bottom panels display the distribution of intensities and the mean intensity±standard deviation, respectively. (B) Cse4-GFP PSH1-OX. Peak height: wild type 1.00±0.32, wild typePSH1-OX0.79±0.22,psh1Δ1.28±0.41, psh1ΔPSH1-OX0.89±0.34. FWHM: wild type 1.00±0.23, wild typePSH1-OX1.02±0.22,psh1Δ1.33±0.30, psh1ΔPSH1-OX1.04±0.26. (C) Cse4-GFP. Peak height: wild type 1.00±0.22,psh1Δ1.71
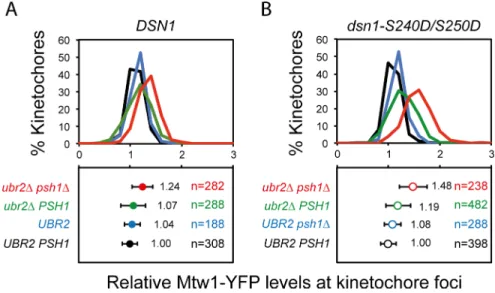
NDC80 complex, and Ask1 were unaffected by either of these mutants (Fig 4G, 4H and 4I). The degradation of Dsn1 is controlled by phosphorylation/ dephosphorylation of serines 240 and 250. The doubledsn1-S240A,S250Amutant is inviable, but can be rescued by either its overexpression or by deletingUBR2[30]. We reasoned that if increased Dsn1 was responsible for the MIND phenotype, this should be epistatic with adsn1-S240D,S250Dmutant, which would be hyper-stable. However, we find that the elevated levels of Mtw1 in apsh1Δubr2Δ
mutant are increased further when the two Dsn1 serines are changed to aspartic acid (Fig 5A and 5B). Furthermore, we examined cellular levels of both Mtw1 and Dsn1 inpsh1Δ,ubr2Δ
and thepsh1Δubr2Δmutants and find that these are comparable with wild-type cells (S6D and S6E Fig) These data suggest that Ubr2 plays additional, potentially indirect, roles in regulating the levels of kinetochore components in addition to its function on dephosphorylated Dsn1 or that there are other mechanisms to remove dephosphorylated Dsn1 from kinetochores. These data also strengthen our observation that the stoichiometry of the various kinetochore sub-complexes is not fixed in these mutants.
ubr2
Δ
supresses
psh1
Δ
chromosome instability phenotypes
Although these ubiquitin ligase mutants affect kinetochore protein levels, they are all viable and the cells appear to grow normally [26,30]. Since there is considerable interest in the possi-bility that altered kinetochore protein levels would lead to kinetochore dysfunction and the resulting aneuploidy [4,5,43], we asked whether thepsh1Δandubr2Δmutants affected the
mitotic or meiotic phenotype of yeast. We did not find strong defects in cell cycle progression, although S-phase was slightly faster inubr2Δandpsh1Δubr2Δmutants (S7 Fig). It has
previ-ously been reported thatubr2Δmutants have an enhanced sporulation phenotype [44].
Consis-tent with this we found that the sporulation of homozygousubr2Δmutants is enhanced
compared with wild-type diploids (Fig 6A). Addition of thepsh1Δmutant did not modify this
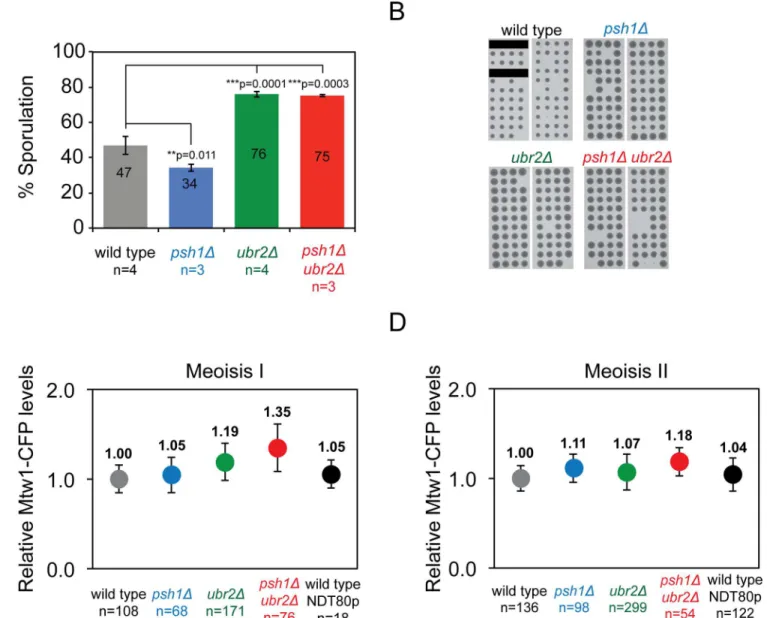
phenotype. In all cases spore viability was similar (Fig 6B). We tested whether the increase in Mtw1 kinetochore levels inpsh1Δubr2Δmitotic cells (Fig 3D) was recapitulated in meiosis.
Diploid cells were induced to sporulate and arrested in pachytene, prior to the two meiotic divisions by depletion of the Ndt80 transcription factor. Then, meiosis I was triggered by induction ofNDT80expression from the GAL1-10 promoter [45] (seeMaterials and Methods
for details). We found elevated Mtw1 kinetochore levels inpsh1Δubr2Δin meiosis I, and to a
lesser extent in meiosis II (Fig 6C and 6D).
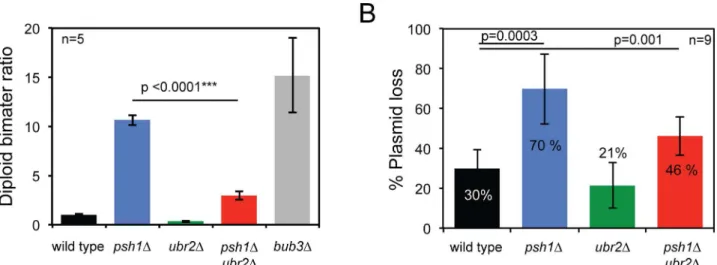
As Psh1 is known to have a role in maintaining chromosome stability [29], we used an assay for homozygosity of chromosome III [2,3,29] to analyse the rate of chromosomal instability (CIN) in diploids cells, and we also tested the rate of loss of a CEN plasmid. Consistent with previous reports, we find thatpsh1Δcells show elevated rates of both chromosome III loss (Fig 7A) andCENplasmid loss (Fig 7B), whereasubr2Δcells are unaffected. Surprisingly, we found
that the addition ofubr2Δto apsh1Δmutant leads to a reduction of these CIN phenotypes (Fig 7A and 7B). To investigate the effect of the ubiquitin ligases Psh1 and Ubr2 on checkpoint function, we assessed the synthetic effects of combining mutations in these genes with those of checkpoint genes. We deleted theMAD1gene, which encodes a protein required for the activa-tion of Mad2 [46] and alsoMAD3, which encodes a key member of the mitotic checkpoint complex [47]. These mutants were combined withpsh1Δ,ubr2Δor the double mutant. The
resulting strains were all viable (Fig 8), so to test their checkpoint proficiency we grew them in FHWM: wild type 1.00±0.26,psh1Δ0.96±0.2. (I) Mtw1-YFP. Peak height: wild type 1.00±0.21,psh1Δ1.02±0.19. FHWM: wild type 1.00±0.20,psh1Δ1.00
±0.18. (J) Ndc80-GFP. Peak height: wild type 1.00±0.25,psh1Δ1.10±0.27. FHWM: wild type 1.00±0.23,psh1Δ0.98±0.21. (K) Ask1-YFP. Peak height: wild
type 1.00±0.2,psh1Δ1.07±0.22. FHWM: wild type 1.00±0.19,psh1Δ0.98±0.15.
the microtubule poison benomyl. We found that deletion ofpsh1Δdecreases the ability of both
mad1Δandmad3Δto grow in the presences of benomyl (Fig 8). Moreover, deletion ofubr2Δ
partially rescued the ability ofmad1Δandmad3Δto grow on benomyl. Finally, we also found
thatubr2Δpartially rescues the benomyl sensitivity ofmad1Δpsh1Δandmad3Δpsh1Δdouble
mutants (Fig 8). We then tested if increased Dsn1 levels could explain the rescue ofubr2Δ.
However, we found thatDSN1over-expression from aCUP1promoter did not rescue benomyl sensitivity (S8 Fig)
Discussion
A number of studies have shown correlation between the overexpression of kinetochore genes and tumorigenic status [4,5,43]. These observations raise the possibility that increased levels of kinetochore proteins result in aberrant kinetochore function, which then leads to chromo-somal instability. We wished to test the idea that overexpression of kinetochore genes would affect kinetochore protein loading. We overexpressed the kinetochore gene,MTW1that encodes a core member of the outer kinetochore MIND complex. The MIND complex plays an essential role in linking the inner kinetochore and the outer kinetochore [48,49]. Using panels display the distribution of intensities and the mean intensity±standard deviation, respectively. (A) Cse4-GFP wild type 1.00±0.16,psh1Δ1.97
±0.50***,ubr2Δ0.94±0.16,psh1Δubr2Δ2.07±0.66***. (B) Ndc10-YFP wild type 1.00±0.29,psh1Δ1.02±0.25,ubr2Δ0.95±0.33,psh1Δubr2Δ0.94±0.25.
(C) Mif2-GFP wild type 1.00±0.18,psh1Δ1.39±0.28***,ubr2Δ1.17±0.29,psh1Δubr2Δ1.27±0.28***. (D) Mtw1-CFP wild type 1.00±0.14,psh1Δ1.04
±0.13,ubr2Δ1.05±0.16,psh1Δubr2Δ1.28±0.21***. (E) Dsn1-GFP wild type 1.00±0.18,psh1Δ1.14±0.19,ubr2Δ1.14±0.20,psh1Δubr2Δ1.28±0.24***. (F) Nnf1-GFP wild type 1.00±0.18,psh1Δ1.02±0.18,ubr2Δ1.04±0.23,psh1Δubr2Δ1.23±0.25***.(G) Spc105-GFP wild type 1.00±0.17,psh1Δ0.93±0.20,
ubr2Δ1.11±0.26,psh1Δubr2Δ1.11±0.24. (H) Spc24-GFP wild type 1.00±0.21,psh1Δ1.07±0.19,ubr2Δ1.04±0.23,psh1Δubr2Δ1.05±0.23. (I) Ask1-YFP
wild type 1.00±0.3,psh1Δubr2Δ1.06±0.20.***p-value<0.0001 is attest comparing relative mean intensity of wild type and mutant.
doi:10.1371/journal.pgen.1005855.g004
Fig 5.ubr2Δanddsn1-S240D/S250Dphospho-mimic mutants do not function epistatically.Quantitation of Mtw1-YFP levels at kinetochore foci in wild type (black),psh1Δ(blue),ubr2Δ(green) andpsh1Δubr2Δ(red): Fluorescence intensity levels are normalised relative to wild-type mean intensity. Top panels and bottom panels display the distribution of intensities and the mean intensity±standard deviation, respectively. (A) Strains contain wild typeDSN1:PSH1 UBR21.00±0.14,psh1ΔUBR21.04±0.18,PSH1 ubr2Δ1.07±0.24,psh1Δ ubr2Δ1.24±0.2***. (B) Strains contain thedsn1-S240D/S250Dallele:PSH1 UBR21.00±0.15,psh1ΔUBR2 1.08±0.16,PSH1 ubr2Δ1.19±0.24,psh1Δubr2Δ1.48±0.27***.***p-value<0.0001 is attest, comparing the levels of Mtw1-YFP inPSH1 UBR2cells withpsh1Δubr2Δdouble mutant cells (both for wild-typeDSN1and for thedsn1-S240D/S250Dstrain). Forpsh1Δubr2Δcells thedsn1-S240D/S250Dmutant had higher levels of Mtw1-YFP than the DSN1 (1.24±0.2vs. 1.48±0.27p-value<0.0001).
quantitative fluorescence imaging we find that although overexpression ofMTW1does lead to increased Mtw1 protein in the cell, the loading of Mtw1 onto the kinetochores is unaffected (Fig 1). Our data supports the idea that kinetochores are assembled hierarchically from the inner kinetochore, likely directed by Cse4 inclusion into centromeric nucleosomes [37]. Simi-larly, Aravamudhan and colleagues found that the levels of Cse4 at the kinetochore did not change after increasing total Cse4 cellular levels in budding yeast [50]. The effects of kineto-chore gene overexpression may be subtle and/or different in mammalian cells, however, our data do not support the idea that kinetochore gene overexpression would,a priori, lead to a
Fig 6. Meiotic phenotypes ofpsh1Δandubr2Δubiquitin ligase mutants.(A) The percentage of cells that sporulated after three days in sporulation media at 23°C. Error bars indicate standard deviation of the mean.p-values in the graph correspond tottest comparing mean % sporulation. Wild type 47%±5.27, psh1Δ34%±2.02,ubr2Δ76%±1.65, andpsh1Δubr2Δ75%±0.77. (B) Spore germination of tetrads dissected from wild-type and mutant diploid strains show equivalent spore viability. Black bars indicate that no tetrad was placed in the line. Wild type (73/80),psh1Δ(84/88),ubr2Δ(85/88), andpsh1Δubr2Δ(79/88). (C-D), Quantitation of Mtw1-CFP levels at kinetochore foci in Meiosis I (C) and Meiosis II (D). Fluorescence intensity levels are plotted relative to wild-type mean intensity and error bars indicate standard deviation of the mean. Meiosis I: wild type 1±0.15,psh1Δ1.05±0.20,ubr2Δ1.19±0.21,psh1Δubr2Δ1.35
±0.26***. Meiosis II: wild type 1±0.14,psh1Δ1.11±0.16,ubr2Δ1.07±0.2,psh1Δubr2Δ1.18±0.16***.***p-value<0.0001 is attest comparing relative mean intensity of wild-type andpsh1Δubr2Δmutant cells.
kinetochore defect (Figs1,S2–S4). On the contrary, our data also support the idea that the kinetochore focus represents the structural assembly of kinetochore proteins loaded onto cen-tromeres [37,51] and that kinetochore protein levels scale with centromere number (Fig 1)
Fig 7.ubr2Δsupressespsh1Δchromosome instability phenotype.(A) Diploid- bi-mater ratio. Median bimater ratio was calculated from 5 independent colonies from each genotype. Median bimater ratio±standard error of the mean: wild type 1±0.07,psh1Δ10.7±0.54,ubr2Δ0.4±0.09,psh1Δubr2Δ3±0.41
andbub3Δ15.2±3.8.p-values in the graph correspond tottest comparing bimater ratios. (B) CEN plasmid loss assay. Median percentage of plasmid loss was calculated from 9 independent colonies from each genotype. Median plasmid loss±standard deviation: wild type 30±9,psh1Δ70±17,ubr2Δ21±11, psh1Δubr2Δ46±.p-values in the graph correspond to t-test comparing plasmid loss percentages.
doi:10.1371/journal.pgen.1005855.g007
Fig 8. Genetic interaction ofpsh1Δandubr2Δwith the spindle assembly checkpoint.Serial dilutions of cells were spotted into YPD plates with and without benomyl and then grown for 2 days at 30°C prior to imaging.
[52]. However, recent work using synthetic kinetochores has demonstrated that a functional kinetochore can assemble backwards from the microtubule associated DAM1/DASH complex [31,32]. Recruitment of outer kinetochore proteins to a non-centromere sequence is sufficient to generate an artificial kinetochore that no longer requires a specificCENsequence but does require inner kinetochore proteins. These observations challenge the hierarchical assembly model, albeit in an artificially tethered system and suggest that the kinetochore structure may be more adaptable than previously imagined.
In an effort to perturb the kinetochore structure we examined kinetochores in mutants of two ubiquitin ligases that are known to affect the degradation of kinetochore proteins, Psh1 and Ubr2. The Psh1 ubiquitin ligase regulates the levels of Cse4 protein at the kinetochore focus [26,27]. We confirmed that the levels of Cse4 are increased inpsh1Δcells, and
addition-ally found that the levels of inner kinetochore proteins Mif2, Okp1, Ame1 and Ctf19 also increase (Fig 2). The increase in kinetochore-loaded Cse4 was higher than the other inner kinetochore proteins, suggesting that some of the excess Cse4 is not able to recruit these addi-tional proteins and maybe part of a local‘cloud’of Cse4 adjacent to the kinetochore [40] or that it is in a form that is unable to recruit the other components. Consistent with the former notion, we find that the increased Cse4 in apsh1Δmutant is spread over a larger area, although
this is not true for all kinetochore proteins that are elevated inpsh1Δcells (Fig 3). This may
explain why a large increase in Cse4 levels results in only a modest increase in, for example, members of the COMA complex. Surprisingly, we found that outer kinetochore protein levels are unaffected inpsh1Δcells (Fig 2). These data support the idea that in these mutants the
stoi-chiometry of the kinetochore is flexible. We found that mutating bothPSH1andUBR2is suffi-cient to modestly increase the levels of members of the MIND complex (Fig 4). In budding yeast, if we assume two Cse4 molecules per centromere, there are about 6–7 MIND complexes per kinetochore in anaphase [7,53]. In thepsh1Δubr2Δdouble mutants, the ~ 30% increase of
Mtw1 and Dsn1 would correspond to ~2 additional MIND complexes per kinetochore. It is unlikely that the chromosome instability phenotype found inpsh1Δand psh1Δubr2Δ(Fig 7)
accounts for the difference in kinetochore protein levels (Fig 2andFig 4). If these mutant cells would have a higher number of chromosomes (due to their CIN phenotype), we would expect all kinetochore components to be similarly increased. Instead, we find no change in Ndc10 pro-tein levels in the absence of Psh1, Ubr2 or both (Fig 2andFig 4), and we also did not find an increase in the outer kinetochore proteins inpsh1Δcells. It is possible that the additional
pro-teins at the kinetochore focus inpsh1Δandpsh1Δubr2Δare not part of the structural
kineto-chore assembly. However, the magnitude of the increase of Mtw1 and Dsn1 in thepsh1Δ
ubr2Δdouble mutant (Fig 4) is similar to the increase in Mif2 and COMA complex proteins in
thepsh1Δmutant (Fig 2). This suggests that the amount of MIND complex binding to the
kinetochore is still limited by the amount of inner kinetochore components, consistent with a hierarchical kinetochore assembly. The doublepsh1Δubr2Δmutant does suppress some
char-acteristics of thepsh1Δphenotype; including meiotic sporulation defects (Fig 6) and mitotic
genome instability (Fig 7). It is possible that partially restoring the stoichiometry between inner and outer kinetochore proteins contributes to this phenotypic suppression. However, it is important to note that there is no evidence that the increased Cse4 levels at the kinetochore in
psh1Δcells cause their CIN phenotype. Collectively our data show that inclusion of kinetochore
proteins into the kinetochore focus is flexible in mutant backgrounds. Furthermore, that the genomic instability ofpsh1Δcells, which may result from increased Cse4 loading, is suppressed
by second mutation,ubr2Δ, that also increases the levels of MIND complex members.
Inpsh1Δcells, Cse4 is increased at kinetochore foci (Fig 2) and also deposited ectopically in
interaction ofpsh1Δwith spindle assembly checkpoint componentsmad1Δandmad3Δin the
presence of microtubule poison (Fig 8) suggests a decreased kinetochore function inpsh1Δ.
Surprisingly,ubr2Δpartially rescued benomyl sensitivity of bothmad1Δandmad3Δalso in
combination withpsh1Δ(Fig 8). Thisubr2Δsuppressor effect was not recapitulated byDNS1
overexpression (S8 Fig), suggesting an additional role of Ubr2. It is possible that the upregula-tion of other Ubr2/Mub1 complex targets, such as Rpn4 [54] and Sml1 [55], contribute to the suppression of mitotic and meiotic phenotypes ofubr2Δ.
Ubr2 has been previously shown to reduce Dsn1 protein stability by ubiquitylation [30], but the impact of Ubr2 in kinetochore composition was not known. Ipl1 phosphorylation on Dsn1 promotes the interactions of the MIND complex with the inner kinetochore proteins [42]. However, the presence ofdsn1-S240D/S250Ddid not increase Mtw1 kinetochore levels in wild type orpsh1Δcells, but only inpsh1Δubr2Δdouble mutant and slightly inubr2Δ(Fig 5). Our
data suggest an important role of Ubr2 on limiting outer kinetochore loading by restricting MIND complex availability (Figs4and5). From our data, we cannot be sure whether the changes in kinetochore protein levels are a direct result of changes in ubiquitylation status of kinetochore proteins, the effects may be indirect. We note that the artificial recruitment of Ubr2 and Mub1 to kinetochores does not cause a growth defect [56]. Our data also show that Ubr2 is upstream of Ipl1 in the regulation of outer kinetochore assembly (Fig 5).
Regardless of the mechanism of action of Psh1 and Ubr2, the flexibility of kinetochore stoi-chiometry may have some functional significance. Kinetochore components are remarkably well conserved fromS.cerevisiaetoH.sapiensalthough the centromeres to which they bind are highly divergent both in length and sequence. It is hard to imagine that an inflexible kineto-chore structure would be sufficient to support the rapid evolution that is typically seen for cen-tromere sequences [57,58]. Our data in yeast show that overexpression of the kinetochore geneMTW1is not sufficient to disrupt kinetochore function, however this may not be true for all kinetochore genes or in nascent tumor cells. This is further supported by the observation that overexpression ofCSE4is not lethal without further perturbations to the kinetochore [26,
27,59].
Materials and Methods
Yeast strains and plasmid construction
Yeast strains used in this study are either W303 or S288C background, as indicated inS1 Table. For plasmid construction (seeS2 Table), theSPC42-RFPsequence containing 200 bp of the
SPC42promoter was cloned into pX29 plasmid (CEN6,LEU2,CUP1promoter). Then,YFP
(pHT5),CFP(pHT222),MTW1-YFP(pHT15) orMTW1-CFP(pHT223) were cloned down-stream of theCUP1promoter by gap repair. A sequence encoding four alanine residues was used as a linker betweenMTW1and the fluorescent tags, and betweenSPC42andRFP. Plas-mids were transformed into appropriate strains by lithium acetate transformation and continu-ously selected in synthetic media lacking leucine.
MTW1,PSH1andUBR2genes were disrupted by transforming with PCR products contain-ing eitherMX6-KANorMX6-NATselection cassettes flanked with ~250 bp of sequences upstream and downstream the corresponding coding regions. Gene deletions were confirmed by PCR. SinceMTW1is an essential gene, it was disrupted in a haploid strain harbouring
CUP1-pMTW1-YFP::LEU2plasmid (pHT15). Transformants were selected in synthetic media lacking leucine and containing G418 and confirmed by PCR. Diploid strainMTW1-YFP/ MTW1-CFP(PT11) was transformed usingmtw1Δ::KANMXPCR to obtain heterozygous
was tested by fluorescence microscopy and insertion of theKANMXcassette at one of the
MTW1locus was confirmed by PCR.
Yeast growth conditions
For microscopy and western blot analysis cells were grown in synthetic complete (SC) or lack-ing leucine SC–LEU media supplemented with 100mg/ml of adenine (+ADE, 100 mg/mL). Yeast strains were grown overnight at 23°C. Cultures were diluted in fresh media toOD600 0.3 and grown for 3 hours before imaging or protein extraction.
Fluorescence microscopy
Cells from log-phase cultures were mounted on microscope slides with 0.7% LMP agarose in SC +ADE or SC-LEU +ADE, and covered with 0.17 mm glass coverslips. Our microscope sys-tem uses a Zeiss AxioImager Z2 microscope, 63X Plan Apo, 1.4NA, oil immersion objective and a Hamamatsu CCD ORCAII camera (2X2 binning and maximum analog gain). The result-ing pixel size was 0.205μm. Excitation light was provided by LED Colibri system (excitation
band-pass filter): CFP 445 nm (445/25), YFP 505 nm (510/15), GFP 470 nm (474/28) and RFP 590 nm (585/35). Emission band-pass filters were as follows: CFP 47HE (480/40), YFP 46HE (535/30), GFP 38HE (525/50), and RFP 63HE (629/62). Exposure times were optimized for each fluorescent protein and ranged from 100 to 250ms. Z stacks consisted of 17 vertically sep-arated slices with 0.4μm spacing. The theoretical dynamic range of our system is ~3000 levels
of brightness, however, in practice this will be somewhat lower.
Fluorescence quantitation
A custom-made protocol in Volocity software was used to quantify fluorescence intensity at kinetochore foci. The protocol finds the brightest spots in the image. Spots within 3 pixels from x,y,z edges of the image were removed from the analysis. A 3D box was drawn concentric to the brightest pixels (1.36μm3). The background region was 2 pixels separated from the
kineto-chore box (23.51μm3). Average intensity of the background was subtracted from average
kinetochore intensity to obtain the final fluorescence value. Finally, fluorescence values were normalized to the average of wild type or control populations. For quantitation, only post-ana-phase kinetochores of dividing cells were selected.
Gaussian distribution fitting
To measure the size of individual kinetochore foci we fit two Gaussian distributions to each kinetochore. A five pixel square box was selected for each kinetochore and a local background subtracted. The pixel values in each column and each row were summed and for both the rows and columns and then we used ImageJ’s fitDoFit function to fit a Gaussian curve to the values, separately both the rows and columns (Fig 3A). The two values for the full width at half maxi-mum (FWHM), vertical and horizontal Gaussian fits, were averaged to give a mean FWHM measurement for each focus. The mean FWHM measurements for each experiment were nor-malized relative to the level in WT cells.
Western blot analysis
acrylamide gel (Biorad). Proteins were transferred into a PVDF blotting membrane (GE Healthcare Amersham). The western blot was performed with monoclonal anti-GFP antibody (Roche), anti-PGK1 (Invitrogen), goat anti-mouse HRP antibody (Abcam), and ECL kit (GE Healthcare Amersham).
Benomyl sensitivity assay
Yeast strains were grown o/n at 30°C in YPD or selective media. Cultures were adjusted to OD600= 1, serially diluted and spotted into YPD or selective media plates with 0.2% DMSO and 10–15μg/ml benomyl. For testing effects of overexpression increasing concentrations of
CuS04were added to the media as indicated. Plates were incubated for 2 days at 30°C before images were captured.
Sporulation efficiency
Diploid strains were grown in YPD at 23°C for 24 hours. Then, cultures were diluted 100X in YEPA media and grown at 23°C until OD600reached 0.6 (2X10⁷cells/ml). Cultures were washed once with water, resuspended in SPO media and incubated at 23°C for 3 days. Four independent cultures were tested for each genotype. To test spore viability, 22 tetrads per geno-type were dissected in YPD and grown for 2 days at 30°C.
Meiotic synchronization
Diploid strains were grown in YPD for 24 hours at 30°C. Cultures were diluted to OD6000.3 in YPA (1% yeast extract, 2% Bacto-peptone, 1% potassium acetate) and grown for 12–15 h at 30°C. Cells were then resuspended in sporulation media (1% potassium acetate pH7) at 23°C for 12 hours. Finally, 1μMβ-estradiol (Sigma) was added to induceNDT80expression. Cells
were imaged every hour to follow meiotic divisions.
Cell cycle analysis
MATastrains lacking the Bar1 protein were used to facilitateα-factor G1 synchronization. Strains were grown overnight at 30°C, diluted to OD600= 0.3 and grown for 1 hour. The asyn-chronous sample was collected at this time, thenα-factor was added and cells were incubated for additional for 2.5 hours. G1 arrest was confirmed by the presence of the characteristic
‘shmoo’morphology. Cells were washed twice with water and resuspended in YPD with Pro-nase E. Samples were taken every 30 minutes until 180 minutes. Cells were prepared for flow cytometry as in [60]. Briefly, cells were fixed overnight in 70% ethanol at 4°C, washed once with water, resuspended in RNAase solution and incubated at 37°C for 2 hours. Cells were then washed once with water and resuspended in protease solution for 30 minutes. For FACS analysis, cells were resuspended in 1μM SYTOX solution (Invitrogen). Cell cycle profiles were
generated in a BD Canto Flow cytometer using the GFP filter. G1, S and G2/M populations were calculated using FCS Express (De Novo Software). ForS3A Fig, cell cycle progression was scored by fluorescence microscopy. Cells containing a single Mtw1-YFP (kinetochore) and Spc42-RFP (spindle pole body, SPB) foci and without bud were scored as G1 cells. Budding cells with a single kinetochore and SPB were scored as S phase. Cells with one kinetochore and two SPB or two kinetochores and two SPBs were scored as G2/M (Metaphase to Telophase).
Diploid bimater assay
of log-phase cultures of haploid mating tester strains (HIS3/his1-). Cells were concentrated by gentle centrifugation and incubated overnight at 23°C. The next day these cells were plated on synthetic dropout plates and incubated for 3 days at 30°C to select forHIS+mating products. For each colony, mating products originating from both mating typeMATaandMATαtester
strains were summed. For each strain, the median number of colonies from the 5 colonies was calculated.
Twin spot assay
Strains with a tetracycline operator array, inserted at the URA3 locus of chromosome V and a tetracycline repressor linked to mRFP, were grown overnight in synthetic media at 23°C. The day after the culture was diluted and further grown until log phase. Cells were imaged as explain above. In each image, cells showing aberrant chromosome segregation were identified as containing two TetR-mFRP foci in G1 or S-M
Plasmid loss assay
Strains were transformed with aCENplasmid with a selectable marker and grown for two days. 9 colonies were grown overnight in YPD and then plated in either YPD or selective media. The percentage of plasmid loss was calculated by subtracting the amount of cells grow-ing in the selective media to the number of cells growgrow-ing in YPD. The data is presented as the median of percentage plasmid loss of 9 colonies.
Supporting Information
S1 Fig. Cellular background does not affect Mtw1-YFP quantitation.(A-B) Quantitation of Mtw1-YFP kinetochore and background fluorescence intensity. Top panels and bottom panels display the distribution of intensities and the mean intensity ± standard deviation. Fluores-cence intensity levels are normalised relative to the mean intensity of the endogenously tagged Mtw1-YFP strain (black line and circle). Using a background correction region further from kinetochore did not change quantitation of Mtw1-YFP. Strains ectopically expressing Mtw1-YFP have higher background whenMTW1is also expressed from endogenous locus (green and blue lines and circles).
(TIF)
S2 Fig. Ectopic expression ofMTW1increases Mtw1 cellular levels.(A) Total Mtw1 protein increases in haploid and diploid strains fromFig 1. This is an expanded version ofFig 1F, showing a western blot of total cell extracts from both haploid and diploid cells. Quantification of cellular levels of Mtw1-YFP/-CFP relative to Pgk1 is shown below. (B) DiploidMTW1-YFP/
mtw1Δare haplo-sufficient. Serial dilutions of cells grown in YPD were spotted onto YPD
plates containing benomyl diluted in DMSO. Cells were grown for 2 days at 30°C. (C)MTW1
over-expression does not affect growth or benomyl sensitivity. (TIF)
containing an empty plasmid (left panels) andMTW1(right panels). Cell outlines are shown in the RFP image as dashed lines, arrowheads highlight aberrant segregation, the scale bar is 5μm. (D) The proportion of cells showing aberrant chromosome V segregation was not
signifi-cantly different between cells containing an empty plasmid (control) and those containing
MTW1 (MTW1-OX)(error bars show 95% binomial confidence intervals). (E-F) Quantitation of Dsn1-GFP (E) and Ndc80-GFP (F) kinetochore levels in control (black), lowMTW1-OX
(light blue) and highMTW1-OX(dark blue). Fluorescence intensity levels are normalised rela-tive to control mean intensity. Left panel and right panels display the mean
intensity ± standard deviation and the distribution of intensities, respectively. EctopicMTW1
was expressed from a CUP1p. No additional copper was added to the lowMTW1-OXcells. 100μM CuSO4was added to the highMTW1-OX cellsfor 3 hours before imaging.
(TIF)
S4 Fig. Ectopic expression of kinetochore proteins do not generally affect growth or beno-myl sensitivity.Serial dilutions of cells were spotted into synthetic media lacking leucine to select for plasmid, with several concentrations of benomyl and CuSO4.Cells spots were grown for 2 days at 30°C prior to imaging.
(TIF)
S5 Fig. Mtw1 kinetochore levels are not affected in various kinetochore mutants.(A-B) Quantitation of Mtw1 kinetochore levels inctf19Δ,csm1Δ,cbf1Δ,mam1Δand cnn1Δmutants.
Fluorescence intensity levels are normalised relative to wild-type mean intensity. Top panels and bottom panels display the distribution of intensities and the mean intensity ± standard deviation, respectively.
(TIF)
S6 Fig. Size of kinetochore foci and MIND protein levels inpsh1Δubr2Δmutant.(A-C) Quantitation of size of kinetochore foci in wild type (black)psh1Δ(blue),ubr2Δ(green) and
psh1Δubr2Δ(red) cells. Fluorescence peak height values and full width at half maximum
(FHWM) values are normalised relative to wild-type mean intensity ± standard deviation. Top panels and bottom panels display the distribution of intensities and the mean
intensity ± standard deviation, respectively. (A) Cse4-GFP. Peak height: wild type 1.00±0.15,
psh1Δ1.72±0.37,ubr2Δ0.96±0.14,psh1Δubr2Δ1.91±0.48. FHWM: wild type 1.00±0.26,
psh1Δ1.16±0.31,ubr2Δ0.98±0.25,psh1Δubr2Δ1.17±0.28. (B) Mif2-GFP. Peak height:
wild type 1.00±0.24,psh1Δ1.36±0.43,ubr2Δ1.16±0.28,psh1Δubr2Δ1.28±0.30. FHWM:
wild type 1.00±0.25,psh1Δ1.02±0.23,ubr2Δ1.05±0.24,psh1Δubr2Δ1.05±0.21. (C)
Dsn1-GFP. Peak height: wild type 1.00±0.19,psh1Δ1.12±0.21,ubr2Δ1.06±0.23,psh1Δubr2Δ
1.18±0.28. FHWM: wild type 1.00±0.21,psh1Δ0.97±0.17,ubr2Δ1.03±0.24,psh1Δubr2Δ
1.05±0.23 (D-E) Total Mtw1 and Dsn1 protein do not change inpsh1Δ,ubr2Δandpsh1Δ
ubr2Δcells. Western blot of total cell extracts. Quantification of cellular levels of
Mtw1-YFP/-CFP relative to Pgk1 is shown below. (TIF)
S7 Fig. Cell cycle progression is not affected inpsh1Δandubr2Δubiquitin ligase mutants. (A) Cell cycle profiles of wild type,phs1Δ,ubr2Δ, andpsh1Δubr2Δ.MATabar1Δcells were
synchronized in G1 with alpha-factor, and then released (Time 0). (B) Changes in the G1, S and G2/M populations during the course of the experiment.
(TIF)
CUP1pDSN1-OX plasmid, with several concentrations of benomyl and CuSO4.Cells spots were grown for 2 days at 30°C prior to imaging.
(TIF)
S1 Table. List of strains used in this study. (XLSX)
S2 Table. List of plasmids used in this study. (XLSX)
Acknowledgments
We thank Rodney Rothstein, Adele Marston and Grant Brown for strains. We thank Lucy Drury, John Diffley and Graham Preece for help with FACS. We thank all the members of Thorpe lab for technical support and advice, especially Guðjón Ólafsson and Lisa Berry for crit-ical reading of the manuscript.
Author Contributions
Conceived and designed the experiments: EH PHT. Performed the experiments: EH PHT. Analyzed the data: EH PHT. Contributed reagents/materials/analysis tools: EH PHT. Wrote the paper: EH PHT.
References
1. Biggins S. The composition, functions, and regulation of the budding yeast kinetochore. Genetics. 2013; 194(4):817–46. doi:10.1534/genetics.112.145276PMID:23908374
2. Spencer F, Gerring SL, Connelly C, Hieter P. Mitotic chromosome transmission fidelity mutants in Sac-charomyces cerevisiae. Genetics. 1990; 124(2):237–49. PMID:2407610
3. Stirling PC, Bloom MS, Solanki-Patil T, Smith S, Sipahimalani P, Li Z, et al. The complete spectrum of yeast chromosome instability genes identifies candidate CIN cancer genes and functional roles for ASTRA complex components. PLoS Genet. 2011; 7(4):e1002057. doi:10.1371/journal.pgen.1002057 PMID:21552543
4. Tomonaga T, Matsushita K, Ishibashi M, Nezu M, Shimada H, Ochiai T, et al. Centromere protein H is up-regulated in primary human colorectal cancer and its overexpression induces aneuploidy. Cancer Res. 2005; 65(11):4683–9. doi:10.1158/0008-5472.CAN-04-3613PMID:15930286
5. Tomonaga T, Matsushita K, Yamaguchi S, Oohashi T, Shimada H, Ochiai T, et al. Overexpression and mistargeting of centromere protein-A in human primary colorectal cancer. Cancer Res. 2003; 63 (13):3511–6. PMID:12839935
6. Winey M, Mamay CL, O'Toole ET, Mastronarde DN, Giddings TH Jr., McDonald KL, et al. Three-dimen-sional ultrastructural analysis of theSaccharomyces cerevisiaemitotic spindle. J Cell Biol. 1995; 129 (6):1601–15. PMID:7790357
7. Joglekar AP, Bouck D, Finley K, Liu X, Wan Y, Berman J, et al. Molecular architecture of the kineto-chore-microtubule attachment site is conserved between point and regional centromeres. J Cell Biol. 2008; 181(4):587–94. doi:10.1083/jcb.200803027PMID:18474626
8. Westermann S, Schleiffer A. Family matters: structural and functional conservation of centromere-associated proteins from yeast to humans. Trends Cell Biol. 2013; 23(6):260–9. doi:10.1016/j.tcb. 2013.01.010PMID:23481674
9. Cai MJ, Davis RW. Purification of a yeast centromere-binding protein that is able to distinguish single base-pair mutations in its recognition site. Mol Cell Biol. 1989; 9(6):2544–50. PMID:2668736
10. Baker RE, Masison DC. Isolation of the gene encoding theSaccharomyces cerevisiae centromere-binding protein CP1. Mol Cell Biol. 1990; 10(6):2458–67. PMID:2188087
12. Jehn B, Niedenthal R, Hegemann JH. In vivo analysis of theSaccharomyces cerevisiaecentromere CDEIIIsequence: requirements for mitotic chromosome segregation. Mol Cell Biol. 1991; 11(10):5212– 21. PMID:1922041
13. Lechner J, Carbon J. A 240 kd multisubunit protein complex, CBF3, is a major component of the bud-ding yeast centromere. Cell. 1991; 64(4):717–25. PMID:1997204
14. Cole HA, Howard BH, Clark DJ. The centromeric nucleosome of budding yeast is perfectly positioned and covers the entire centromere. Proc Natl Acad Sci U S A. 2011; 108(31):12687–92. doi:10.1073/ pnas.1104978108PMID:21768332
15. Krassovsky K, Henikoff JG, Henikoff S. Tripartite organization of centromeric chromatin in budding yeast. Proc Natl Acad Sci U S A. 2012; 109(1):243–8. doi:10.1073/pnas.1118898109PMID:22184235
16. Furuyama S, Biggins S. Centromere identity is specified by a single centromeric nucleosome in bud-ding yeast. Proc Natl Acad Sci U S A. 2007; 104(37):14706–11. doi:10.1073/pnas.0706985104PMID: 17804787
17. Camahort R, Shivaraju M, Mattingly M, Li B, Nakanishi S, Zhu D, et al. Cse4 is part of an octameric nucleosome in budding yeast. Mol Cell. 2009; 35(6):794–805. doi:10.1016/j.molcel.2009.07.022 PMID:19782029
18. Carroll CW, Milks KJ, Straight AF. Dual recognition of CENP-A nucleosomes is required for centromere assembly. J Cell Biol. 2010; 189(7):1143–55. doi:10.1083/jcb.201001013PMID:20566683
19. Kato H, Jiang J, Zhou BR, Rozendaal M, Feng H, Ghirlando R, et al. A conserved mechanism for cen-tromeric nucleosome recognition by centromere protein CENP-C. Science. 2013; 340(6136):1110–3. doi:10.1126/science.1235532PMID:23723239
20. Hornung P, Troc P, Malvezzi F, Maier M, Demianova Z, Zimniak T, et al. A cooperative mechanism drives budding yeast kinetochore assembly downstream of CENP-A. J Cell Biol. 2014; 206(4):509–24. doi:10.1083/jcb.201403081PMID:25135934
21. Hornung P, Maier M, Alushin GM, Lander GC, Nogales E, Westermann S. Molecular architecture and connectivity of the budding yeast Mtw1 kinetochore complex. J Mol Biol. 2011; 405(2):548–59. doi:10. 1016/j.jmb.2010.11.012PMID:21075115
22. Maskell DP, Hu XW, Singleton MR. Molecular architecture and assembly of the yeast kinetochore MIND complex. J Cell Biol. 2010; 190(5):823–34. doi:10.1083/jcb.201002059PMID:20819936
23. Matson DR, Stukenberg PT. Cdt1 throws kinetochore-microtubule attachments for a loop. Nature cell biology. 2012; 14(6):561–3. doi:10.1038/ncb2513PMID:22643874
24. Tien JF, Umbreit NT, Gestaut DR, Franck AD, Cooper J, Wordeman L, et al. Cooperation of the Dam1 and Ndc80 kinetochore complexes enhances microtubule coupling and is regulated by aurora B. J Cell Biol. 2010; 189(4):713–23. doi:10.1083/jcb.200910142PMID:20479468
25. Lampert F, Hornung P, Westermann S. The Dam1 complex confers microtubule plus end-tracking activity to the Ndc80 kinetochore complex. J Cell Biol. 2010; 189(4):641–9. doi:10.1083/jcb. 200912021PMID:20479465
26. Ranjitkar P, Press MO, Yi X, Baker R, MacCoss MJ, Biggins S. An E3 ubiquitin ligase prevents ectopic localization of the centromeric histone H3 variant via the centromere targeting domain. Mol Cell. 2010; 40(3):455–64. doi:10.1016/j.molcel.2010.09.025PMID:21070971
27. Hewawasam G, Shivaraju M, Mattingly M, Venkatesh S, Martin-Brown S, Florens L, et al. Psh1 is an E3 ubiquitin ligase that targets the centromeric histone variant Cse4. Mol Cell. 2010; 40(3):444–54. doi: 10.1016/j.molcel.2010.10.014PMID:21070970
28. Camahort R, Li B, Florens L, Swanson SK, Washburn MP, Gerton JL. Scm3 is essential to recruit the histone h3 variant cse4 to centromeres and to maintain a functional kinetochore. Mol Cell. 2007; 26 (6):853–65. doi:10.1016/j.molcel.2007.05.013PMID:17569568
29. Yuen KW, Warren CD, Chen O, Kwok T, Hieter P, Spencer FA. Systematic genome instability screens in yeast and their potential relevance to cancer. Proc Natl Acad Sci U S A. 2007; 104(10):3925–30. doi: 10.1073/pnas.0610642104PMID:17360454
30. Akiyoshi B, Nelson CR, Duggan N, Ceto S, Ranish JA, Biggins S. The Mub1/Ubr2 ubiquitin ligase com-plex regulates the conserved Dsn1 kinetochore protein. PLoS Genet. 2013; 9(2):e1003216. doi:10. 1371/journal.pgen.1003216PMID:23408894
31. Lacefield S, Lau DT, Murray AW. Recruiting a microtubule-binding complex to DNA directs chromo-some segregation in budding yeast. Nature cell biology. 2009; 11(9):1116–20. doi:10.1038/ncb1925 PMID:19684576
33. Malvezzi F, Litos G, Schleiffer A, Heuck A, Mechtler K, Clausen T, et al. A structural basis for kineto-chore recruitment of the Ndc80 complex via two distinct centromere receptors. Embo J. 2013; 32 (3):409–23. doi:10.1038/emboj.2012.356PMID:23334295
34. Wang HW, Ramey VH, Westermann S, Leschziner AE, Welburn JP, Nakajima Y, et al. Architecture of the Dam1 kinetochore ring complex and implications for microtubule-driven assembly and force-cou-pling mechanisms. Nat Struct Mol Biol. 2007; 14(8):721–6. doi:10.1038/nsmb1274PMID:17643123
35. Wong J, Nakajima Y, Westermann S, Shang C, Kang JS, Goodner C, et al. A protein interaction map of the mitotic spindle. Mol Biol Cell. 2007; 18(10):3800–9. doi:10.1091/mbc.E07-06-0536PMID: 17634282
36. Westermann S, Cheeseman IM, Anderson S, Yates JR 3rd, Drubin DG, Barnes G. Architecture of the budding yeast kinetochore reveals a conserved molecular core. J Cell Biol. 2003; 163(2):215–22. doi: 10.1083/jcb.200305100PMID:14581449
37. De Wulf P, McAinsh AD, Sorger PK. Hierarchical assembly of the budding yeast kinetochore from multi-ple subcommulti-plexes. Genes Dev. 2003; 17(23):2902–21. doi:10.1101/gad.1144403PMID:14633972
38. Pinsky BA, Tatsutani SY, Collins KA, Biggins S. An Mtw1 complex promotes kinetochore biorientation that is monitored by the Ipl1/Aurora protein kinase. Dev Cell. 2003; 5(5):735–45. PMID:14602074
39. Mascorro-Gallardo JO, Covarrubias AA, Gaxiola R. Construction of aCUP1promoter-based vector to modulate gene expression inSaccharomyces cerevisiae. Gene. 1996; 172(1):169–70. PMID:8654982
40. Haase J, Mishra PK, Stephens A, Haggerty R, Quammen C, Taylor RM 2nd, et al. A 3D map of the yeast kinetochore reveals the presence of core and accessory centromere-specific histone. Curr Biol. 2013; 23(19):1939–44. doi:10.1016/j.cub.2013.07.083PMID:24076245
41. Mishra PK, Guo J, Dittman LE, Haase J, Yeh E, Bloom K, et al. Pat1 protects centromere-specific his-tone H3 variant Cse4 from Psh1-mediated ubiquitination. Mol Biol Cell. 2015; 26(11):2067–79. doi:10. 1091/mbc.E14-08-1335PMID:25833709
42. Akiyoshi B, Nelson CR, Biggins S. The aurora B kinase promotes inner and outer kinetochore interac-tions in budding yeast. Genetics. 2013; 194(3):785–9. doi:10.1534/genetics.113.150839PMID: 23636741
43. Yuen KW, Montpetit B, Hieter P. The kinetochore and cancer: what's the connection? Curr Opin Cell Biol. 2005; 17(6):576–82. doi:10.1016/j.ceb.2005.09.012PMID:16233975
44. Deutschbauer AM, Williams RM, Chu AM, Davis RW. Parallel phenotypic analysis of sporulation and postgermination growth inSaccharomyces cerevisiae. Proc Natl Acad Sci U S A. 2002; 99(24):15530– 5. doi:10.1073/pnas.202604399PMID:12432101
45. Carlile TM, Amon A. Meiosis I Is Established through Division-Specific Translational Control of a Cyclin. Cell. 133(2):280–91. doi:10.1016/j.cell.2008.02.032PMID:18423199
46. Hardwick KG, Murray AW. Mad1p, a phosphoprotein component of the spindle assembly checkpoint in budding yeast. J Cell Biol. 1995; 131(3):709–20. PMID:7593191
47. Hardwick KG, Johnston RC, Smith DL, Murray AW.MAD3encodes a novel component of the spindle checkpoint which interacts with Bub3p, Cdc20p, and Mad2p. J Cell Biol. 2000; 148(5):871–82. PMID: 10704439
48. Cheeseman IM, Desai A. Molecular architecture of the kinetochore-microtubule interface. Nat Rev Mol Cell Biol. 2008; 9(1):33–46. doi:10.1038/nrm2310PMID:18097444
49. Petrovic A, Pasqualato S, Dube P, Krenn V, Santaguida S, Cittaro D, et al. The MIS12 complex is a pro-tein interaction hub for outer kinetochore assembly. J Cell Biol. 2010; 190(5):835–52. doi:10.1083/jcb. 201002070PMID:20819937
50. Aravamudhan P, Felzer-Kim I, Joglekar AP. The budding yeast point centromere associates with two Cse4 molecules during mitosis. Curr Biol. 2013; 23(9):770–4. doi:10.1016/j.cub.2013.03.042PMID: 23623551
51. Collins KA, Castillo AR, Tatsutani SY, Biggins S. De novo kinetochore assembly requires the centro-meric histone H3 variant. Mol Biol Cell. 2005; 16(12):5649–60. doi:10.1091/mbc.E05-08-0771PMID: 16207811
52. Nannas NJ, O'Toole ET, Winey M, Murray AW. Chromosomal attachments set length and microtubule number in theSaccharomyces cerevisiaemitotic spindle. Mol Biol Cell. 2014; 25(25):4034–48. doi:10. 1091/mbc.E14-01-0016PMID:25318669
53. Joglekar AP, Bouck DC, Molk JN, Bloom KS, Salmon ED. Molecular architecture of a kinetochore-microtubule attachment site. Nature cell biology. 2006; 8(6):581–5. doi:10.1038/ncb1414PMID: 16715078
55. Andreson BL, Gupta A, Georgieva BP, Rothstein R. The ribonucleotide reductase inhibitor, Sml1, is sequentially phosphorylated, ubiquitylated and degraded in response to DNA damage. Nucleic Acids Res. 2010; 38(19):6490–501. doi:10.1093/nar/gkq552PMID:20566477
56. Olafsson G, Thorpe PH. Synthetic physical interactions map kinetochore regulators and regions sensi-tive to constitusensi-tive Cdc14 localization. Proc Natl Acad Sci U S A. 2015; 112(33):10413–8. doi:10.1073/ pnas.1506101112PMID:26240346
57. Bensasson D, Zarowiecki M, Burt A, Koufopanou V. Rapid evolution of yeast centromeres in the absence of drive. Genetics. 2008; 178(4):2161–7. doi:10.1534/genetics.107.083980PMID:18430941
58. Henikoff S, Ahmad K, Malik HS. The centromere paradox: stable inheritance with rapidly evolving DNA. Science. 2001; 293(5532):1098–102. doi:10.1126/science.1062939PMID:11498581
59. Collins KA, Camahort R, Seidel C, Gerton JL, Biggins S. The overexpression of aSaccharomyces cere-visiaecentromeric histone H3 variant mutant protein leads to a defect in kinetochore biorientation. Genetics. 2007; 175(2):513–25. doi:10.1534/genetics.106.064410PMID:17151247