RIZWAN AHMED MEMON*, MUHAMMAD ASLAM UQAILI**, AND ASHFAQUE AHMED HASHMANI***
RECEIVED ON 11.11.2010 ACCEPTED ON 03.01.2011
ABSTRACT
The k-εεεεε turbulence model is adopted in this study to simulate the impact of street canyon AR (Aspect Ratios) on heating within street canyon. The two-dimensional model was validated for RANS (Reynolds Averaged Navier Stokes) and energy transport equations. The validation process confirms that the results of the model for air-temperature and wind speed could be trusted. The application of the said model is carried out to ideal street canyons of ARs (ratio of building-height-to-street-width) from 0.4 to 2 with the same boundary conditions. Notably, street canyon aspect ratio was calculated by varying the street width while keeping the building height constant. Results show that the weighted-average-air-temperature within AR 0.4 was around 0.8% (i.e. 2.4K) higher than that within AR 2.0. Conversely, there was strong correlation (i.e., R2>0.9) between air temperature within the street canyon and street canyon AR.
Results demonstrate stronger influence of vertical velocity on heating within street canyon. Evidently, increased vertical velocity decreased the temperatures. Conversely, temperatures were higher along the leeward side of the canyon in lower ARs.
Key Words: Vertical Velocity, Surface Temperature, Horizontal Velocity, Model Validation, Turbulence.
* Assistant Professor, Department of Mechanical Engineering, Mehran University of Engineering and Technology, Jamshoro. * * Professor, Department of Electrical Engineering, Mehran University of Engineering and Technology, Jamshoro.
*** Assistant Professor, Department of Electrical Engineering, Mehran University of Engineering and Technology, Jamshoro.
1.
INTRODUCTION
I
t is widely accepted that heating in urban areas causes serious environmental problems, thermal discomfort and increased cooling energy demand [1-4]. However, heating within street canyon is significantly affected by the street canyon design and weather conditions [5-10]. Although there has been a huge work on studying urban heating effects [1, 11-19], the work carried out for understanding the effects of man-made and environmental impacts on transport and dispersion of heating within street canyon is insufficient [20-26]. The insufficiency of the work is due to the fact that few studies, as mentionedsimilar study by simulating the effects of street canyon AR and ambient wind speed on urban heating. However, that study was focused on the effects of taller buildings as the AR was calculated by varying the height of the building with a constant street canyon width. On the other hand, this study compares the impacts of wider streets as the street canyon width is varied. Subsequently, this study is carried out using RNG (Re-Normalization Group Theory) version of k-ε turbulence model adopting enhanced wall treatment [27]. The validation shows that the RNG version of k-ε model would give promising results on the temperature and wind profiles within the street canyon [28-29]. This study simulates different building ARs (i.e. from 0.4 to 2.0). The results for different AR were compared to evaluate the impact of wider streets. The results of this study could particularly be interesting to town planners, environmentalists and HVAC Engineers [30-31].
2.
NUMERICAL MODEL
The governing equations for the mathematical model, used in this study, comprise of Equations (1-3). The Equations (1-3) are based on the principles of conservation of mass (Equation (1)), momentum (Equations (2)) and energy (Equation (3)). These model governing equations include surface pressure and shear forces in the equation of conservation of momentum (Equations (2)) which requires additional equations for k (kinetic energy) and ε (dissipation rate) to address closure problem [27].
0 i i u = ∂ ∂ x (1) j x j u i u j x i u v p i g j x i u j u t i u ∂ ′ ′ ∂ − ∂ ∂ + ∂ ∂ − − = ∂ ∂ + ∂ ∂ ( ) 2 2 i x 1 ρ (2) j x j u j x j x j u t ∂ ′ ′ ∂ − ∂ ∂ = ∂ ∂ + ∂ ∂ ( ) 2
2θ θ
θ ν θ θ
(3)
The closure problem is addressed by using turbulent kinetic energy (k) and turbulent dissipation rate (ε) equations based on RNG theory. All equations are solved with second order discretization using finite volume method and adopted in CFD code Fluent 6.2.1 [27]. No slip boundary condition is defined at ground and on the building surfaces. The top of the model is defined with symmetry boundary condition while the wall and ground surfaces were employed with fixed temperatures (Fig. 1). The variation of air density due to temperature has been mulled using Boussinesq approximation that incorporates the density variation in the momentum equation. The near wall velocity and temperature gradients are solved using enhanced wall treatment. The enhanced wall treatment needs higher-resolution but can resolve the near-wall temperature and velocity gradients efficiently. The mesh adjacent to the wall is refined for solving the near wall properties. Further detail of the model, and enhanced wall treatment can be found in other studies [6,29]. The physical model consists of seven street canyons with about 400,000 structured elements. The mesh for the model is generated for AR1 and scaled for AR 0.4 to 2.0 in Fluent code while the depth of free stream flow equals to thrice the height of the street canyon (Fig. 1).
3.
VALIDATION OF MODEL
The potential temperature and horizontal velocity obtained from the model of AR 1.0 are compared with the results obtained from a wind tunnel experiment [28] for AR1. The comparison of temperature and velocity profiles obtained for validation is shown in Fig. 2. The portrayed graphs show that the results obtained from this model give reasonable accuracy as compared to those obtained from the wind tunnel. The deviations in the model are evident in particular at the middle (Z/H ~ 0.4 to 0.8) and above street canyon (Z/H>1.0) in the case of velocity profile (Fig. 2). On the other hand, in the case of temperature, the deviations near roof (Z/H~ 0.8 to 1.0) are high. However, as the model results for temperature and velocity profiles have only been used within the street canyon the results would be acceptable for evaluation of this study. The differences in the trends obtained from this model and that from wind tunnel experiment might have been due to the differences in simulation conditions and experimental set-up. Further detail of the validation and the specific differences in the present model and wind tunnel experiment can be referred in [6,29].
4.
RESULTS AND DISCUSSION
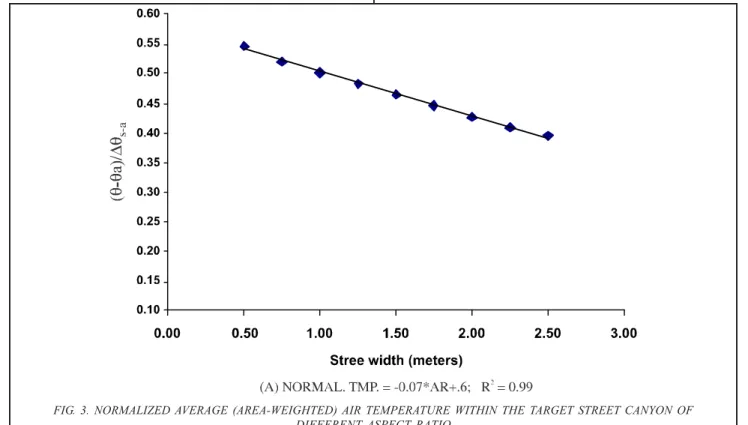
The street canyon model is simulated by varying street canyon width, from 0.5 to 2.5, with an increment of 0.25 that results in street canyon aspect ratios of 0.4 to 2.0. Notably, the building height is kept constant to develop models for different aspect ratio; this help simulate the results for wider streets. In order to facilitate a comparison among the results for different ARs, all boundary conditions were kept the same in all the simulated cases. The resultant average air-temperature (area-weighted) within the target street canyon (middle canyon) were normalized with the surface and air temperature difference (Δθs-a). Linear regression is conducted in the resultant normalized temperatures for different heating situations as shown in Fig. 3. Clearly, air-temperature decrease with an increase in street canyon aspect ratio. Notably, the highest decrease in average air temperature (i.e. around 2.4 K or 0.8%) was observed between aspect ratios of 0.4 and 2.0. The reductions in air temperature when street canyon width increased from 0.5 to 0.75, 1.0, 1.25, 1.5, 1.75, 2.0, 2.25 and 2.5 were around 0.2, 0.5, 0.8, 1.1, 1.4, 1.7 and 2 K, respectively. Seemingly, reductions in air-temperatures
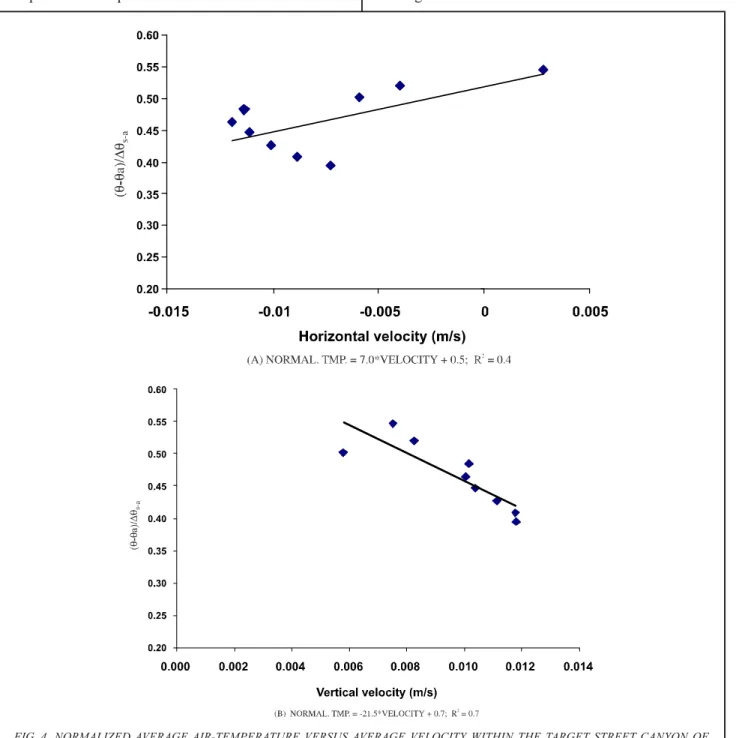
are consistent with the changes in aspect ratios. The prevailing trend shows that reductions in air temperature were within a range of 0.1 to 0.15% for different aspect ratios. The highest decrease is observed between the street canyon width of 2.25 and 2.5 as air-temperature decreased by around 0.15% (0.4 K). Seemingly, the correlation derived between the AR and average air temperature is very strong (i.e. R2~0.99). Memon, R.A., et. al. [6] noted that ambient wind speed has a significant impact on the heating within the street canyon. The weighted average components for horizontal and vertical velocity during different AR situations have been graphed against average temperature within the target street canyon (Fig. 4(a-b)). It could easily be seen that horizontal velocity decreased initially for the smaller aspect ratios but increased later-on in the lower aspect ratios (i.e. from AR 0.4-0.57). On the other hand, vertical velocity decreased continuously with an increase in temperature throughout the simulation of different cases. The correlation for the horizontal velocity and temperature is clearly weaker than that between the vertical velocity and temperature. Moreover, the vertical velocity
correlation shows that with an increase of 0.1 m/s in the velocity there will be a decrease of around 1.5K in the average temperature within the street canyon. On the other hand, the result for horizontal velocity shows that with an increase of 0.1 m/s, temperatures will increase by around 0.1K. Seemingly, the impact of vertical velocity is higher as there has been an overall increase in the temperature with a decrease in aspect ratio within the street canyon.
Above discussion shows that vertical velocity has a significant impact on temperatures within the street canyon. Therefore, spatial isotherms and normalized vertical velocity curves have been drawn within the target street canyon for different simulated cases as depicted in Fig. 5. Fig. 5(a) shows air-temperature and vertical velocity trends within the target street canyon of AR2.0 or street canyon width of 0.5 (ReH~33000). Clearly, higher temperature exists in the corners of the canyon adjacent to the leeward and windward walls. The upper portion of
the leeward wall is at higher temperature. However, the higher temperature contour (i.e. 0.6-0.7) covers more
space in the corner adjacent with the windward wall than
that leeward wall. A low temperature contour could be seen at the entrance point of windward wall which may be a result of fresh gust of air from that side. Analysis of temperature contours in other figures (Fig. 5(b-i)) shows that the temperatures decreased gradually with a decrease in aspect ratio in particular on the windward side.
Evidently, the lower temperature contour (i.e. 0.3-0.4)
expends along the windward wall side and then cover most of the portion of the canyon. However, this happens gradually as temperatures adjacent to the corner with the windward wall are higher. Conversely, temperatures along the leeward wall are higher in the corner as well as along the wall.
Seemingly, the vertical velocity trends are correctly reflecting the temperature variations due to street canyon aspect ratio (Fig. 5). The vertical velocity is the lowest with the corners of windward and leeward walls. Simultaneously, vertical velocity is the highest along the rest of the windward wall (i.e. contour of 0.12 to 0.18), higher with the leeward wall (i.e. a contour of 0.06 to 0.11) but lower within the rest of the canyon (i.e. 0.0 to 0.06). It is clear from the figure of spatial isotherms for AR 2.0 (Fig. 5(a)) that the temperatures are the highest with the corners adjacent to the windward and leeward walls but
comparatively lower along the leeward and windward walls and in the rest of the canyon. Apparently, vertical velocity continues to increase along the leeward and windward walls from AR 2.0 to 0.66 (Fig. 5(a-e)) decreasing temperatures within the street canyon. A comparison shows that vertical velocity in lower ARs (i.e. from 0.57 to 0.4) reduces along the windward and leeward walls although the velocity remained positive. Overall result (Fig. 4) for vertical velocity shows that there has been an insignificant increase in the velocity. The change in temperature in these aspect ratios was also insignificant.
VERTICAL VELOCITY SPATIAL ISOTHERMS
VERTICAL VELOCITY SPATIAL ISOTHERMS
FIG. 5(A). ASPECT RATIO 2.0 / STREET CANYON WIDTH 0.5 METER
VERTICAL VELOCITY SPATIAL ISOTHERMS
VERTICAL VELOCITY SPATIAL ISOTHERMS
VERTICAL VELOCITY SPATIAL ISOTHERMS
FIG. 5(C). ASPECT RATIO 1.0/STREET CANYON WIDTH 1.0 METER
FIG. 5(D). ASPECT RATIO 0.8/STREET CANYON WIDTH 1.25 METERS
VERTICAL VELOCITY SPATIAL ISOTHERMS
VERTICAL VELOCITY SPATIAL ISOTHERMS
VERTICAL VELOCITY SPATIAL ISOTHERMS
FIG. 5(F). ASPECT RATIO 0.57/STREET CANYON WIDTH 1.75 METER
FIG. 5(G). ASPECT RATIO 0.5/STREET CANYON WIDTH 2.0 METER
5.
CONCLUSIONS
Effects of AR are explored in this paper through simulations of heating within street canyon. The adopted model was validated and applied to varying aspect ratios to evaluate the impact of wider street canyons. Results demonstrated strong correlation (i.e. correlation of determination, R2>0.9) between building AR and temperature within street canyon. Notably, the impact of vertical velocity component was higher than that of horizontal velocity component. The vertical velocity increases along the leeward and windward walls from AR 2.0-0.66 while temperatures are decreased. A comparison shows that vertical velocity in aspect ratios from 0.4-0.57 reduces along the windward and leeward walls although the velocity remained positive. The overall results reveals that there has been an insignificant increase in the vertical velocity. In lower aspect ratios the centre and windward wall of the street canyon remained at low temperature offering thermal comfort to pedestrians and low cooling energy demand for building occupants. The city planners, HVAC Engineers and environmentalists may benefit from the results of this paper.
6.
NOMENCLATURE
AR Aspect Ratio
H Street canyon height (m) W Street canyon width (m)
X/W Spatial coordinate in horizontal direction divided with street canyon width
ua Horizontal inflow wind speed (ms-1)
θg Ground level temperature (K) υ Kinematic viscosity (m2/s) p Fluid pressure (Pascal)
u, v, w Velocity components in X, Y and Z directions (m/s)
Z/H Spatial coordinate in Z direction non-dimensionalized by street canyon height θa Ambient air-temperature (K)
Δθs-a Difference between the surface and ambient air-temperature (K)
υθ Kinematic diffusivity (m2/s)
ReH Reynolds number (based on street canyon height) = uaH/ν
ACKNOWLEDGEMENTS
The authors are grateful to Mehran University of Engineering & Technology, Jamshoro, Pakistan, for providing necessary help and facility to conduct this work. Additionally, the first author is thankful to the University of Hong Kong, Hong Kong, for providing necessary funding and support to carry out part of simulation work.
REFERENCES
[1] Hafner, J., and Kidder, S.Q., “Urban Heat Island Modeling in Conjunction with Satellite-Derived Surface/Soil Parameters", Journal of Applied Meteorology, Volume 38, pp. 448-465, 1999.
[2] Konopacki, S., and Akbari, H., "Energy Savings for Heat Island Reduction Strategies in Chicago and Houston (including updates for Baton Rouge, Sacramento, and Salt Lake City)", Draft Final Report, LBNL-49638, University of California, Berkeley, 2002.
VERTICAL VELOCITY SPATIAL ISOTHERMS
FIG. 5(I). ASPECT RATIO 0.4/STREET CANYON WIDTH 2.5 METER
[3] Rosenfeld, A.H., Akbari, H., Romm, J.J., and Pomerantz, M., "Cool Communities: Strategies for Heat Island Mitigation and Smog Reduction", Energy and Buildings, Volume 28, pp. 51-62, 1998.
[4] Changnon, S.A., Kunkel, K.E., and Reinke, B.C., "Impacts and Responses to the 1995 Heat Wave: A Call to Action", Bulletin of the American Meteorological Society, Volume 77, pp. 1497-505, 1996.
[5] Memon, R.A., Leung, D.Y.C., and Liu, C.H., "A Review on the Generation, Determination and Mitigation of Urban Heat Island", Journal of Environmental Sciences, Volume 20, pp. 120-128, 2008.
[6] Memon, R.A., Leung, D.Y.C., and Liu, C.H., "Effects of Building Aspect Ratio and Wind Speed on Air-Temperatures in Urban-Like Street Canyons", Building and Environment, Volume 45, pp. 176-188, 2010. [7] Xie, X., Liu, C.H., Leung, D.Y.C., and Leung, M.K.H.,
"Impact of Building Facades and Ground Heating on Wind Flow and Pollutant Transport in Street Canyons", Atmospheric Environment, Volume 41, pp. 9030-9049, 2007.
[8] Xie, X., Huang, Z., Wang, J.S., and Xie, Z., "The Impact of Solar Radiation and Street Layout on Pollutant Dispersion in Street Canyon", Building and Environment, Volume 40, pp. 201-212, 2005.
[9] Xie, X., Liu, C.H., Leung, D.Y.C., and Leung, M.K.H., "Characteristics of Air Exchange in a Street Canyon with Ground Heating", Atmospheric Environment, Volume 40, pp. 6396-6409, 2006.
[10] Memon, R.A., Chirarattananon, S., and Vangtook, P., "Thermal Comfort Assessment and Application of Radiant Cooling: A Case Study", Building and Environment 43, pp. 1185-1196, 2008.
[11] Giridharan, R., Ganesan, S., and Lau, S.S.Y., "Daytime Urban Heat Island Effect in High-Rise and High-Density Residential Developments in Hong Kong", Energy and Buildings, Volume 36, pp. 525-534, 2004.
[12] Hung, T., Uchihama, D., Ochi, S., and Yasuoka, Y., "Assessment with Satellite Data of the Urban Heat Island Effects in Asian Mega Cities", International Journal of Applied Earth Observation and Geo-Information, Volume 8, pp. 34-48, 2006.
[13] Jauregui, E., "Heat Island Development in Mexico City", Atmospheric Environment, Volume 31, pp. 3821-3831, 1997.
[14] Klysik, K., and Fortuniak, K., "Temporal and Spatial Characteristics of the Urban Heat Island of Lodz, Poland", Atmospheric Environment, Volume 33, pp. 3885-3895, 1999.
[15] Kim, J.J., and Baik, J.J., "Spatial and Temporal Structure of the Urban Heat Island in Seoul", Journal of Applied Meteorology, Volume 44, pp. 591-605, 2005. [16] Lemonsu, A., and Masson, V., "Simulation of a Summer
Urban Breeze Over Paris", Boundary Layer Meteorology, Volume 104, pp. 463-490, 2002.
[17] Magee, N., Curtis, J., and Wendler, G., "The Urban Heat Island Effect at Fairbanks, Alaska", Theoretical and Applied Climatology, Volume 64, pp. 39-47, 1999.
[18] Pongracz, R., Bartholy, J., and Dezso, Z., "Remotely Sensed Thermal Information Applied to Urban Climate Analysis", Advances in Space Research, Volume 37, No. 12, pp. 2191-2196, 2005.
[19] Saitoh, T.S., Shimada, T., and Hoshi, H., “Modeling and Simulation of the Tokyo Urban Heat Island”, Atmospheric Environment Volume 30, pp. 3431-3442, 1995.
[20] Dupont, S., Otte, T., and Ching, J.K.S., "Simulation of Meteorological Fields within and Above Urban and Rural Canopies with a Mesoscale Model (MM5)", Boundary Layer Meteorology, Volume 113, pp. 111-158, 2004. [21] Yamda, T., "Building and Terrain Effects in a Mesoscale
Model”, 11th Conference on Air Pollution Meteorology, Long Beach California, pp. 215-220, New Mexico, 9-14 January, 2000.
[22] Takahashi, K., Yoshida, H., Tanaka, Y., Aotake, N., and Wang, F., "Measurement of Thermal Environment in Kyoto City and Its Prediction by CFD Simulation", Energy and Buildings, Volume 36, pp. 771-779, 2004. [23] Kato, S., and Yamaguchi, Y., "Analysis of Urban Heat
Island Effect Using ASTER and ETM + Data: Separation of Anthropogenic Heat Discharge and Natural Heat Radiation from Sensible Heat Flux", Remote Sensing of Environment, Volume 99, pp. 45-54, 2005.
[24] Ashie, Y., Thanh, V.C., and Asaeda, T., "Building Canopy Model for the Analysis of Urban Climate", Journal of Wind Engineering and Industrial Aerodynamics, Volume 81, pp. 237-248, 1999.
[25] Atkinson, B.W., "Numerical Modeling of Urban Heat Island Intensity”, Boundary Layer Meteorology, Volume 109, pp. 285-310, 2003.
[26] Arnfield, A.J., and Grimmond C.S.B., "An Urban Canyon Energy Budget Model and its Application to Urban Storage Heat Flux Modeling", Energy and Buildings, Volume 27, pp. 61-68, 1998.
[27] Fluent User Guide Version 6.2.1, 2005.
[28] Uehara, K., Murakami, S., Oikawa, S., and Wakamatsu, S., "Wind Tunnel Experiments on How Thermal Stratification Affects Flow in and Above Urban Street Canyons", Atmospheric Environment, Volume 34, pp. 1553-1562, 2000.
[29] Memon, R.A., Tunio, A.H., and Kanya, L., "Impact of Aspect Ratio and Solar Heating on Street Canyon Air Temperatures", Mehran University Research Journal of Engineering and Technology, Volume 30, No. 1, Jamshoro, Pakistan, January, 2010.
[30] Masson, V., "A Physically Based Scheme for the Urban Energy Budget in Atmospheric Models", Boundary Layer Meteorology, Volume 94, pp. 357-397, 2000. [31] Masson, V., Grimmond, C.S.B., and Oke, T.R.,