www.clim-past.net/10/623/2014/ doi:10.5194/cp-10-623-2014
© Author(s) 2014. CC Attribution 3.0 License.
Climate
of the Past
Magnetostratigraphy of sediments from Lake El’gygytgyn
ICDP Site 5011-1: paleomagnetic age constraints for the longest
paleoclimate record from the continental Arctic
E. M. Haltia1,*and N. R. Nowaczyk1
1Helmholtz Centre Potsdam, GFZ German Research Centre for Geosciences, Section 5.2, Climate Dynamics and Landscape
Evolution, Telegrafenberg, 14473 Potsdam, Germany
*now at: University of Turku, Department of Geography and Geology, Section of Geology, 20014 Turku, Finland
Correspondence to: E. M. Haltia (eeva.haltia@utu.fi)
Received: 31 July 2013 – Published in Clim. Past Discuss.: 3 September 2013 Revised: 17 January 2014 – Accepted: 5 February 2014 – Published: 26 March 2014
Abstract. Paleomagnetic measurements were performed on sediments drilled from ICDP Site 5011-1 in Lake El’gygytgyn (67◦30′N, 172◦05′E) located in Far East Rus-sian Arctic. The lake partly fills a crater formed by a mete-orite impact 3.58±0.04 Ma ago. Sediments from three paral-lel cores (5011-1A, 5011-1B and 5011-1C), recovered from the middle part of the lake, yield a total of 355 m of sed-iment. Sediments are characterized by a variable lithology, where intervals of homogenous and laminated sediments al-ternate, and mass movement deposits occur frequently along the sediment profile. Mineral magnetic investigation made on sediments enclosed in core catchers suggests that mag-netic carrier in these sediments is partly maghemitized Ti-rich pseudo-single domain magnetite. Its detrital origin can be shown by mineral magnetic measurements and SEM-EDS analyses performed on mini-sized cylindrical rock samples, polished rock sections and creek sediments. The intensity of the natural remanent magnetization in the sediments is high with a range from about 1 to 1000 mA m−1. Most of the sediments carry a stable magnetization interpreted as primary depositional remanent magnetization. Characteris-tic inclination data show alternating intervals of steep pos-itive and negative inclinations that are used to assign mag-netic polarity to the lake sediment profile. This is a rather straightforward procedure owing to the mainly high qual-ity of data. The Matuyama/Gauss (M/G) (2.608 Ma) and Brunhes/Matuyama (B/M) (0.780 Ma) reversals were recog-nized in the sediments. The Mammoth and Kaena reversed subchrons were identified during the Gauss chron, and the
Olduvai and Jaramillo normal subchrons as well as the Réu-nion and Cobb Mountain cryptochrons were identified dur-ing the Matuyama chron. Sediments also provide a record of the Olduvai precursor and Intra-Jaramillo geomagnetic excursions. Sediment deposition rate is highest at the base of the sequence laid down in the early Gauss chron, when the deposition rate is approximately 44 cm kyr−1. Sediment deposition decelerates upcore and it is an order of magni-tude lower during the Brunhes chron in comparison with the early Gauss chron. Decrease in sediment deposition in the late Pliocene probably relates to atmospheric and oceanic reorganization heralding the onset of Quaternary climate change. The high-quality magnetostratigraphy reconstructed from Lake El’gygytgyn sediments provides 12 first-order tie points to pin down the age of the longest paleoclimate record from the continental Arctic.
1 Introduction
and continuous climate record from an Arctic continental site is crucially important in an attempt to reconstruct the charac-ter and timing of climatic variability and its environmental response during the Quaternary, or even longer back in time. This would also enable the establishment of climatic tele-connections between records from different archives, such as lacustrine and marine sediments, ice cores, or loess, and add to a more comprehensive understanding of the functioning of the climatic system (Katz et al., 2011).
A pilot study of sediment core PG1351 recovered in 1998 from Lake El’gygytgyn, which occupies a meteorite impact crater in the Far East Russian Arctic, revealed a continu-ous record of paleoenvironmental variability responding to orbitally driven summer insolation during the last 250 kyr (Brigham-Grette et al., 2007; Nowaczyk et al., 2007). Infer-ring from geomorphological analysis of end moraines de-posited by valley glaciers and associated cosmogenic iso-tope dating, Far East Russia has not been covered by an ice sheet at least since the Middle Pleistocene (Brigham-Grette et al., 2003). This renders the lake an attractive tar-get for drilling a unique and temporally longest continental sediment sequence from the Arctic. With this objective in mind, deep drilling in Lake El’gygytgyn was executed within the framework of the ICDP (International Continental Scien-tific Drilling Project) Lake El’gygytgyn Drilling Project in the spring of 2009 (Melles et al., 2011). The significance of this unique and continuous paleoclimatic record, which extends into the mid-Pliocene, is summarized by Melles et al. (2012) and Brigham-Grette et al. (2013). Developing an accurate sediment chronology is of key importance in un-locking the climatic record preserved in the sediments from El’gygytgyn. The capability of remanence-carrying iron ox-ides in sediments and rocks to record geomagnetic polarity variations enables their dating by matching the reconstructed magnetostratigraphic variations with respect to geomagnetic polarity timescales (e.g., Cande and Kent, 1995; Opdyke and Channell, 1996). This paper presents magnetostratigraphic results from this unique Arctic lake, which forms the prin-cipal chronological framework for the sediments recovered during the deep drilling of Lake El’gygytgyn. In order to ob-tain information about the carrier of the paleomagnetic signal and its origin in these sediments, mineral magnetic properties of lake sediments and rock samples and sediments from the catchment were investigated.
2 Site description
Lake El’gygytgyn (67◦30′N, 172◦05′E; 492 m a.s.l. – meters above sea level) is a crater lake located in the mountainous central Chukotka Peninsula in the Far East Russian Arctic. According to the most recent results from 40Ar/39Ar dat-ing, the 18 km-wide crater was formed as a result of a mete-orite impact into a mid-Cretaceous silicious volcanic rock se-ries in the middle Pliocene at 3.58±0.04 Ma (Layer, 2000).
Dominant rock types include rhyolitic and dacitic tuffs, ign-imbrites and lavas, and to a lesser extent, andesitic tuffs and lavas, which are overlain by basalts in the northeastern part of the crater rim (Gurov and Koeberl, 2004). The lake basin is bowl-shaped with steep flanks and a flat bottom, enclos-ing a lake with a diameter of 12 km, surface area of 110 km2 and maximum depth of 175 m. The catchment (293 km2) is small in relation to the lake surface area and, during sum-mertime, its permafrost soils are drained by ca. 50 ephemeral creeks radially directed with respect to the lake (Fig. 1). The lake has one outlet, the Enmyvaam River, which has cut its way through the crater rim in the southeast and drains into the Bering Sea. Based on the interpretation of refraction- and reflection-seismic data, the layered sediment infill was esti-mated to have a thickness of 320 to 340 m (Gebhardt et al., 2006, 2013). This was confirmed by the ICDP drilling, in-tersecting the transition zone from sediments to impact brec-cia at a depth of around 316 m. Currently, the lake is olig-otrophic and monomictic, and the water column becomes thermally stratified under the ice cover, which persists from October to mid-July. The lake becomes thoroughly mixed by strong winds during the intervening ice-free months (Nolan and Brigham-Grette, 2007). Climate in the Arctic Chukotka Peninsula is continental and according to weather data col-lected in 2002 the annual mean temperature was−10.3◦C, with annual extreme values ranging from −40 to +26◦C (Nolan and Brigham-Grette, 2007). The sparse vegetation in the area is tundra dominated by herbs and low shrubs (Lozhkin et al., 2007).
3 Material and methods
3.1 Lake drilling and sediment core handling
As a result of a long-standing planning and international cooperation, sediments and underlying impact breccia were cored within the frame of the ICDP Lake El’gygytgyn Drilling Project from October 2008 to May 2009. Drilling operations and on-site processing of cores are documented in detail by Melles et al. (2011) and here they are only briefly reviewed. Coring was undertaken from an ice platform us-ing the Russian GLAD800 drill rig operated by a US consor-tium, Drilling, Observation and Sampling of the Earth’s Con-tinental Crust Inc. (DOSECC). Sediment cores were drilled from ICDP Site 5011-1 in the flat middle part of the lake (67◦29.98′N, 172◦6.23′E) from three parallel holes,
E nm
yv aam
R iv er
171o
90' 172o
00' 172o
10' 172o
20' 67o
32'
67o
28'
67o
24'
Rock sampling area
Water divide
ICDP coring site 5011-1
160 120 80 40
5 km
Lake El'gygytgyn
160 Bathymetric lines
Lagerny cre ek
El'gygytgyn impact crater
180° 90°E
60°N
30°N
90°W
a)
b)
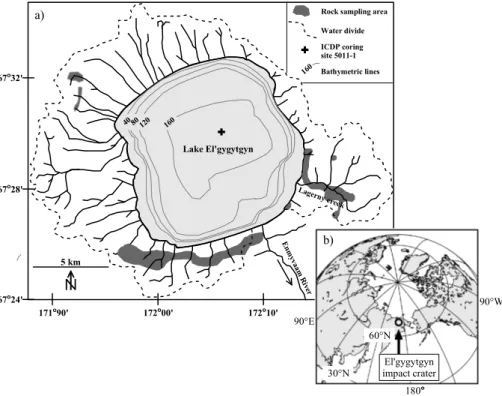
Fig. 1. Schematic map of Lake El’gygytgyn and its catchment (a) and the position of Lake El’gygytgyn in a global context (b). Largest
creeks are marked on the map by thick solid lines. The location of ICDP Site 5011-1, in the flat central part of the bowl-shaped lake floor, is marked by a cross. The rim of the impact crater mostly follows the border of the lake’s catchment (dashed line).
in core 1C were hampered by incomplete sediment recovery (Table 1), which may be related to coarse sediment intervals encountered at this part of the sequence and/or the coring tool employed (Melles et al., 2011).
In the laboratory, sediment sections enclosed in liners were cut lengthwise with a circulating saw and subsequently the sediment was split into two halves (i.e., a working half and an archive half) using a nylon string. The consolidated sed-iments in the bottommost sections recovered from hole 1C were cut lengthwise in half with a circular saw. After open-ing, a lithological description of the sediments was made and they were subjected to various non-destructive optical, magnetic, geochemical and physical analyses (Melles et al., 2011). Sediments were sub-sampled according to a prede-fined scheme with consistent aliquots for different types of analyses. A composite sediment record was reconstructed during core processing and sub-sampling of sediments from cores 1A, 1B and 1C, which included, among other things, identification of more than 300 mass movement deposits and their exclusion from the final paleoclimate record (Sauerbrey et al., 2013; Wennrich et al., 2013; Nowaczyk et al., 2013).
3.2 Paleomagnetic sampling and measurements
The majority of paleomagnetic measurements were made on working halves of sediment sections sampled in u-channels, 2×2 cm in cross section, either 110 or 75 cm in length,
Table 1. Information on drilling of sediments from cores 1A, 1B
and 1C from ICDP Site 5011-1 in Lake El’gygytgyn. In core 1C sediments were first recoved from 42 to 50 m (shown in brackets) to patch up gaps in sediment recovery in cores 1A and 1B. After that drilling was continued at a depth of 100.0 m.
Drilling of lake sediments on ICDP Site 5011-1
Core Start End Drilled Recovered Recovery
(m) (m) (m) (m) (%)
5011-1A 2.9 146,6 143.7 132.0 92
5011-1B 3.5 111.9 108.4 106.6 98
5011-1C (42.0) 100.0 (51.0) 316.3 225.3 116.1 52
increasing sediment stiffness downcore hampered sampling in u-channels. Moreover, discrete sampling allowed targeting sampling to undisturbed clayey and silty sediments, which have more potential to yield reliable paleomagnetic data than coarser-grained sediments encountered in core 1C. When-ever possible, discrete samples were taken in steps of 10 cm. However, the actual sampling spacing is 12.6 cm, because sand layers and disturbed sediment sections were avoided. Sampling was continued until 311 m. From this depth down-wards until 316 m sediment are highly consolidated gravel and pebbles in a sandy matrix and cutting paleomagnetic samples without disturbing the sediment was not possible. Then again, the sediment was too brittle to be sampled using a rotating diamond drill bit. Therefore, a non-standard sam-pling technique was applied in order to obtain half-oriented samples with a known vertical orientation but unknown az-imuth. In general, the half-cylindrical sediment columns of the archive halves were broken into segments (biscuits) of varying thickness by the coring process. The archive halves were placed directly next to the sample holder of the long-core magnetometer. Then, suitable sediment segments (discs) were individually taken out of the liner for sub-sampling, and a non-magnetic saw blade was used to cut off approximately triangular, partly irregular pieces. The resulting samples, ap-proximately 5 to 8 cm3in volume, were placed directly in the magnetometer’s sample holder in order to avoid misorienta-tion. The employed sample holder has been designed to take up eight cylindrical samples of 10 cm3that can be fixed by a plastic spring in order to avoid movement or rotation of the samples during measurements. Because the sediment pieces were fairly crumbly they were fitted back into the archive halves directly after measurement of the magnetization and no further magnetic investigation was performed on them.
Natural remanent magnetization (NRM) was measured from all the paleomagnetic samples with a 2G Enterprises 755-SRM cryogenic long-core magnetometer at the Labora-tory for Paleo- and Rock Magnetism in Potsdam, Germany. The NRM was progressively demagnetized in ten steps (5, 10, 15, 20, 30, 40, 50, 65, 80 and 100 mT) with the mag-netometer’s inline three-axis demagnetizer and the remain-ing NRM was measured after each demagnetization step. The direction of the characteristic remanent magnetization (ChRM), i.e., the magnetization component interpreted as carrying primary and supposedly syn-depositional informa-tion was isolated using the progressively demagnetized NRM data from five to seven successive AF demagnetization steps picked by the eye using principal component analysis. A measure of precision of fitting the NRM demagnetization data to a line in principal component analysis can be ex-pressed by maximum angular deviation (MAD) (Kirschvink, 1980). MAD angles≤5◦ are interpreted as characterizing samples where a single component magnetization has been isolated. The magnetometer’s pick-up coils average data over about 9.5 cm. Thus, in order to eliminate spurious results due to edge effects, data collected along the upper and lower 4 cm
of a u-channel were excluded from the final paleomagnetic data.
Unless otherwise stated, ages for the polarity transitions are derived from LR04, which is a benthic foraminiferal oxy-gen isotope (δ18O) stack with a global distribution of the con-stituting data (Lisiecki and Raymo, 2005). LR04 is employed here, because the chronological framework provided by mag-netic polarity reversals is further refined by tuning of dif-ferent sedimentary paleoclimate proxies sensitive to climatic and insolation variations in orbital timescales with respect to (1) the LR04 stack or (2) Northern Hemisphere summer in-solation (Laskar et al., 2004) as a reference curve (Nowaczyk et al., 2013).
3.3 Mineral magnetic measurements on catchment rocks, creek sediments and lake sediments
Table 2. Information on magnetic parameters used to characterize mineral magnetic assemblages in catchment rocks, creek sediments and
lake sediments from Lake El’gygytgyn and its catchment. CR = catchment rocks, CS = creek sediments and LS = lake sediments.
Parameter Instrument Unit Explanation Notes
Magnetic measurements
Low-field volumetric Kappabridge MFK1-A Unitless Used for estimation of concentration of magnetic minerals in Measured from CR, CS magnetic susceptibility (AGICO) uniform magnetic mineralogy. As an in-field parameter,κlfmay and LS
κlf(SI,×10−6) be increased by paramagnetic minerals and superparamagnetic
grains, which do not carry remanence. Essentially independent of magnetite grain size.
Isothermal remanent Either (1) for imprinting A m−1 Magnitude of standalone IRM measurements relates to magnetite CR and LS: aIRM magnetization, IRM the desired field: Impulse concentration and inversely to magnetite grain size. Observations measurements
magnetizer (2G model 660) of IRM of samples exposed to incrementally higher fields performed using option and for the measuring of the (acquisition of IRM, i.e., aIRM) bring forth information on magnetic (1) with peak field 2500 remanence: Minispin mineralogy as a function of coercivity. Conventionally saturation mT and back field 200 spinner magnetometer IRM (SIRM) designates the IRM produced in the highest field mT
(Molspin Ltd.) or (2) adopted (1–2.5 Teslas). Magnitude of IRM is inversely dependent For CS: aIRM Alternating field on magnetite grain size. Measurement of a remanence induced in a measurements were magnetometer MicroMag reversed direction after peak field (usually 10–20 % from peak field performed using option 2900 (Princeton strength) allows estimation of the easiness of remagnetization, which (2) with peak field 2000 Measurements Corp.) is interpreted in terms of magnetic mineralogy or grain size. mT and back field 300
mT.
Parameters related to determination of magnetic grain size
– Saturation magnetization Alternating field A m−1 M
sis an in-field measure and describes magnetization in a Measured only from CS Ms magnetometer Micromag saturating field.Msris the remanence left after switching off the and LS
– Saturation remanent 2900 field.Bcis an in-field measure and it states the field strength
magnetizationMsr required to bring magnetization to zero after saturation. In
– Coercive fieldBc particular,Bcreflects magnetite grain size. Measurement of a
hysteresis loop allows the determination ofMs,MsrandBc.
– Coercivity of Alternating field mT Bcrexpresses the magnetic field strength required to demagnetize Measured only from CS remanenceBcr magnetometer Micromag Msrto zero remanence.Bcrreflects both magnetic mineralogy and LS
2900 and grain size.
Interparametric ratios
SIRM/κlf kA m−1 Sensitive to magnetic grain size in magnetite. Values vary CR, CS and LS
inversely with magnetic grain size. As essentially a concentration dependent parameter,κlfis used for normalizing the concentration dependence of SIRM, leaving out information on grain size.
Sratio Unitless Ratio between two IRM measurements. Calculated here as CR, CS and LS
0.5×[1−(IRM@highest field/IRM@back-field)]. Allows estimation of the easiness of remagnetization, which relates to magnetic
mineralogy. Commonly interpreted as the ratio between magnetite and hematite in a sample, where value 1 (0) designates the only magnetic mineral present is magnetite (hematite).
Ms/Msr Unitless The ratioMs/Msris inversely related to magnetite grain size. This CS and LS
ratio is used as a part of a Day plot to characterize the magnetite domain state.
Bc/Bcr Unitless The ratioBc/Bcris directly proportional to magnetite grain size. CS and LS
This ratio is used as a part of a Day plot to characterize the magnetite domain state.
Therefore investigation of the core catcher samples from Site 5011-1 offers a possibility to acquire mineral magnetic information in low resolution throughout the 315 m-long se-quence. One sample was taken from each core catcher sedi-ment sample by pressing a paleomagnetic sample box (vol-ume 6 cm3) into the upper surface of the sediment block. Selected magnetic parameters were determined in order to estimate the concentration, mineralogy and magnetic grain size range of magnetic minerals in these samples (n= 122). These parameters, which include low-field volume magnetic susceptibility (κlf, SI×10−6), isothermal remanent
magne-tization (IRM) with different applied field strengths and magnetic hysteresis parameters (Ms, Mrs,Bc andBcr), are
3.4 Mineral magnetic measurements on catchment rocks and creek sediments
Besides the lacustrine sediments, catchment rocks and sed-iments collected from creeks, which drain the catchment, were investigated in order to collect information on the source and origin of magnetic minerals in the sediments de-posited in Lake El’gygytgyn. Rock samples were collected from the catchment during an expedition to the lake in spring 2003 (Melles et al., 2005). These samples were available for screening of mineral magnetic properties of the source rocks. Distribution of the analyzed rock samples within the catch-ment is not uniform, but approximately two thirds of the col-lected rock samples are from the area extending from east to southwest of the lake, and the remaining third originates from an area northwest of the lake (Fig. 1). The uneven dis-tribution of collected samples, which results from the lack of suitable outcrops, introduces a spatial bias, but preliminary apprehension of the magnetic properties of the catchment rocks, appropriate for the purposes of this study, is acquired. Part of the rock samples (n= 23) were taken as oriented hand samples directly from available bedrock outcrops, whereas most of the samples were collected from periglacial collu-vium (n= 58) from the base of slopes surrounding the lake. Where necessary, these two sample types are jointly referred to as catchment rock samples. Cylinder-shaped mini-sized specimens (n= 80; mean diameter 12 mm, volume 2.0 cm3)
were drilled from the catchment rock samples. Low-field magnetic volume susceptibility, acquisition of isothermal re-manent magnetization (IRM) and S ratio were measured from the catchment rocks in a fashion identical to lake sed-iment samples (Table 2). Magnetic hysteresis measurements were not performed on catchment rock samples. Bulk sedi-ment samples from bedload of creeks and shallow lagoons, blocked by coarse sand bars in the mouth of creeks, were col-lected during the same expedition as the catchment rocks in 2003. From now on, these sediments are jointly referred here to as creek sediments. Creek sediments from 32 sites, dis-tributed evenly across the lake circumference, were packed tightly into paleomagnetic sample boxes (6 cm3) and stabi-lized by epoxy resin for measurements of mineral magnetic properties. In Table 2 more information is provided on mag-netic measurements performed on creek sediments.
3.5 SEM-EDS analysis of magnetic separates from creek sediments
In order to investigate mineralogy and visual characteristics of magnetic grains in more detail, magnetic minerals were investigated from polished rock sections and magnetic sep-arates extracted from creek sediments. Magnetic minerals were manually separated from selected air-dried creek sed-iment samples using a rare earth magnet. Sub-samples taken from these magnetic separates were mounted on a standard SEM stubs and sputtered with carbon for inspection with a
0.1 1 10 100 Core 1A
150 140 130 120 110 100 90 80 70 60 50 40 30 20 10 0
D
ep
th
b
el
ow
lak
e
fl
oo
r
(m
)
0.1 1 10 100
Core 1B
ICDP Site 5011-1 NRM (mA m-1)
1 10 100 1000 Core 1C
350 300 250 200 150 100
D
ep
th
b
el
o
w
la
k
e
fl
oo
r
(m
)
Fig. 2. Down-core variations in the intensity of the natural remanent
magnetization (NRM) in cores 1A, 1B and 1C. Note the different scaling in 1C.
scanning electron microscopy (SEM), equipped with an en-ergy dispersive X-ray spectroscopy facility (EDS), using a Zeiss Ultra 55 Plus microscope. The instrument permits ele-mental analyses of the separated magnetic minerals and de-tailed observation of grain morphology. Magnetic minerals present in rocks were investigated from polished sections (n= 19, thickness 0.5 mm), which were prepared from the mini-sized specimens. The polished sections were mounted on glass slides, coated with carbon and analyzed with the SEM-EDS.
4 Results and interpretation
4.1 Polarity stratigraphy from cores 1A and 1B
E,E N
down
E,E up
S
E,E up
S
E,E
S up
E,E N
down
do N
W,E
0
25
0
-10 -40
0
-50
0
150 0
Brunhes chron
Matuyama chron
upper lower
Gauss chron
Kaena subchron
Gauss chron lowermost
5011-1A 23.09 m
5011-1A 38.94 m
5011-1A 92.86 m
5011-1C 117.20 m
5011-1C 319.54 m
5011-1C 319.65 m
0
0
a) b) c) d) e) f)
Fig. 3. Representative vector endpoint diagrams obtained from progressive alternating field demagnetization of natural remanent
magnetiza-tion of sediments from cores 1A (a–c) and 1C (d–f) from Lake El’gygytgyn. Samples show high direcmagnetiza-tional stability. Solid (open) diamonds indicate projection to the horizontal (vertical) plane. Axes are individually scaled from graph to graph with units in mA m−1.
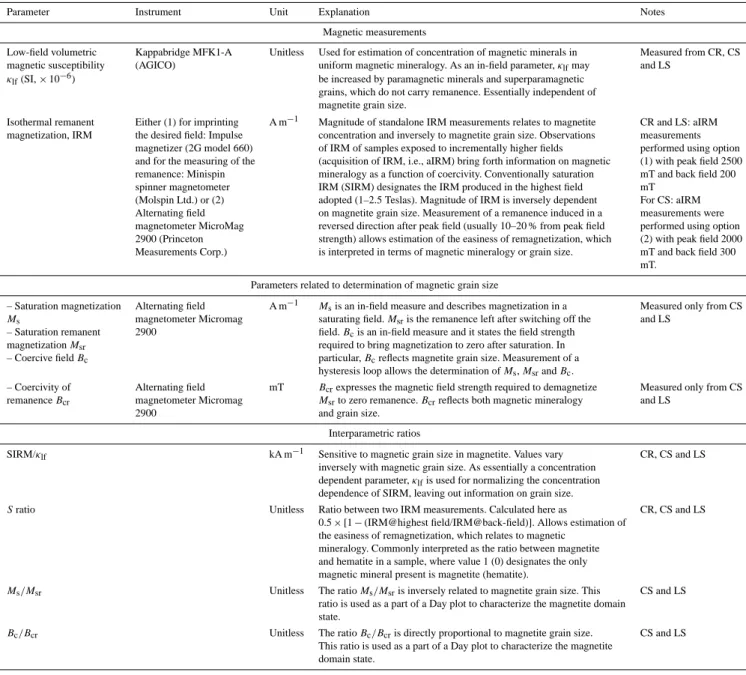
most often applied in the determination of ChRM was that from 15 to 65 mT. The magnetization is mainly carried by magnetic minerals with a low coercivity, and usually≤5 % of the NRM remains after completion of the AF magnetic cleaning at 100 mT (Fig. 4). However, in a few cases, con-tribution from high-coercivity mineral(s) was evident, with 50 % of the NRM remaining after applying the peak demag-netizing field. In most cases the MAD angle is<5◦, which indicates that a well-defined magnetization vector was iso-lated during principal component analysis. Larger MAD an-gles are usually found in samples, which show weak mag-netization. These are generally associated with polarity tran-sitions. Few samples, which show multiple components of magnetization, are characterized by weak NRM intensity and significant contribution of magnetically harder miner-als. Only the inclination of the ChRM will be used to deter-mine magnetic polarity, because the sediment sections were oriented with respect to theirzaxis, but the azimuth angle is unknown. Inspection of ChRM inclination records from cores 1A and 1B revealed similar patterns of sediment in-tervals, which have mostly steep inclination with either nor-mal or reversed polarity (Figs. 5 and 6), and nornor-mal polar-ity inclinations oscillate around the expected axial dipole in-clination value of 78.3◦for the site. The reconstructed pat-terns of ChRM inclination from cores 1A and 1B can be readily correlated with the established pattern of magnetic field reversals during the last 2.6 Myr (Ogg and Smith, 2004), and polarity reversals in cores 1A and 1B, proceeding from
0
20
40
60
80
100
mT
0
0.2
0.4
0.6
0.8
1
M
/M
m
a
x
1A, 23.09 m 1A, 38.94 m 1A, 92.86 m 1C, 117.20 m 1C, 319.54 m 1C, 319.65 m
Fig. 4. Curves of normalized NRM intensity versus peak alternating
field demagnetization steps from 0 to 100 mT. Samples are the same as in Fig. 3. Smoothly reducing remanence is indicative of low-coercivity magnetic components dominating the remanence in these samples.
-90°-60°-30° 0° 30° 60° 90° ChRM Inclination
150 140 130 120 110 100 90 80 70 60 50 40 30 20 10 0
D
ep
th
b
el
o
w
la
k
e
fl
o
o
r
(m
)
0° 10° 20° 30° 40°
Maximum angular deviation
ICDP Site 5011-1 Core 1A
3 2.8 2.6 2.4 2.2 2 1.8 1.6 1.4 1.2 1 0.8 0.6 0.4 0.2 0
T
im
e
(M
y
r)
Polarity time scale
B/M
Jaramillo
Cobb Mtn.
Olduvai
Réunion Polarity
chron
M/G
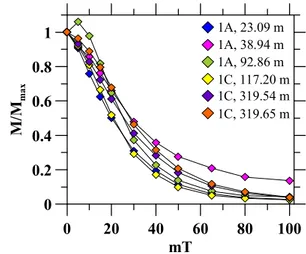
Fig. 5. Down-core variations in the inclinations of the characteristic remanent magnetization (ChRM) and maximum angular deviation
(MAD) from core 1A. Dashed lines denote correlation of the ChRM inclination with the polarity timescale.
75 to 84 m, and they are interpreted as the Jaramillo subchron (1.075 to 0.991 Ma) and the Olduvai subchron (from 1.968 to 1.781 Ma), respectively. The sediments from the early Oldu-vai were recovered only in core 1B and characterized by a scattered ChRM inclination pattern. Here data are partly am-biguous because of folding structures in the sediment strata, which renders polarity reconstruction complex in this part of the sediment sequence. Unfortunately, a core break oc-curs at 122 m in core 1A as polarity shifts from normal to reversed. This depth approximates the M/G reversal, which occurred at 2.608 Ma. In some sediment sections, such as in a notable example from 70 to 72 m in core 1A, ChRM in-clinations are shallow and without a counterpart in the par-allel core. These represent either sediment disturbances such as folding structures where paleomagnetic direction does not
reflect primary orientation, or coarse-grained bases of mass movement deposits, where paleomagnetic direction can be poorly recorded. These are not taken as reflections of past geomagnetic field configurations.
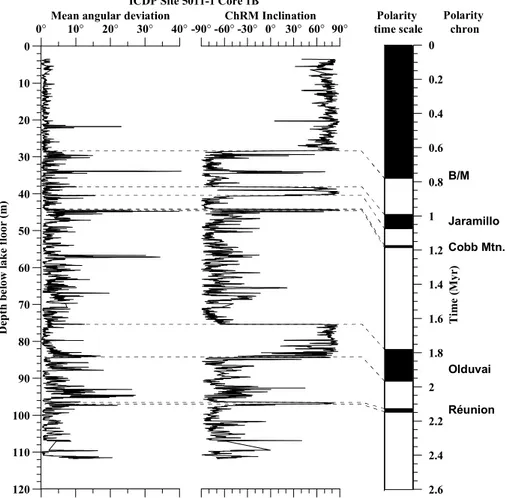
120 110 100 90 80 70 60 50 40 30 20 10 0
D
ep
th
b
e
lo
w
la
k
e
fl
o
o
r
(m
)
-90°-60°-30° 0° 30° 60° 90°
ChRM Inclination 0° 10° 20° 30° 40°
Mean angular deviation
ICDP Site 5011-1 Core 1B
2.6 2.4 2.2 2 1.8 1.6 1.4 1.2 1 0.8 0.6 0.4 0.2 0
T
im
e
(M
y
r)
Polarity time scale
Polarity chron
B/M
Jaramillo
Cobb Mtn.
Olduvai
Réunion
Fig. 6. Down-core variations in the inclinations of the characteristic remanent magnetization (ChRM) and maximum angular deviation
(MAD) from core 1B. Dashed lines denote correlation of the ChRM inclination with the polarity timescale.
has been suggested to represent a short global geomagnetic event (Pillans et al., 1994; Channell and Kleiven, 2000; Guo et al., 2002). Another possible short geomagnetic event is de-tected at the depth of∼85 m in both cores, with a “flip” to full normal polarity just before the onset of the Olduvai sub-chron, which may represent the Olduvai precursor (Channell et al., 2003). As a result of astronomical tuning of different paleoenvironmental proxies, Nowaczyk et al. (2013) provide ages for the onset and termination of these short-lived ge-omagnetic features. The Intra-Jaramillo excursion occurred from 1.0192 to 1.0142 Ma and is therefore placed in MIS (Marine Isotope Stage) 29. This age is slightly younger than that given by Channell et al. (2002), who place it in MIS 30. The tuning-based age model brackets the age for the Olduvai precursor between 1.9815 and 1.9782 Ma, which is in line with the age of the event found in North Atlantic sediments (1.977 Ma) (Channell et al., 2003).
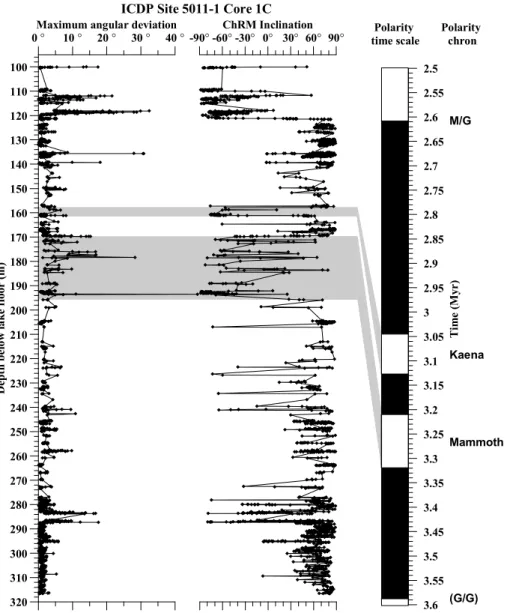
4.2 Polarity stratigraphy of core 1C
The NRM intensity in core 1C is high, with a range mainly between 10 and 1000 mA m−1(Fig. 2). Highest NRM values
0° 10° 20° 30° 40° Maximum angular deviation
320 310 300 290 280 270 260 250 240 230 220 210 200 190 180 170 160 150 140 130 120 110 100
D
ep
th
b
e
lo
w
la
k
e
fl
o
o
r
(m
)
-90°-60°-30° 0° 30° 60° 90°
ChRM Inclination ICDP Site 5011-1 Core 1C
3.6 3.55 3.5 3.45 3.4 3.35 3.3 3.25 3.2 3.15 3.1 3.05 3 2.95 2.9 2.85 2.8 2.75 2.7 2.65 2.6 2.55 2.5
T
im
e
(M
y
r
)
Polarity time scale
M/G
Kaena
Mammoth
(G/G) Polarity
chron
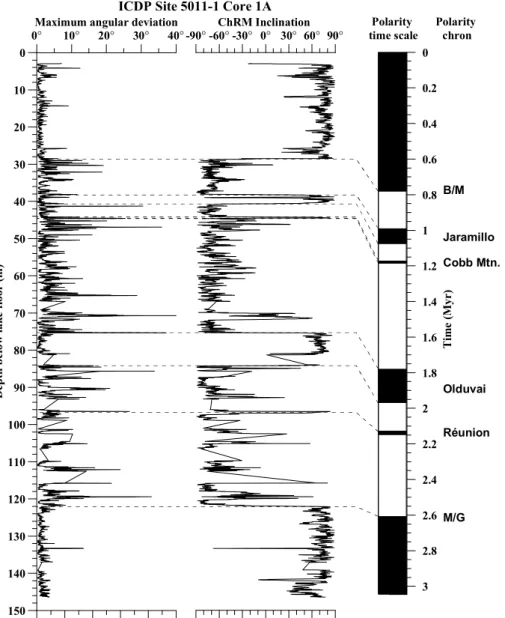
Fig. 7. Down-core variations in the inclinations of the characteristic remanent magnetization (ChRM) and maximum angular deviation
(MAD) from core 1C. Shaded areas denote correlation of the ChRM inclination with the polarity timescale. Gauss/Gilbert (G/G) boundary at 3.588 Ma is not recorded by the sediments.
to stay more in reversed than normal mode. These sediments are therefore interpreted as having been deposited during the Mammoth subchron (3.319 to 3.210 Ma). Unfortunately, there is a gap in sediment recovery directly below 193.8 m. Directly below this gap, the polarity is predominantly normal and represents the Gauss chron. As a consequence, the onset of Mammoth cannot be precisely determined from the pale-omagnetic data alone, and this tie point is ranked secondary. Sediment intervals extending from 224 to 241.5 m and es-pecially that from 280 to 286.5 m show several data points with reversed polarity sandwiched between those correlated with the early normal polarity Gauss. These cannot be cor-related with any known and widely accepted geomagnetic polarity events or excursions. The deeper parts of the sedi-ment record (≥287 m) show continuously a normal polarity.
These sediments can be interpreted as having been deposited during the early Gauss chron, bearing in mind that the crater was formed at 3.58±0.04 Ma (Layer, 2000), shortly after the Gauss/Gilbert (G/G) reversal (3.588 Ma).
4.3 Carrier of remanence in lake sediments and its origin
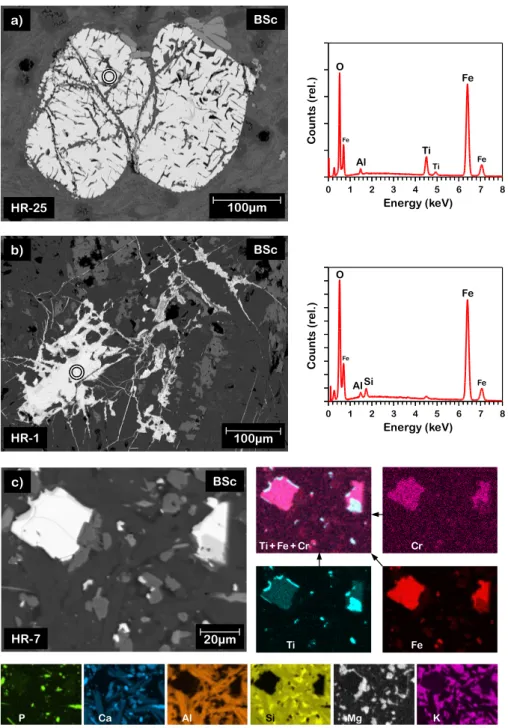
SEM-EDS microanalyses of polished sections of catchment rocks revealed the ubiquitous presence of large multi-domain (MD) sized grains of titanium-substituted magnetite (Ti-magnetite or titano(Ti-magnetite, Fe3-xTixO4), mainly between
100µm
100µm
BSc
a)
b)
BSc
HR-25
HR-1
0 1 2 3 4 5 6 7 8
Fe
Fe
Ti
Ti
O
Al
Fe
0 1 2 3 4 5 6 7 8
Fe
Fe
O
Fe
Al Si
Ti+Fe+Cr Cr
Ti Fe
Si
P Ca Al Mg K
20µm c)
HR-7
BSc
Energy (keV)
C
o
u
n
ts
(
re
l.
)
Energy (keV)
C
o
u
n
ts
(
re
l.
)
Fig. 8. Scanning electron microscope (SEM) analyses of polished sections from selected catchment rock samples: (a) SEM image and
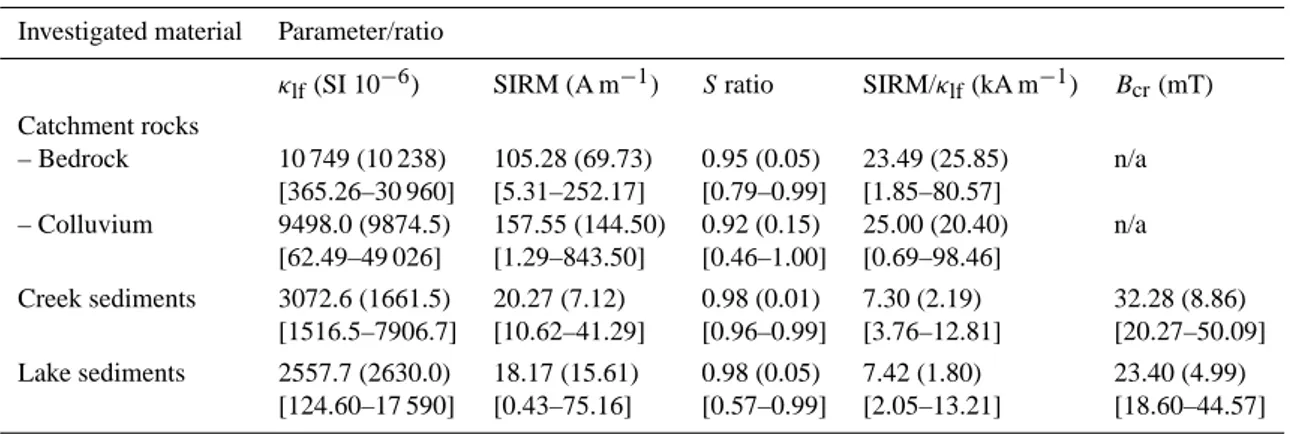
Table 3. Selected magnetic parameters from catchment rocks, creek sediments and lake sediments. Mean value, (standard deviation) and
[total range of values] are shown. See text for discussion.
Investigated material Parameter/ratio
κlf(SI 10−6) SIRM (A m−1) Sratio SIRM/κlf(kA m−1) Bcr(mT) Catchment rocks
– Bedrock 10 749 (10 238) 105.28 (69.73) 0.95 (0.05) 23.49 (25.85) n/a
[365.26–30 960] [5.31–252.17] [0.79–0.99] [1.85–80.57]
– Colluvium 9498.0 (9874.5) 157.55 (144.50) 0.92 (0.15) 25.00 (20.40) n/a
[62.49–49 026] [1.29–843.50] [0.46–1.00] [0.69–98.46]
Creek sediments 3072.6 (1661.5) 20.27 (7.12) 0.98 (0.01) 7.30 (2.19) 32.28 (8.86)
[1516.5–7906.7] [10.62–41.29] [0.96–0.99] [3.76–12.81] [20.27–50.09]
Lake sediments 2557.7 (2630.0) 18.17 (15.61) 0.98 (0.05) 7.42 (1.80) 23.40 (4.99)
[124.60–17 590] [0.43–75.16] [0.57–0.99] [2.05–13.21] [18.60–44.57]
rim of fractures surrounding an apparently unaltered cen-ter. This fracturing is presumably caused by gradual low-temperature oxidation of titanomagnetites, which results in outward migration of Fe cations and relative enrichment of Ti cations. This alteration process affecting magnetic prop-erties is called maghemitization, which has been described from titanomagnetites in volcanic rocks in different geo-logical settings (Marshall and Cox, 1972; Akimoto et al., 1984; Cui et al., 1994; Nowaczyk, 2011). Besides maghemite (γ−Fe2O3, with a cation-deficient spinel structure),
mag-netite (Fe3O4) and spinels from the magnetite–chromite solid
solution series (Fe(FexCr2-x)O4; 0≤x≤2) were detected.
Hematite (α−Fe2O3, with a corundum structure) often
oc-curs as narrow irregular veins, which fill in the spaces be-tween other mineral crystals, or alternatively, as fine-grained inclusions in other minerals (Fig. 8b). In many cases, mag-netite grains in the catchment of Lake El’gygytgyn are as-sociated with apatite intergrowths (Ca5(PO4)3(F, Cl, OH))
(Fig. 8b and c).
In line with the results from polished rock sections, SEM-EDS analysis of magnetic separates from creek sediments revealed titanomagnetite grains of a large MD size range (Fig. 9a). Similar to source rocks, many of the titanomag-netite grains are cracked due to low-temperature oxidation of magnetic minerals. While some grains have notably rounded edges probably due to abrasion while being transported in creek bedload, many particles are characterized by an id-iomorphic shape, or by sharp crystal edges, which indicates only short-distance transport from their source (Fig. 9a–e). Considering the small size of the Lake El’gygytgyn catch-ment, sediment transport distances in creeks discharging into the lake can be expected to be short. While aeolian flux today comprises only a small part (2 %) of total sediment income in Lake El’gygytgyn (Fedorov et al., 2013), its role in trans-porting ferrimagnetic particles may have been more impor-tant during Pleistocene glaciations (Maher, 2011).
In accordance with results from microanalyses, results from mineral magnetic measurements suggest the domi-nance of low-coercivity minerals in the magnetic proper-ties of catchment rocks, creek sediments and lake sedi-ments. Results from the magnetic measurements including
κlf, SIRM,Sratio, SIRM/κlfandBcr, are summarized in
Ta-ble 3. Stepwise acquisition of IRM indicates that the major-ity of catchment rock samples and creek sediments acquired 90 % of their SIRM after application of a magnetic field of
≤200 mT (Fig. 10). Rapid acquisition of remanence in low magnetic fields (<50 mT) supports the interpretation of a low-coercivity magnetic component, such as MD-sized ti-tanomagnetite, as the dominating magnetic mineral in catch-ment rocks. HighS ratios measured from catchment rocks and creek sediments point out again that titanomagnetite is dominating their magnetic properties (Table 3). Concentra-tion of magnetic minerals in catchment rocks, as estimated by SIRM andκlf, is comparable to that generally found in
ig-neous rocks (Hunt et al., 1995). Expressed in terms of mass percentage using an average value of mass-specific suscepti-bility for titanomagnetite of 422 m3kg−1(SI×10−6) (Peters and Dekkers, 2003), the mean concentration of titanomag-netite in the source rocks can be estimated as 0.96 %, with a range from 0.01 to 4.15 %. The variable lithology and the variable degree of physical and chemical alteration of the in-vestigated source rocks is reflected in the highly variable con-centration of magnetic minerals in the analyzed rock sam-ples, and it can be characterized byκlfvs. a SIRM bi-plot,
Sum
P Ca
Fe Ti
Al Si
100 µm
0 1 2 3 4 5 6 7 8
0 1 2 3 4 5 6 7 8
Fe
Fe Ti
Ti Mn O
O
P Ca
Ca Cl
Energy (keV)
C
o
u
n
ts
(
re
l.
)
10µm SE
BSc a)
b)
0 1 2 3 4 5 6 7 8
0 1 2 3 4 5 6 7 8
0 1 2 3 4 5 6 7 8
20µm
Fe
Fe
Fe Fe
Fe Fe Ti
Ti
Ti Ti
Ti Mn
Cr O
O
O AlSi
AlSi
Al Si
10µm
10µm
BSc
BSc
BSc c)
d)
e)
Fig. 9. Scanning electron microscope (SEM) analyses of magnetic extracts from creek sediments from the northwestern shore of El’gygytgyn: (a) SEM image and elemental mapping of a large (∼400 mum) titanomagnetite grain, Fe3-xTixO4(0≤x≤1), represented by the Fe and Ti mappings. The titanomagnetite is still encrusted by minerals of the host rock, where bright patches in the P and Ca mapping indicate the presence of apatite, Ca5(PO4)3(Cl, F, OH), whereas mappings of Al and Si reflect the distributions of silicates. (b) A close-up of an-other titanomagnetite with apatite inclusion, together with associated EDS analyses. (c) Idiomorphic and (d) irregular titanomagnetite grain.
(e) Idiomorphic Cr-bearing magnetite, FeFe(2-x)CrxO4(0≤x≤2). More or less distinctively visible shrinkage cracks in all grains indicate low-temperature oxidation (maghemitization). The circles from (b) to (e) mark the locations of EDS analyses. EDS – energy dispersive X-ray spectroscopy, BSc – back scatter electrons, SE – secondary electrons.
10 100 1000
0 0.2 0.4 0.6 0.8 1
N
o
rm
a
li
ze
d
in
te
n
si
ty
10 100 1000
M a g n e t i z i n g f i e l d ( m T ) A c q u i s i t i o n o f I R M
10 100 1000
Catchment rocks Creek sediments Lake sediments
a) b) c)
Fig. 10. Normalized acquisition of isothermal remanent magnetization (IRM) with respect to applied magnetic field strength in
differ-ent sample types. (a) Catchmdiffer-ent rocks gain remanence rapidly in low fields, indicating the presence of multi-domain titanomagnetite.
(b) Creek sediments appear more homogenous in their grain size and mineralogy, and most samples are saturated by magnetic field 200 mT
0.1 1 10 100 1000 SIRM
10 100 1000 10000 100000
lf
0.1 1 10 100 1000
10 100 1000 10000 100000
Fe
3O4
concentration increases
Fe
2O3:Fe3O4
increases
Bedrock
Colluvium Creek sediments
Lake sediments/Pleistocene Lake sediments/Pliocene
Fig. 11. Biplot of magnetic susceptibility (κlf) versus saturation re-manent magnetization (SIRM). Deviations from a linear relation-ship between the two parameters in different sample types indicate variation in the proportions of the constituting magnetic minerals in rock/sediment magnetic assemblages. Catchment rocks, including colluvium and bedrock, show widely varying magnetic properties, whereas data from creek sediments are notably clustered. In contrast to catchment rocks, lake sediments indicate a linear relationship be-tween the two magnetic parameters. This suggests a homogenous magnetic assemblage in the sediment column.
Hematite appears to be absent in creek sediments and con-sequently the magnetic mineralogy seems to be more uni-form in comparison to catchment rocks. Hysteresis proper-ties presented in a Day plot (Day et al., 1977) show that the magnetic grain size of creek sediments lies in the re-gion, which represents the coarser end of the PSD range (Fig. 12). This is not directly in line with the observation of large MD titanomagnetite grains witnessed in SEM imaging. This could be caused by alteration of magnetic properties due to maghemitization and the associated shrinkage cracks, di-viding large grains at least superficially, if not internally, into smaller domains (Cui et al., 1994). It is also possible that the rather crude method of magnetic extraction for SEM/EDS microscopy may not produce a representative sample of the magnetic assemblage present in creek sediments. Creek sed-iments have a lower concentration of magnetic minerals than catchment rocks (Table 3) and they appear notably clustered in the SIRM vs. κlf bi-plot, but their magnetic mineralogy
and grain size are largely homogenous. Interestingly, mag-netic grain size, as deduced from the ratio SIRM/κlf,
ap-pears larger in creek sediments than in catchment rocks. It is possible that the ratio does not respond sensitively to mag-netic grain size in this case, where magmag-netic mineralogy is characterized by maghemitized titanomagnetites. In their re-view aiming to define room-temperature magnetic parame-ters, which would best characterize different iron oxides and iron sulfides, Peters and Dekkers (2003) showed thatκlfand
SIRM values of maghemite are largely independent of grain
1 2 3 4 5
Bcr/Bc
0 0.1 0.2 0.3
M
s
r
/M
r
MD SD
PSD
2 1 3
Creek sediments Lake sediments/Pleistocene Lake sediments/Pliocene
Fig. 12. Modified Day plot (Day et al., 1977) of magnetic hysteresis
data obtained from material from Lake El’gygytgyn and its catch-ment. Symbols refer to the same material as listed in Fig. 11. Ex-perimental mixing lines 1 and 2 refer to Dunlop (2002), and line 3 refers to work by Parry (1980). SD = single-domain, PSD = pseudo-single domain, MD=multidomain. Ratios calculated using data from hysteresis analyses and measurement of coercivity of rema-nence are indicative of magnetic domain status in titanomagnetite. The majority of the samples plot near mixing line 3, which suggests a PSD to MD domain state of the analyzed samples. In particular, Pleistocene age lake sediment samples and creek sediments plot to the right from the theoretical mixing lines. This is probably due to the contribution of hematite in the mineral magnetic assemblages.
size from PSD (∼1–2 µm) to large MD (∼200 µm), which explains, in this case, the insensitivity of the ratio SIRM/κlf
to magnetic grain size variations. Lake sediments acquire IRM in a manner similar to creek sediments (Fig. 10). How-ever, approximately a quarter of samples show a more pro-nounced contribution from magnetic minerals with harder coercivity, most likely hematite. This is also visible in the higher coercivity (Bcr) of lake sediments in comparison with
respectively, the concentration of magnetite in the sediments of Lake El’gygytgyn is mainly controlled by the hypolim-netic redox conditions through large-scale magnetite dissolu-tion during glacials and not simply by detrital input. Higher magnetic concentration during the Pliocene is therefore inter-preted to reflect thorough mixing of lake water columns and weaker magnetite dissolution due to the warmer Pliocene cli-mate in the Arctic (Brigham-Grette et al., 2013). Moreover, vivianite (Fe3(PO4)2×8 H2O) nodules with relatively high
susceptibility (mean value 1.05×10⁻⁶m3kg−1) are present in sediments deposited during warm and cold climate stages (Minyuk et al., 2013), which may complicate paleoenviron-mental interpretation of magnetic susceptibility in terms of paleoclimate, where cold intervals are expected to be char-acterized by low magnetic susceptibility. Thus, it is not pos-sible to infer paleoenvironmental implications from mineral magnetic parameters alone. As shown by Frank et al. (2013) using pilot cores from Lake El’gygytgyn, statistical analy-sis of biochemical, inorganic and mineral magnetic data pro-vides a more complete understanding of paleoenvironmental changes when refining the pattern of different climate modes in the sediments.
5 Discussion
Magnetic polarity stratigraphy reconstructed from the sedi-ments from cores 1A and 1B from Lake El’gygytgyn com-pares favorably to the acknowledged geomagnetic polarity changes starting from the early Gauss chron to late Brun-hes. The directional stability of the sediments, with partly maghemitized detrital PSD-sized titanomagnetite as the car-rier of magnetization, enables reliable reconstruction of ge-omagnetic field changes from the sediments. The success-ful reconstruction of geomagnetic field changes during the Pleistocene and late Pliocene epochs comprises the main framework of geochronology for the sediments and enables pinning down of the age of fixed horizons along the sed-iment profile. These magnetostratigraphic tie points form the chronological frame for aligning (tuning) the different sediment climate proxy parameters with respect to orbital changes, which refines the temporal resolution of the sedi-ment chronostratigraphy (Nowaczyk et al., 2013). A paleo-magnetic composite record for Lake El’gygytgyn (Fig. 13) is amalgamated using data from cores 1A, 1B, and 1C from Site 5011-1 and the sediments from 0 (i.e., the water– sediment interface) to 5.67 m from core PG1351 from Lake El’gygytgyn (Nowaczyk et al., 2002), as the topmost sed-iment were not recovered during ICDP drilling. Compos-ite depth values for polarity reversals and their respective ages are given in Table 4. The high quality of the mag-netostratigraphic record may appear somewhat astonishing when taking into account the climatically induced dissolu-tion of magnetic minerals during glacials. Two scenarios can be speculated by which directional information can be
Table 4. Magnetostratigraphic tie points, their depth in the
com-posite record from Site 5011-1 and their age (Ma) from LR04, ex-cept for the ages of the Cobb Mountain and Réunion cryptochrons, which are from Ogg and Smith (2004). Ages for the Intra-Jaramillo and Olduvai precursor events are derived from tuning with respect to the LR04 stack (Nowaczyk et al., 2013).
Polarity chron, Composite Age (Ma)
subchron, depth (m)
cryptochron
Brunhes/Matuyama 31.710 0.780
Jaramillo (t) 41.530 0.991
Jaramillo (b) 44.110 1.073
Cobb Mountain (t) 47.800 1.175
Cobb Mountain (b) 48.125 1.185
Olduvai (t) 79.480 1.781
Olduvai (b) 88.425 1.968
Reunion (t) 100.630 2.128
Reunion (b) 101.150 2.148
Matuyama/Gauss 123.550 2.608
Kaena (t) 160.650∗ 3.045
Kaena (b) 163.500 3.127
Mammoth (t) 172.300 3.210
Mammoth (b) 197.400∗∗ 3.319
Impact 319.700 3.580±0.04
∗Low data quality prevents accurate determination of the
termination of the Kaena subchron.∗∗The depth value for the base of the Mammoth subchron represents a minimum value because of a gap in sediment recovery. Impact age is from data presented by Layer (2000).
preserved despite diagenetic changes associated with lake bottom anoxia: (1) magnetic particles became aligned to the field very quickly after deposition and subsequently part of them were dissolved within the sediment in reducing pore waters and (2) magnetic particles were already dissolved when settling down in the water column. The remaining par-ticles, became aligned with the field and alignment was fixed in the sediment. In both cases directional information would be preserved. The first alternative is preferred, because rel-ative paleointensity record cannot be reconstructed from the sediments. In case the second alternative would be true, de-positional remanent magnetization should be proportional to field strength after normalizing for magnetic concentration variations, but this is not the case (Nowaczyk et al., 2002).
-90°-60°-30° 0° 30° 60° 90° -90°-60°-30° 0° 30° 60° 90°
Magnetostratigraphy of Lake El'gygytgyn ICDP Site 5011-1 Composite
3.6 3.4 3.2 3 2.8 2.6 2.4 2.2 2 1.8 1.6 1.4 1.2 1 0.8 0.6 0.4 0.2 0
A
g
e
(M
y
r)
Polarity
B/M
Jaramillo
Cobb Mountain
Olduvai
Olduvai precursor
Réunion
Mammoth Kaena
Intra-Jaramillo Polarity
chron
M/G
Fig. 13. Composite record of ChRM inclinations from ICDP
Site 5011-1 in Lake El’gygytgyn. In the polarity column, black (white) [grey] denotes normal (reversed) [missing] polarity. Onset of the Mammoth subchron and termination of Kaena are some-what ambiguous due to missing sediment and low data quality at these depths in the composite. Their reliability as tie points is not first-order.
characterized by sandy and gravelly layers, which are not ideal for recording geomagnetic field changes. Discrete sam-ples yield point data, which may produce a noisy inclina-tion record if, for example, the sampled sediment displays low NRM intensity, or there are localized but unnoticed dis-turbances in the sediment. By comparison, paleomagnetic
measurements from u-channels integrate data over sediment intervals ∼10 cm in length, which results in low-pass fil-tering of the paleomagnetic data, whereby localized distur-bances do not stand out as much from the data (Roberts, 2006).
Nevertheless, the magnetostratigraphic interpretation of placing the onset of the Mammoth subchron in the paleo-magnetic record in core 1C is supported by paleoenviron-mental proxy data. Interpreting results from pollen analy-sis (Tarasov et al., 2013) supports the chronological con-strains set by magnetostratigraphy. Coinciding with the an-ticipated early Mammoth subchron, pollen data indicate a change in the paleoenvironment of Lake El’gygytgyn into cold and drought tolerant climate regime with steppe vegeta-tion. MIS M2 occurs in the early Mammoth subchron, and in previous studies MIS M2 has been connected with a global cooling event and an increase in ice volume (Dwyer and Chandler, 2009; Schepper et al., 2009). In consequence, the occurrence of plant taxa indicating cooler climate at about 3.3 Ma in core 1C is interpreted to be coeval with MIS M2, and thus supports the interpretation of magnetostratigraphic data from Lake El’gygytgyn.
The completeness of the ICDP Site 5011-1 magnetostrati-graphic record (Fig. 13), which shows all the widely ac-knowledged magnetic polarity chrons, subchrons, the cryp-tochrons Réunion and Cobb Mountain and even two excur-sions, attests to the absence of any major hiatuses in the sediment record. This adds to the debate of the glacial his-tory of Western Beringia and to the evidence presented by (Brigham-Grette et al., 2003) in support of an ice sheet-free Far East Russia since the Middle Pleistocene.
Using the present paleomagnetic approach, the age of the El’gygytgyn impact structure can be loosely bracketed be-tween the onset of the Mammoth subchron at 3.319 Ma onset of the Gauss chron, which Ogg and Smith (2004) place at 3.588 Ma. In the base of the sequence at ICDP Site 5011-1, sediments show a consistently normal polarity, which sug-gests that these sediments are definitely younger than the G/G polarity reversal (3.588 Ma), which sets the age of the impact to the younger end in the error margin of 3.58±0.04 reported by Layer (2000). Previous work using fission track dating placed the corrected age estimate of the structure at 4.52±0.11 Ma (Storzer and Wagner, 1979). An even older result from K/Ar dating was proposed by Belyi (1998), who suggested that volcanic activity in the area between 5.8±0.5 Ma and 8.4±0.7 Ma would have given rise to the structure. In the light of first-time paleomagnetic results from the present study, the results both from fission track and K/Ar dating can be taken as inaccurate, and it can be concluded that results from 40Ar/39Ar dating (Layer, 2000) presently give the most accurate estimate of the age of the impact.
(Layer, 2000) and the onset of the Mammoth subchron at 3.319 Ma, the mean sedimentation rate was an order of mag-nitude higher (∼44 cm kyr−1) compared to the sediments ac-cumulated since the beginning of the Pleistocene and un-til the most recent part of the record (Fig. 14). The Early and Middle Pliocene climate in the Arctic was warmer and moister than the present (Salzmann et al., 2011), as char-acterized, for example, by the presence of boreal forests on Ellesmere Island (Ballantyne et al., 2006). The moister Pliocene climate can be postulated to have promoted fluvial supply of detrital matter from the lake catchment to the basin, as witnessed in the higher sedimentation rates in compari-son with those reconstructed for the Pleistocene. The shift from the Pliocene to the Pleistocene, in general, is associ-ated with reorganization of atmospheric and oceanic circula-tion patterns, leading to global paleoenvironmental changes, as evidenced, for example, by the formation of Northern Hemisphere ice sheets (Raymo, 1994) and large-scale arid-ification in the subtropical latitudes on both hemispheres (deMenocal, 2004; McLaren and Wallace, 2010). Therefore, the deceleration of sedimentation in Lake El’gygytgyn re-lates to the reorganization of atmospheric circulation over the circumpolar area through changes in surface hydrologic pro-cesses, decreasing thickness of soil active layer and forma-tion of permafrost and thus it reflects in part the sensitivity of the El’gygytgyn sedimentary record to climatic change (Schwamborn et al., 2012). However, the high sedimenta-tion rates, which fill in the basin rapidly in the early his-tory of the crater, are probably also promoted by geologi-cal processes. The newly formed outer crater rim structure with unstable steep inner flanks, which rose up to 230 m above the present lake level, provided abundant erodible clas-tic material (Gurov and Koeberl, 2004), increasing the flux of clastic material into the lake. During the late Quaternary, lake water table changes followed climatic variability, with higher levels inferred to have occurred during warmer peri-ods (Juschus et al., 2011). Anticipated high water tables dur-ing Pliocene times likely promoted the input of detrital mat-ter from the catchment by enhanced wave action in the first
∼200 kyr since the crater formation. During this time, sedi-ment deposition rate is at its highest. After this initial stage in sediment deposition in Lake El’gygytgyn the sedimentation slows down significantly.
Lower sedimentation rates during the Pleistocene prob-ably prolonged the magnetization lock-in time in Lake El’gygytgyn sediments and thus decreased the temporal res-olution of the obtained paleomagnetic data. This might be the reason why most of the geomagnetic excursions docu-mented to have taken place during the Matuyama and Brun-hes chrons (e.g., Laj and Channell, 2007) are missing in the ICDP Site 5011-1 record, except for Olduvai precursor and the Intra-Jaramillo excursions. In addition to low sedimenta-tion rates, the posisedimenta-tion of Lake El’gygytgyn may decrease the probability of very short-term geomagnetic changes of be-ing recorded, because polarity change is anticipated to take
4.02 5.30 4.86 7.78 22.20 44.51
0 0.5 1 1.5 2 2.5 3 3.5
Age (Myr) 300 250 200 150 100 50 0 C o m p o si te D ep th (m ) Pleistocene epoch Pliocene epoch L a k e E l' g y g y tg y n S it e 5 0 1 1 -1 C o m p o si te M a g n et o st ra ti g ra p h y
Impact at 3.58 0.04 Ma
Kae na Mam mot h M/G Réu nio n Old uva i Cob bM tn. Jara mil lo B/M
Geomagnetic Polarity Timescale
Fig. 14. Age–depth curve of the composite record (in blue) based
on stratigraphical tie points (black diamonds) provided by the mag-netostratigraphy. Age of the impact (Layer, 2000) denoted with a star forms an additional chronological tie point. Numbers in boxes refer to sedimentation rates (cm kyr−1) in different intervals of the composite record.
a longer time at high-latitude sites compared to lower lati-tudes (Clement, 2004). However, the presence of the Oldu-vai precursor and Intra-Jaramillo excursions, which last only 3.3 and 5 kyr, respectively (Nowaczyk et al., 2013), sug-gests that even higher frequency variations in the geomag-netic field can be recorded in favorable conditions at high-latitude sites. The more scattered inclination record, and less clear-cut polarity boundaries during the Pliocene in compar-ison with those in the Pleistocene may also be due to higher sedimentation rates during the Pliocene, which allow a more detailed recording of the transitional geomagnetic field con-figuration during reversals.
6 Conclusions
the continental Arctic. In the base of the record, sedimen-tation rate is an order of magnitude higher (44.5 cm kyr−1) compared to sediments deposited during the Pleistocene. De-celeration of sedimentation rate is interpreted as responding to hydrological changes associated with Quaternary climate cooling and geological development of the crater structure. This magnetostratigraphic study rules out the incidence of the impact, which formed the El’gygytgyn meteorite crater, prior to the early Gauss chron.
Acknowledgements. We would like to thank the participants in the lake drilling campaign in 2008/2009 for recovering the long sediment cores from Lake El’gygytgyn. O. Juschus and G. Schwamborn provided sample material from the El’gygytgyn catchment. G. Arnold prepared the polished rock sections. H. Kemnitz and J. Herwig provided technical assistance at the SEM/EDS facility. A team of student assistants at the Depart-ment of Geology, University of Cologne, sampled sediDepart-ments in u-channels. R. Gromig participated in paleomagnetic sampling using discrete paleomagnetic boxes. D. Ulbricht, G. Schwamborn and V. Wennrich transported u-channel samples from Cologne to Potsdam. L. Brown and an anonymous reviewer provided thoughtful reviews. Funding for this research was provided by the International Continental Scientific Drilling Program (ICDP), the US National Science Foundation (NSF), the German Federal Ministry of Education and Research (BMBF), the Alfred Wegener Institute (AWI) and GeoForschungsZentrum Potsdam (GFZ), the Russian Academy of Sciences Far East Branch (RAS FEB), the Russian Foundation for Basic Research (RFBR), and the Austrian Federal Ministry of Science and Research (BMWF). The Russian GLAD800 drilling system was developed and operated by DOSECC Inc., the down hole logging was performed by the ICDP-OSG, and LacCore, at the University of Minnesota, handled core curation.
The service charges for this open access publication have been covered by a Research Centre of the Helmholtz Association.
Edited by: J. Brigham-Grette
References
Akimoto, T., Kinoshita, H., and Furuta, T.: Electron probe micro-analysis study on processes of low- temperature oxidation of ti-tanomagnetite, Earth Planet. Sc. Lett., 71, 263–278, 1984. Ballantyne, A. P., Rybczynski, N., Baker, P. A., Harington, C. R.,
and White, D.: Pliocene Arctic temperature constraints from the growth rings and isotopic composition of fossil larch, Palaeo-geogr. Palaeocl., 242, 188–200, 2006.
Belyi, V. F.: Impactogenesis and volcanism of the El’gygytgyn de-pression, Petrology, 6, 86–99, 1998.
Brigham-Grette, J., Gualtieri, L. M., Glushkova, O. Y., Hamil-ton, T. D., Mostoller, D., and Kotov, A.: Chlorine-36 and 14C chronology support a limited last glacial maximum across cen-tral chukotka, northeastern Siberia, and no Beringian ice sheet, Quaternary Res., 59, 386–398, 2003.
Brigham-Grette, J., Melles, M., Minyuk, P., and Scientific Party: Overview and significance of a 250 ka paleoclimate record from El’gygytgyn Crater Lake, NE Russia, J. Paleolimnol., 37, 1–16, 2007.
Brigham-Grette, J., Melles, M., Minyuk, P., Andreev, A., Tarasov, P., DeConto, R., Koenig, S., Nowaczyk, N., Wennrich, V., Rosén, P., Haltia-Hovi, E., Cook, T., Gebhardt, C., Meyer-Jacob, C., Snyder, J., and Herzschuh, U.: Pliocene warmth, polar amplifi-cation, and stepped Pleistocene cooling recorded in NE Arctic Russia, Science, 340, 1421–1427, 2013.
Cande, S. C. and Kent, D. V.: Revised calibration of the geomag-netic polarity timescale for the Late Cretaceous and Cenozoic, J. Geophys. Res., 100, 6093–6095, 1995.
Chamalaun, F. H. and McDougall, I.: Dating geomagnetic polarity epochs in Réunion, Nature, 210, 1212–1214, 1966.
Channell, J. E. T. and Kleiven, H. F.: Geomagnetic palaeointensities and astrochronological ages for the Matuyama–Brunhes bound-ary and the boundaries of the Jaramillo Subchron: palaeomag-netic and oxygen isotope records from ODP Site 983, Philos. T. Roy. Soc. A, 358, 1027–1047, 2000.
Channell, J. E. T., Mazaud, A., Sullivan, P., Turner, S., and Raymo, M. E.: Geomagnetic excursions and paleointensities in the Matuyama Chron at Ocean Drilling Program Sites 983 and 984 (Iceland Basin), J. Geophys. Res., 107, EPM 1.1–EPM 1.14, doi:10.1029/2001JB000491, 2002.
Channell, J. E. T., Labs, J., and Raymo, M. E.: The Réunion Sub-chronozone at ODP Site 981 (Feni Drift, North Atlantic), Earth Planet. Sc. Lett., 215, 1–12, 2003.
Clement, B. M.: Dependence of the duration of geomagnetic polar-ity reversals on site latitude, Nature, 428, 637–640, 2004. Cui, Y., Verosub, K. L., and Roberts, A. P.: The effect of
low-temperature oxidation on large multi-domain magnetite, Geo-phys. Res. Lett., 21, 757–760, 1994.
Day, R., Fuller, M., and Schmidt, V. A.: Hysteresis properties of ti-tanomagnetites: grain-size and compositional dependence, Phys. Earth Planet. Int., 13, 260–267, 1977.
Dearing, J. A., Boyle, J. F., Appleby, P. G., Mackay, A. W., and Flower, R. J.: Magnetic properties of recent sediments in Lake Baikal, Siberia, J. Paleolimnol., 20, 163–173, 1998.
deMenocal, P. B.: African climate change and faunal evolution dur-ing the Pliocene-Pleistocene, Earth Planet. Sc. Lett., 220, 3–24, 2004.
Dunlop, D. J.: Theory and application of the Day plot (Mrs/Ms versus Hcr/Hc), 1. Theoretical curves and tests using titanomagnetite data, J. Geophys. Res., 107, 2056, doi:10.1029/2001JB000486, 2002.
Dwyer, G. S. and Chandler, M. A.: Mid-Pliocene sea level and con-tinental ice volume based on coupled benthic Mg/Ca palaeotem-peratures and oxygen isotopes, Philos. T. Roy. Soc. A, 367, 157– 168, 2009.
Fedorov, G., Nolan, M., Brigham-Grette, J., Bolshiyanov, D., Schwamborn, G., and Juschus, O.: Preliminary estimation of Lake El’gygytgyn water balance and sediment income, Clim. Past, 9, 1455–1465, doi:10.5194/cp-9-1455-2013, 2013. Frank, U., Nowaczyk, N. R., Minyuk, P., Vogel, H., Rosén, P.,