Association of Nutritional Status with Depression and Sleep
Disorders in Elderly End Stage Renal Disease Patients - Does Chronic
Inlammation Cause it all?
Son Dönem Böbrek Yetmezlikli Yaşlı Hastalarda Beslenme Durumunun
Depresyon ve Uyku Bozuklukları ile İlişkisi - Tümüne Kronik
İnlamasyon Yol Açabilir mi?
Ayşe BilGiÇ1 Avşin iBiş2 emre TuTAl2 serkan KOÇ2 siren sezeR2 Nurhan ÖzDeMir2
1 Fatih University Faculty of Medicine, Department of Nephrology, Ankara, Turkey
2 Baskent University Faculty of Medicine, Department of Nephrology, Ankara, Turkey
AbsTRAcT
OBJeCTIve: In our study we aimed to analyze the association between nutritional status and depression and sleep disturbance in elderly dialysis patients.
MATerIAl and meTHoDs: Seventy-three patients receiving dialysis treatment older than 65 years of age were enrolled in this study. Nutritional status was determined by Subjective Global Assessment (SGA). Patients were also evaluated with Beck Depression Inventory and Pittsburg Sleep Quality Index. Demographic and laboratory data were recorded.
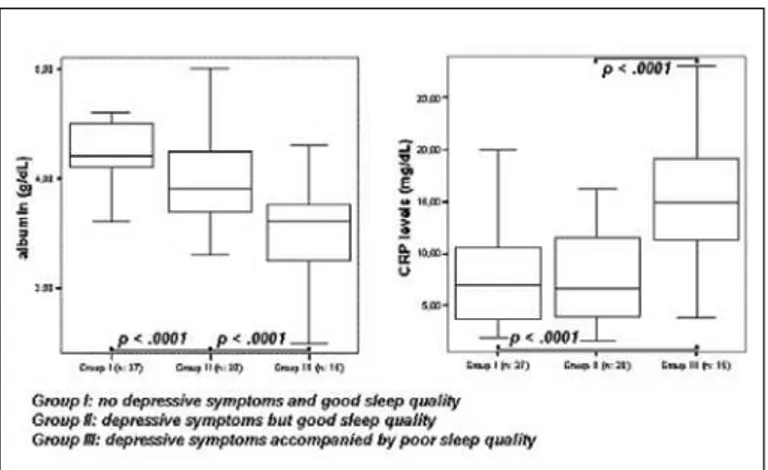
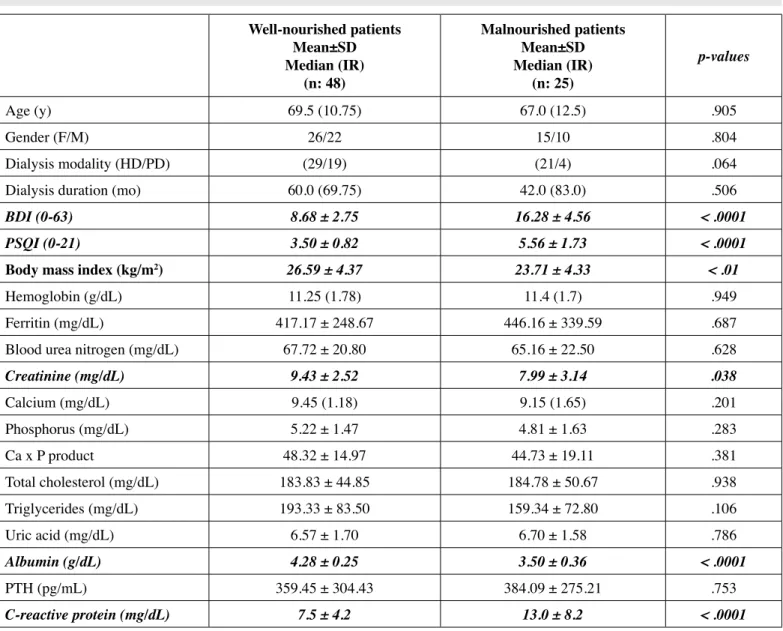
reSulTS: According to SGA, 48 (65.8%) patients were well nourished and 25 (34.2%) patients had mild-moderate and severe malnutrition. When the well-nourished and malnourished patients were compared, the well-nourished group had higher albumin (p<.0001) and creatinine (p=.03) levels, higher body mass indices (p<.01), lower CRP levels (p<.0001), better quality of sleep (p<.0001) and lower depression scores (p<.0001) than the malnourished group. When we grouped patients as Group I (not depressive and good sleep quality), Group II (depressive but good sleep quality) and Group III (both depressive and poor sleep quality, we found that Group III had the lowest albumin (p < .0001) and highest CRP (p < .0001) values when compared to the other two groups.
CONCluSION: Depression, sleep disorders, and the nutritional status are important factors which interact with each other and elderly dialysis patients with malnutrition should be well assessed for the presence of any inlammatory status and/or psychological-sleep disorders.
key woRDs: Elderly patients, Dialysis, Malnutrition, Depression, Sleep disorder
Öz
AMAÇ: Çalışmamızda yaşlı diyaliz hastalarında beslenme durumu ile depresyon ve uyku bozukluğu arasındaki ilişkiyi incelemeyi amaçladık.
GereÇ ve yÖnTemleR: Çalışmaya diyaliz tedavisi almakta olan 65 yaş üzerindeki 73 hasta alındı. Beslenme durumu “Subjektif Global Değerlendirme (SGD)” ile belirlendi. Hastalar ayrıca “Beck Depresyon Görüşmesi” ve “Pittsburg Uyku Kalitesi İndeksi” ile değerlendirildi. Hastaların demograik ve laboratuvar verileri kaydedildi.
BulGulAr: SGD sonuçlarına göre, 48 (%65.8) hastanın beslenme durumu iyi düzeyde iken 25 (%34.2) hasta haif-orta ve ciddi derecede beslenme bozukluğuna sahipti. Beslenme durumu iyi olan hastalar ile malnutrisyonu olan hastalar karşılaştırıldığında, beslenmesi iyi olan grubun daha yüksek albümin (p<0,0001) ve kreatinin (p=0,03) düzeyleri ile vücut kitle indeksine (p<0,01), daha düşük CRP düzeylerine (p<.0001), daha iyi uyku kalitesine (p<0,0001) ve daha düşük depresyon skorlarına (p<0,0001) sahip olduğu görüldü. Hastaları, Grup I (depresyonu olmayan ve iyi uyku kalitesine sahip), Grup II (depresyonu olan ancak iyi uyku kalitesine sahip), Grup III (depresyonu olan ve kötü uyku kalitesine sahip) şeklinde gruplandığımızda Grup III’ün diğer gruplara kıyasla en düşük albümin (p<0,0001) ve en yüksek CRP (p<0,0001) düzeylerine sahip olduğu bulundu.
SONuÇ: Depresyon, uyku bozuklukları ve beslenme durumu birbirleriyle ilişkili önemli etkenlerdir ve malnutrisyonu olan yaşlı diyaliz hastaları inlamatuvar durum ve/veya psikolojik ve uyku bozuklukları varlığı açısından iyi değerlendirilmelidir.
AnAHTAR sÖzcükleR: Yaşlı hastalar, Diyaliz, Malnutrisyon, Depresyon, Uyku bozukluğu
Correspondence Address:
Ayşe BilGiÇ
objective aspects of the medical history and physical examination. SGA has been shown, in many studies, to be a simple, reliable and reproducible method for assessing the nutritional status in ESRD patients (11). We used a 7-point Likert-type scale of four criteria: weight loss, anorexia, subcutaneous fat and muscle mass. Each criterion was scored for producing a global assessment. Scores of 1–2 represented severe malnutrition (group C); 3–5, moderate to mild malnutrition (group B); and 6–7, normal nutrition (group A) (12). Then patients were regrouped according to SGA score, as well-nourished (SGA=A) or malnourished (SGA=B or C).
Beck Depression Inventory (BDI), which is a questionnaire that includes 21 questions, was used to measure the presence and degree of depression. These 21 questions were answered on a four-point Likert scale in which “0” represents the absence of a problem and “3” represents an extreme problem, with a total range of 0 to 63 points. The standard cut-offs are as follows: 0-9 indicates that a person is not depressed, 10-18 indicates mild-moderate depression, 19-29 indicates moderate-severe depression and 30-63 signiies severe depression. Higher total scores indicate more severe depressive symptoms (13).
Quality of sleep was measured using the Pittsburgh Sleep Quality Index (PSQI). This self-administered questionnaire assesses quality of sleep during the previous month and contains 19 self-rated questions yielding seven components: subjective sleep quality, sleep latency, sleep duration, sleep eficiency, and sleep disturbances, use of sleep medications and daytime dysfunction. Each component is scored from 0 to 3, yielding a global PSQI score between 0 and 21 points, with higher scores indicating lower quality of sleep. The PSQI is useful in identifying good and poor sleepers. Patients who have a PSQI score > 5 are considered to be a ‘poor sleeper’ (14).
Demographic data was collected during questionnaries and biochemical data was collected from patient records. Collected laboratory data included hemoglobin, blood urea nitrogen, creatinine, calcium, phosphorus, total cholesterol, triglycerides, uric acid, albumin, parathyroid hormone, and CRP values of the last 3 monthly routine follow-ups and the mean value of each parameter was recorded as the inal data.
Statistical analyses were performed with the SPSS software (Statistical Package for the Social Sciences, version 11.0, SSPS Inc, Chicago, Ill, USA). All numerical variables are expressed as the mean ± standard deviation (SD). Normality of data was analyzed by using the Kolmogorov-Smirnov test. All numerical variables with normal distribution were expressed as the mean ± standard deviation (SD) while variables with skew distribution were expressed as median (Interquartile range). Differences between two groups were analyzed and compared by the Independent Samples t test or Mann-Whitney U test. We used the One Way-ANOVA test to analyze intergroup differences of more than 2 groups and also used a Tukey test for Post Hoc analyses. In case of skew distribution we used the Kruskal-Wallis test INTrODuCTION
The proportion of elderly people is rising throughout the world and this inds relection in the increasing percentage of elderly patients in the end-stage renal disease (ESRD) population. This elderly group of patients shows a tendency to have an increased frequency of co-morbid conditions, infectious diseases, malignancies, cardiovascular diseases and malnutrition (1). Elderly or not, the majority of hemodialysis patients suffer from sleep disturbances and depression which are the most common psychological disorders among these patients (2, 3). It has been demonstrated that quality of sleep and depressive symptoms are important determinants of interdialytic weight gain, overall quality of life, oral intake and nutritional status in chronic dialysis patients and it has been suggested that antidepressant medication can improve depressive symptoms and nutritional status in ESRD patients with depression (4-8).
Protein-energy malnutrition is a common phenomenon in ESRD patients and a risk factor for poor quality of life and increased morbidity and mortality (9, 10). Presence of depression and sleep disturbances might have additional effects on nutritional status via their effects on quality of life or food intake. In this study we aimed to analyze the association between nutritional status and psychological factors such as depression and sleep disturbance in elderly dialysis patients.
pATIeNTS and MeTHODS
Seventy-three dialysis patients older than 65 years of age were enrolled in this study. The study was conducted in accordance with the Declaration of Helsinki and informed consent was obtained from all patients before enrollment. During initiation of the study, all patients were on maintenance dialysis treatment for at least 12 months and had been free of acute infectious, inlammatory and any other illness that required hospitalization for the previous 3 months. All included patients with chronic inlammatory status [C-reactive protein (CRP) levels continuously elevated, or elevated for at least 3 of last 6 months on monthly routine follow-up] were evaluated for presence of any malignancy, chronic infection (tuberculosis etc) by clinical and laboratory examination and patients with any of the above mentioned pathologhical conditions were excluded. HD patients were receiving 4-h HD sessions three times weekly with bicarbonate-buffered dialysate and biocompatible polysulphonemembranes. All PD patients were using a Baxter’s Ultra Bag system (Baxter Health Care Co. Deerield, Ill., USA). Patients with inadequete dialysis (for HD; Kt/V < 1,2, and for PD; weekly Kt/V < 2) were not included and any clinically hypervolemic patients were included after reaching their ideal dry weight according to radiological and physical examination. None of the patients were receiving any antidepressive treatment including tricyclic antidepressants.
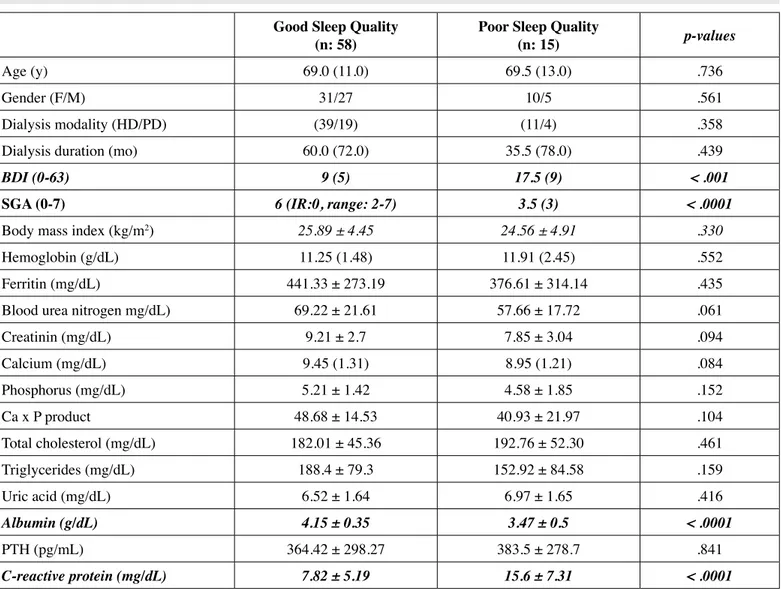
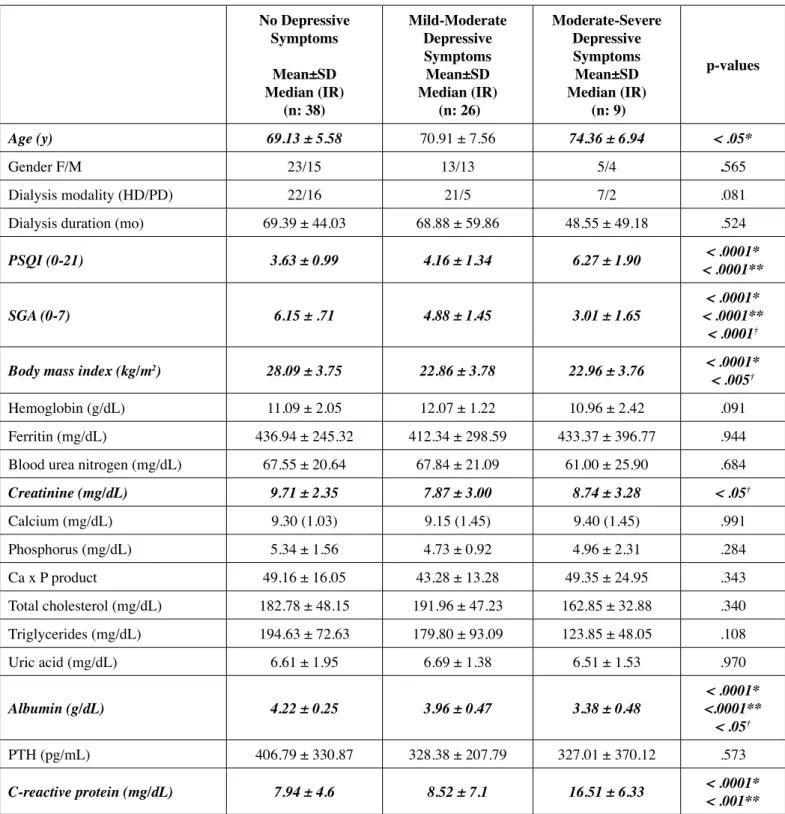
well nourished and 25 (34.2%) patients had mild-moderate and severe malnutrition. When the well-nourished and malnourished patients were compared, the well-nourished group had higher albumin and creatinine levels, higher body mass indices, lower CRP levels, better quality of sleep and lower depression scores than the malnourished group (Table II). When patients were grouped according to presence of poor sleep quality and compared with each other; poor sleepers had lower albumin, calcium and higher CRP levels, lower SGA and higher BDI scores (Table III). Similarly, when patients were grouped into 3 according to presence of mild or moderate-severe depressive symptoms and no depressive symptoms, patients with moderate-severe depressive scores had the lowest albumin, highest CRP levels, lowest SGA and highest PSQI scores. According to analyses, nondepressive patients had the highest body mass index values and moderate-severely depressive patients were also older compared to their not depressive counterparts. (Table IV). However this difference was not found when we grouped patients according to the presence of both symptoms; Group I (n: 37, not depressive and good sleep quality), Group II (n: 20, depressive but good sleep quality) and Group III (n: 15, both depressive and poor sleep quality). One patient had poor sleep quality but had no depressive symptoms, so that the patient was not evaluated in the statistical analysis of these groups. In this analysis we found that patients with depressive symptoms accompanied by poor sleep quality had the lowest albumin and highest CRP values when compared to other 2 groups [(albumin; 3.4 ± 0.5 vs 4.0 ± 0.4 and 4.2 ± 0.2 g/dL) and (CRP; 15.6 ± 7.3 vs 8.3 ± 6.2 and 7.4 ± 4.3 mg/dL), p < .0001, Figure 1].
for comparing the three groups. Categorical variables were compared with the chi-square test. A P value of less than .05
was considered statistically signiicant. reSulTS
The baseline demographic, clinical, and laboratory features of the patients are summarized in Table I. According to PSQI and BDI scorings 15 patients (20.5%) had sleep disorder, 26 (32.9%) had mild to moderate depression and 9 (15.1%) had moderate to severe depression. BDI scores and PSQI scores were correlated (r:.583, p < .0001). According to SGA, 48 (65.8%) patients were
Table I: Demographic, clinical, and laboratory parameters of the study population.
Mean±SD (range) Median (Ir) (n: 73)
Age (yr) 72.5 ± 6.0 (65 – 87)
Sex (F/M) 41/32
Dialysis modality (HD/PD) 50/23
Dialysis duration (mo) 59 (72)
SGA (0-7) 6 (2)
BDI (0-63) 9 (7)
PSQI (0-21) 4 (2 )
Body mass index (kg/m2) 25.63 ± 4.54 (16.71 – 34.29)
Hemoglobin (g/dL) 11.3 (1.75)
Ferritin (mg/dL) 427.26 ± 281.45 (24-1180) Blood urea nitrogen (mg/dL) 66.84 ± 21.28 (29 – 128) Creatinine (mg/dL) 8.93 ± 2.81 (2.1 – 13.4)
Calcium (mg/dL) 9.3 (1.25)
Phosporus (mg/dL) 5.08 ± 1.53 (2.1 – 8.1) Total cholesterol (mg/dL) 184.16 ± 46.6 (99 – 314) Triglycerides (mg/dL) 181.3 ± 80.97 (48 – 442) Uric acid (mg/dL) 6.63 ± 1.64 (3.6 – 11)
Albumin (g/dL) 4.01 ± 0.47 (2.5 – 5)
PTH (pg/mL) 368.06±292.55 (12.3–1180)
C-reactive protein (mg/dL) 9.44 ± 6.47 (1.6 – 28)
sGA: Subjective Global Assessment, BDI: Beck Depression Inventory, pSQI: Pittsburgh Sleep Quality Index,
pTH: Parathyroid hormone
Table II: Demographic, clinical, and laboratory data for well-nourished and malnourished patients.
Well-nourished patients mean±sD Median (Ir)
(n: 48)
Malnourished patients mean±sD Median (Ir)
(n: 25)
p-values
Age (y) 69.5 (10.75) 67.0 (12.5) .905
Gender (F/M) 26/22 15/10 .804
Dialysis modality (HD/PD) (29/19) (21/4) .064
Dialysis duration (mo) 60.0 (69.75) 42.0 (83.0) .506
BDI (0-63) 8.68 ± 2.75 16.28 ± 4.56 < .0001
PSQI (0-21) 3.50 ± 0.82 5.56 ± 1.73 < .0001
Body mass index (kg/m2) 26.59 ± 4.37 23.71 ± 4.33 < .01
Hemoglobin (g/dL) 11.25 (1.78) 11.4 (1.7) .949
Ferritin (mg/dL) 417.17 ± 248.67 446.16 ± 339.59 .687
Blood urea nitrogen (mg/dL) 67.72 ± 20.80 65.16 ± 22.50 .628
Creatinine (mg/dL) 9.43 ± 2.52 7.99 ± 3.14 .038
Calcium (mg/dL) 9.45 (1.18) 9.15 (1.65) .201
Phosphorus (mg/dL) 5.22 ± 1.47 4.81 ± 1.63 .283
Ca x P product 48.32 ± 14.97 44.73 ± 19.11 .381
Total cholesterol (mg/dL) 183.83 ± 44.85 184.78 ± 50.67 .938
Triglycerides (mg/dL) 193.33 ± 83.50 159.34 ± 72.80 .106
Uric acid (mg/dL) 6.57 ± 1.70 6.70 ± 1.58 .786
Albumin (g/dL) 4.28 ± 0.25 3.50 ± 0.36 < .0001
PTH (pg/mL) 359.45 ± 304.43 384.09 ± 275.21 .753
C-reactive protein (mg/dL) 7.5 ± 4.2 13.0 ± 8.2 < .0001
BDI: Beck Depression Inventory, pSQI: Pittsburgh Sleep Quality Index
Depression and poor sleep quality are both common and important problems that affect quality of life in ESRD patients. Some previous studies reported that a 50-85% frequency for sleep disturbances and a 20-25% frequency for depression (18 - 20). In our study population presence of depressive symptoms was higher than these previous studies (total of 48%) while presence of sleep disturbances was lower (20.5 %). It has been proposed that numerous factors including metabolic changes and treatment-related factors may contribute to the high prevalence of sleep problems in dialysis patients. Sabbattini et al reported that there is a relation between high PTH levels and sleep disorders in the ESRD population, which might be related to pruritus and bone pain, and those patients who are poor sleepers have lower hemoglobin levels compared with DISCuSSION
most important causes of mortality in this patient group (25). An important inding in our study was that these malnourished patients also had higher depressive symptoms and lower sleep quality.
We found that both poor sleep quality and depressive symptoms were closely associated with malnutrition, low albumin and high CRP levels. Patients with moderate-severe depressive symptoms had the highest malnutrition rates and highest CRP but lowest albumin levels. Similarly patients with poor sleep quality had higher CRP levels and malnutrition rates. Depending on these indings we think that depression and poor sleep quality are closely associated with inlammatory conditions and malnutrition.In fact, in previous studies it was reported that higher malnutrition-inlammation scores were associated with the presence of moderate-to-severe depression and poor sleep and life quality in hemodialysis patients (26) patients who are good sleepers (21, 22). We did not ind such
a relationship between sleep quality and hemoglobin, PTH, calcium, or phosphorus values.
Malnutrition, another common problem that is associated with poor life expectance and lower life quality in ESRD patients, was reported to be present in at least 30% of dialysis patients (23). Of these 30 percent patients nearly another 30% (6-8 % of total) usually have severe malnutrition (24). We also found a similar frequency for malnutrition in our study population. There were 5 patients (6.8 %) with severe and 20 patients (27.4%) with mild-moderate malnutrition, and a total malnutrition rate of 34.2% in the study population. These malnourished patients had lower albumin and higher CRP levels as expected. It is well known that malnutrition in dialysis patients is closely associated with chronic inlammation as a part of malnutrition-inlammation-atherosclerosis syndrome (MIA) and at the end, is one of the
Table III: Demographic, clinical, and laboratory data for PSQI poor and good sleep quality groups. Good Sleep Quality
(n: 58) poor Sleep Quality (n: 15) p-values
Age (y) 69.0 (11.0) 69.5 (13.0) .736
Gender (F/M) 31/27 10/5 .561
Dialysis modality (HD/PD) (39/19) (11/4) .358
Dialysis duration (mo) 60.0 (72.0) 35.5 (78.0) .439
BDI (0-63) 9 (5) 17.5 (9) < .001
SGA (0-7) 6 (IR:0, range: 2-7) 3.5 (3) < .0001
Body mass index (kg/m2) 25.89 ± 4.45 24.56 ± 4.91 .330
Hemoglobin (g/dL) 11.25 (1.48) 11.91 (2.45) .552
Ferritin (mg/dL) 441.33 ± 273.19 376.61 ± 314.14 .435
Blood urea nitrogen mg/dL) 69.22 ± 21.61 57.66 ± 17.72 .061
Creatinin (mg/dL) 9.21 ± 2.7 7.85 ± 3.04 .094
Calcium (mg/dL) 9.45 (1.31) 8.95 (1.21) .084
Phosphorus (mg/dL) 5.21 ± 1.42 4.58 ± 1.85 .152
Ca x P product 48.68 ± 14.53 40.93 ± 21.97 .104
Total cholesterol (mg/dL) 182.01 ± 45.36 192.76 ± 52.30 .461
Triglycerides (mg/dL) 188.4 ± 79.3 152.92 ± 84.58 .159
Uric acid (mg/dL) 6.52 ± 1.64 6.97 ± 1.65 .416
Albumin (g/dL) 4.15 ± 0.35 3.47 ± 0.5 < .0001
PTH (pg/mL) 364.42 ± 298.27 383.5 ± 278.7 .841
C-reactive protein (mg/dL) 7.82 ± 5.19 15.6 ± 7.31 < .0001
Table Iv: Demographic, clinical, and laboratory data for patient groups with mild, moderate-severe and no depressive symptom groups according to BDI.
no Depressive symptoms
mean±sD Median (Ir)
(n: 38)
Mild-Moderate Depressive symptoms
mean±sD Median (Ir)
(n: 26)
Moderate-Severe Depressive symptoms mean±sD Median (Ir)
(n: 9)
p-values
Age (y) 69.13 ± 5.58 70.91 ± 7.56 74.36 ± 6.94 < .05*
Gender F/M 23/15 13/13 5/4 .565
Dialysis modality (HD/PD) 22/16 21/5 7/2 .081
Dialysis duration (mo) 69.39 ± 44.03 68.88 ± 59.86 48.55 ± 49.18 .524
PSQI (0-21) 3.63 ± 0.99 4.16 ± 1.34 6.27 ± 1.90 < .0001**< .0001*
SGA (0-7) 6.15 ± .71 4.88 ± 1.45 3.01 ± 1.65 < .0001**< .0001*
< .0001†
Body mass index (kg/m2) 28.09 ± 3.75 22.86 ± 3.78 22.96 ± 3.76 < .0001*
< .005†
Hemoglobin (g/dL) 11.09 ± 2.05 12.07 ± 1.22 10.96 ± 2.42 .091
Ferritin (mg/dL) 436.94 ± 245.32 412.34 ± 298.59 433.37 ± 396.77 .944
Blood urea nitrogen (mg/dL) 67.55 ± 20.64 67.84 ± 21.09 61.00 ± 25.90 .684
Creatinine (mg/dL) 9.71 ± 2.35 7.87 ± 3.00 8.74 ± 3.28 < .05†
Calcium (mg/dL) 9.30 (1.03) 9.15 (1.45) 9.40 (1.45) .991
Phosphorus (mg/dL) 5.34 ± 1.56 4.73 ± 0.92 4.96 ± 2.31 .284
Ca x P product 49.16 ± 16.05 43.28 ± 13.28 49.35 ± 24.95 .343
Total cholesterol (mg/dL) 182.78 ± 48.15 191.96 ± 47.23 162.85 ± 32.88 .340
Triglycerides (mg/dL) 194.63 ± 72.63 179.80 ± 93.09 123.85 ± 48.05 .108
Uric acid (mg/dL) 6.61 ± 1.95 6.69 ± 1.38 6.51 ± 1.53 .970
Albumin (g/dL) 4.22 ± 0.25 3.96 ± 0.47 3.38 ± 0.48 <.0001**< .0001*
< .05†
PTH (pg/mL) 406.79 ± 330.87 328.38 ± 207.79 327.01 ± 370.12 .573
C-reactive protein (mg/dL) 7.94 ± 4.6 8.52 ± 7.1 16.51 ± 6.33 < .0001*< .001**
BDI: Beck Depression Inventory, pSQI: Pittsburgh Sleep Quality Index, sGA: Subjective Global Assessment Score
* p values for differences between patients with no depressive symptoms and patients with moderate-severe depressive symptoms
5. Parker KP, Kutner NG, Bliwise DL, Bailey JL, Rye DB: Nocturnal sleep, daytime sleepiness and quality of life in stable patients on hemodialysis. Health Qual Life Outcomes 2003; 1: 68
6. Taskapan H, Ates F, Kaya B, Emul M, Kaya M, Taskapan C, Sahin I: Psychiatric disorders and large interdialytic weight gain in patients on chronic haemodialysis. Nephrology (Carlton) 2005; 10 (1): 15-20 7. Kalender B, Ozdemir AC, Koroglu G: Association of depression
with markers of nutrition and inlammation in chronic kidney disease and end-stage renal disease. Nephron Clin Pract 2006; 102 (3-4): e115-121
8. Koo JR, Yoon JY, Joo MH, Lee HS, Oh JE, Kim SG, Seo JW, Lee YK, Kim HJ, Noh JW, Lee SK, Son BK: Treatment of depression and effect of antidepression treatment on nutritional status in chronic hemodialysis patients. Am J Med Sci 2005; 329 (1):1-5 9. Kalantar-Zadeh K, Kopple JD: Relative contributions of nutrition
and inlammation to clinical outcome in dialysis patients. Am J Kidney Dis 2001; 38 (6): 1343-1350
10. Laws RA, Tapsell LC, Kelly J: Nutritional status and its relationship to quality of life in a sample of chronic hemodialysis patients. J Ren Nutr 2000; 10 (3): 139-147
11. Enia G, Sicuso C, Alati G, Zoccali C: Subjective global assessment of nutrition in dialysis patients. Nephrol Dial Transplant 1993; 8 (10): 1094-1098
12. Clinical practice guidelines for nutrition in chronic renal failure. K/ DOQI, National Kidney Foundation. Am J Kidney Dis 2000; 35 (6 Suppl 2): 1-140
13. Richter P, Werner J, Heerlein A, Kraus A, Sauer H: On the validity of the Beck Depression Inventory. A review. Psychopathology 1998; 31 (3): 160-161
14. Buysse, DJ, Reynolds CF 3rd, Monk TH, Berman SR, Kupfer DJ: The Pittsburgh Sleep Quality Index: A new instrument for psychiatric practice and research. Psychiatry Res, 1989; 28 (2): 193-213
15. German L, Feldblum I, Bilenko N, Castel H, Harman-Boehm I, Shahar DR: Depressive symptoms and risk for malnutrition among hospitalized elderly people. J Nutr Health Aging 2008; 12 (5): 313-318
16. Feldblum I, German L, Bilenko N, Shahar A, Enten R, Greenberg D, Harman I, Castel H, Shahar DR: Nutritional risk and health care use before and after an acute hospitalization among the elderly. Nutrition 2009; 25 (4): 415-420
17. Feldblum I, German L, Castel H, Harman-Boehm I, Bilenko N, Eisinger M, Fraser D, Shahar DR: Characteristics of undernourished older medical patients and the identiication of predictors for undernutrition status. Nutr J 2007; 6: 37
18. Parker KP, Kutner NG, Bliwise DL, Bailey JL, Rye DB: Nocturnal sleep, daytime sleepiness, and quality of life in stable patients on hemodialysis. Health Qual Life Outcomes 2003; 1: 68
19. Iliescu EA, Coo H, McMurray MH, Meers CL, Quinn MM, Singer MA, Hopman WM: Quality of sleep and health-related quality of life in haemodialysis patients. Nephrol Dial Transplant 2003; 18 (1): 126-132
and the malnutrition-inlammation score was independent risk factor for depression in peritoneal dialysis patients (27). Similarly Micozkadioglu et al reported an association between depressive indings and malnutrition-inlammation complex in hemodialysis patients (28). Supporting these indings, there is some evidence that major depression is accompanied by activation of the inlammatory response system, and that proinlammatory cytokines may play a role in the etiology of depression (29, 30), namely the relationship between depressive symptoms and inlammation may be bi-directional. Proinlammatory cytokines, which are commonly increased in ESRD patients, are responsible for increased protein catabolism, poor oral intake, and malnutrition in maintenance dialysis patients (31). Accordingly, proinlammatory cytokine-induced chronic inlammation could be a common cause of depression and malnutrition in chronic HD patients. It is plausible that depressive symptoms and inlammatory cytokines have direct or indirect effects on speciic areas of the brain and interact in several central nervous system pathways to change appetite, food intake, and nutritional status (32, 33).
Depending on our indings we think that depression and sleep disorders are important factors inluencing the nutritional status and could be independent risk factors for malnutrition in elderly ESRD patients. However it still seems that these psychological problems as well as malnutrition might be results of chronic inlammation in these patients. So we think that elderly ESRD patients with malnutrition should be well assessed for presence of any inlammatory status and/or psychological-sleep disorders that might accompany this clinical stiuation. Antidepressive treatment might improve nutritional status in this group of patients but chronic inlammation still seems to be the major problem.
ReFeRences
1. Collins AJ, Kasiske B, Herzog C, Chavers B, Foley R, Gilbertson D, Grimm R, Liu J, Louis T, Manning W, McBean M, Murray A, St Peter W, Xue J, Fan Q, Guo H, Li Q, Li S, Qiu Y, Li S, Roberts T, Skeans M, Snyder J, Solid C, Wang C, Weinhandl E, Zhang R, Arko C, Chen SC, Dalleska F, Daniels F, Dunning S, Ebben J, Frazier E, Hanzlik C, Johnson R, Sheets D, Wang X, Forrest B, Berrini D, Constantini E, Everson S, Eggers P, Agodoa L: Excerpts from the United States Renal Data System 2006 Annual Data Report. Am J Kidney Dis 2007; 49 (Suppl 1): A6-7, S1-296
2. Gul A, Aoun N, Trayner EM Jr: Why do patients sleep on dialysis? Semin Dial 2006; 19 (2): 152-157
3. Zimmermann PR, Poli de Figueiredo CE, Fonseca NA: Depression, anxiety and adjustment in renal replacement therapy: A quality of life assessment. Clin Nephrol 2001; 56 (5): 387-390
27. Li ZJ, An X, Mao HP, Wei X, Chen JH, Yang X, Zhou SF, Li ZB, Yu XQ: Association between depression and malnutrition-inlammation complex syndrome in patients on continuous ambulatory peritoneal dialysis. Int Urol Nephrol 2011; 43 (3): 875-882
28. Micozkadioglu H, Micozkadioglu I, Zumrutdal A, Erdem A, Ozdemir FN, Sezer S, Haberal M: Relationship between depressive affect and malnutrition-inlammation complex syndrome in haemodialysis patients. Nephrology 2006; 11 (6): 502-505 29. Maes M: Major depression and activation of the inlammatory
response system. Adv Exp Med Biol 1999; 461: 25-46
30. Leonard BE: The immune system, depression and the action of antidepressants. Prog Neuropsychopharmacol Biol Psychiatry 2001; 25 (4): 767-780
31. Owen WF Jr, Lew NL, Liu Y, Lowrie EG, Lazarus JM: The urea reduction ratio and serum albumin concentration as predictors of mortality in patients undergoing hemodialysis. N Engl J Med 1993; 329 (14): 1001-1006
32. Khalil AA, Lennie TA, Frazier SK: Understanding the negative effects of depressive symptoms in patients with ESRD receiving hemodialysis. Nephrol Nurs J 2010; 37 (3): 289-295
33. Kalantar-Zadeh K, Block G, McAllister CJ, Humphreys MH, Kopple JD: Appetite and inlammation, nutrition, anemia, and clinical outcome in hemodialysis patients. Am J Clin Nutr 2004; 80 (2): 299-307
20. Iliescu EA, Yeates KE, Holland DC: Quality of sleep in patients with chronic kidney disease. Nephrol Dial Transplant 2004; 19 (1): 95-99
21. Sabbatini M, Minale B, Crispo A, Pisani A, Ragosta A, Esposito R, Cesaro A, Cianciaruso B, Andreucci VE: Insomnia in maintenance haemodialysis patients. Nephrol Dial Transplant 2002; 17 (5): 852-856
22. Sabbatini M, Pisani A, Mirenghi F, Cianciaruso B, Crispo A: The impact of haemoglobin on the quality of sleep in haemodialysis patients: Which is the truth? Nephrol Dial Transplant 2003; 18 (1): 126-132
23. Rambod M, Bross R, Zitterkoph J, Benner D, Pithia J, Colman S, Kovesdy CP, Kopple JD, Kalantar-Zadeh K: Association of Malnutrition-Inlammation Score with quality of life and mortality in hemodialysis patients: A 5-year prospective cohort study. Am J Kidney Dis 2009; 53 (2): 298-309
24. Muscaritoli M, Molino A, Bollea MR, Rossi Fanelli F: Malnutrition and wasting in renal disease. Curr Opin Clin Nutr Metab Care 2009; 12 (4): 378-383
25. Kalantar-Zadeh K, Kopple JD, Block G, Humphreys MH: A malnutrition-inlammation score is correlated with morbidity and mortality in maintenance hemodialysis patients. Am J Kidney Dis 2001; 38 (6): 1251-1263