ORIGINAL ARTICLE
Depression, quality of life, and body composition in
patients with end-stage renal disease: a cohort study
Annerose Barros,
1Bartira E. da Costa,
1Claudio C. Mottin,
2Domingos O. d’Avila
11Programa de Po´s-Graduac
¸a˜o em Medicina e Cieˆncias da Sau´de (Nefrologia), Faculdade de Medicina, Pontifı´cia Universidade Cato´lica do Rio
Grande do Sul (PUCRS), Porto Alegre, RS, Brazil.2Programa de Po´s-Graduac
¸a˜o em Medicina e Cieˆncias da Sau´de (Cirurgia), Faculdade de
Medicina, PUCRS, Porto Alegre, RS, Brazil.
Objective:To prospectively evaluate depressive symptoms, nutritional status, and quality of life (QoL) and search for possible associations in patients with end-stage renal disease undergoing hemodialysis.
Methods:A cohort study of 104 adult patients with end-stage renal disease undergoing hemodialysis was conducted. Anthropometric, clinical, and biochemical variables were evaluated after a midweek hemodialysis session. The participants’ body composition was assessed by direct segmental multi-frequency bioimpedance analysis. The WHOQOL-Bref questionnaire was used to evaluate QoL. Participants were separated into two groups - depressive symptoms and no depressive symptoms - at inclusion and evaluated annually for 2 years thereafter using the Beck Depression Inventory. Survival analysis used the Kaplan-Meier method and Cox regression analysis for the goodness of fit of associated factors. All-cause mortality was the outcome of interest.
Results: Participants’ mean age was 55.3615.6 years, 60% were male, and the median time on hemodialysis was 17.5 (8.0-36.8) months. Thirty-two patients had depressive symptoms and a significantly lower QoL compared with the 72 patients in the no depressive symptoms group. The fitted outcome model showed that lean body mass had a protective effect against all-cause mortality (hazard ratio [HR] = 0.89; 95%CI 0.80-0.99; p = 0.038).
Conclusion: Depressive symptoms were highly prevalent in the cohort, and correlated with the physical and psychological components of the QoL life questionnaire, as well as with C-reactive protein and phosphorus levels. Lean body mass was protective for the assessed outcome.
Keywords: Body composition; hemodialysis; mortality; quality of life; depression
Introduction
The term psychonephrology was coined to designate psychiatric problems affecting patients with chronic kidney disease (CKD) or renal transplant recipients.
Depressive symptoms (DS) are the most frequent comorbidity among patients with end-stage renal disease (ESRD).1Major attention is currently paid to the detection of DS in patients undergoing hemodialysis (HD). Early diag-nosis of depression is often missed, owing to the similarities between DS and uremic symptoms. This might explain the lower prevalence of DS in the early stages of CKD.2 In patients with ESRD, however, its prevalence is up to three times greater than in the general population.3Furthermore, the strong emotional burden of severe illness may have profound effects on quality of life (QoL). Occasionally, DS occur in response to such stress, in connection with some underlying psychiatric disease or in a manner dependent on personal characteristics.4Additionally, pro-inflammatory cyto-kine-related genes may be involved in the etiology of DS.5
Many patients with ESRD start HD with some degree of malnutrition, possibly related to decreased appetite, dietary restrictions, or to the catabolic consequences of
uremia. These patients are more likely to experience poorer treatment outcomes6 and to exhibit the so-called malnutrition-inflammation-depression and arteriosclerosis (MIDA) complex. MIDA has been shown to be an inde-pendent risk factor for cardiovascular disease, and is associated with higher morbidity and mortality.7
DS appear to be associated with a higher mortality rate since the start of renal replacement therapy: patients presenting with DS may have a 2.7-fold higher risk of death than those without DS.8 As DS have a negative effect on QoL and are associated with increased mor-bidity and mortality, early diagnosis and treatment of these symptoms should be sought in all CKD patients, regardless of disease stage.9,10
The aim of the present study was to evaluate the presence of DS and their relationship with nutritional status, biochemical parameters, quality of life, and mortality in a cohort of ESRD patients undergoing HD.
Methods
This was a prospective cohort study of 104 prevalent and incident patients with ESRD undergoing HD at Hospital Sa˜o Lucas, Pontifı´cia Universidade Cato´lica do Rio Grande do Sul (PUCRS), Brazil. The study protocol was approved by the institutional Research Ethics Committee (protocol no. 10/05257), and written consent was obtained from all
Correspondence: Annerose Barros, Av. Ipiranga, 6690, CEP 90610-000, Porto Alegre, RS, Brazil.
E-mail: [email protected] Submitted Feb 11 2015, accepted May 28 2015.
participants prior to their enrollment. Only stable (arteriove-nous fistula as vascular access; no evidence of acute infection; ongoing treatment for 3 or more months; no recent hospitalization), adult, and literate patients were included. All participants were evaluated yearly after inclu-sion in the study. The following evaluation time points were defined: t0 (inclusion), t1 (1 year after inclusion), and t2 (2 years after inclusion). The cohort was censored for kidney transplantation for the sake of survival analysis. All-cause mortality was the outcome variable of interest.
A validated Portuguese-language version of the Beck Depression Inventory (BDI) questionnaire11 was used to evaluate the presence of DS.12 The cutoff point for the presence of DS was set at 15, which appears to be the most sensitive and specific score.13Individual perception of QoL was evaluated by the World Health Organization Quality of Life instrument-Abbreviated version (WHOQOL-Bref), which comprises 26 questions, divided into four domains: physical health, psychological, social relationships, and environment.14 Additionally, the malnutrition-inflammation score (MIS) was used to evaluate the malnutrition-inflammation syndrome.15
Anthropometric data (height and post-dialysis weight) were obtained at the end of a midweek HD session; the body mass index (BMI) was calculated as recommended (weight [kg]/ height squared [m2]). Body composition analysis was performed by the direct segmental multi-frequency bioimpe-dance method (InBody 520®, Biospace Co., Seoul, South Korea) and results used to classify nutritional status as underfat, standard, overfat, or obese.10,16 A venous blood sample was obtained at the start of the HD session. After centrifugation (10 minutes at 2,000 rpm), a serum aliquot was collected and frozen (-80 o
C) for later estimation of sensitivity C-reactive protein (hs-CRP), using a high-sensitivity turbidimetric method (Vitros®5.1 Fusion, Ortho Clinical Diagnostic, Rochester, NY, USA). Albumin, total cholesterol, HDL-cholesterol, triglycerides (LDL-choles-terol calculated by the Friedewald equation), creatinine, and phosphorus concentrations were determined by dry chemistry methods (Vitros®
5.1 Fusion, Ortho Clinical Diagnostic, Rochester, NY, USA) in the non-frozen aliquot. Blood cells were counted by flow cytometry (Sysmex XE-2100D, Sysmex Corporation, Kobe, Japan). Total iron-binding capacity was measured by a colorimetric ferrozine method (Labtest Diagno´stica S.A, Lagoa Santa, MG, Brazil).
Statistical analysis
Patients were allocated across two groups: DS and no DS. Variables are presented as mean and standard deviation (SD), median and interquartile range (IQR), or absolute and relative frequency, as appropriate. Between-group differ-ences in continuous variables were analyzed by Student’s ttest or the Mann-WhitneyUtest (with post-hoc Tukey test). The chi-square test (w2) or Fisher’s exact test were used to compare categorical variables. Correlations were analyzed by Pearson’s correlation or Spearman’s rank correlation coefficient. Survival and outcome-associated factors were analyzed by the Kaplan-Meier method (log rank test) and a Cox proportional hazards regression model.
To evaluate the effect of grouped data in the multiple measurements, a mixed linear model with adjustment for
time on HD was employed. For variables with a normal distribution, changes over time are presented as mean and SD, while asymmetrically distributed variables were first log-transformed and then presented as median and IQR. Student’sttest for repeated measures was used to evaluate changes in variables between groups over time. P-valuesp0.05 were considered statistically significant. All statistical analyses were carried out in IBM SPSS Statistics for Windows version 21.0.
Results
Of the 104 patients included in the cohort, 60% were male. The mean age was 55.3615.6 years, and the median time on HD was 17.5 (8.0-36.8) months. Laboratory tests revealed a well-nourished group, with a mean serum albumin level of 40.064.0 g/L, hemoglobin 110.0615.0 g/L, hematocrit 33.864.4%, creatinine 0.8460.27 mmol/L, phos-phorus 1.9060.58 mmol/L, and hs-CRP 7.0 (4.0-16.0) mg/L. At inclusion, the mean BMI was 25.364.5 kg/m2; fat body mass, 29.469.9 kg; lean body mass, 26.265.0 kg; body water percentage, 52.067.3%; and the median MIS score was 3.5 (2.0-5.0) points, indicating normal nutritional status or mild malnutrition. According to the adopted body composition classification, eight patients were underfat, 34 standard, 32 overfat, and 30 obese. Table 1 shows the baseline and interim laboratory results.
The BDI score ranged from 0 to 51. Thirty-two patients presented with DS. The mean overall WHOQOL-Bref questionnaire score was 75.2618.4 (range, 31.3 to 118.8 points). The lowest score was observed in the physical domain (10.7), which most significantly influenced QoL. The social relationships domain revealed better
perfor-mance (65.7619.0) compared with the remaining
domains. The mean physical, psychological, and environ-mental domain scores were 56.4616.3, 61.1615.3, and 63.4613.7 respectively.
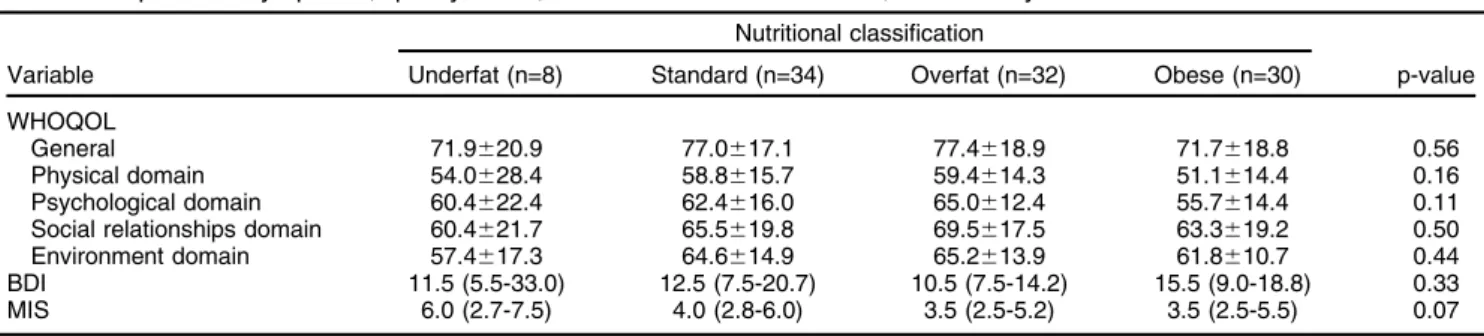
Comparison of the DS and no DS groups revealed no difference in age (54.1615.2 vs. 55.9615.9; p = 0.44), gender (53 vs. 62.5%; p = 0.37) or time on HD (20.5 [8.3-49.0] vs. 17.0 [7.3-30.8]; p = 0.30). Furthermore, no significant differences were verified regarding intensity of DS, level of QoL, or MIS score among groups classified by body fat percentage, as shown in Table 2.
rs= -0.487, po0.01; environment: r = -0.528, po0.01; general: rs= -0.501, po0.01).
Comparison of body composition between the DS and no DS groups showed no more than a trend toward significant difference, even after lean body mass and body fat percentage were independently evaluated (p = 0.07 and p = 0.07, respectively). Serum phosphorus concentration was
significantly higher in the no DS group (p = 0.04), as was hs-CRP (po0.01), with an upward trend over time in both groups. MIS scores did not differ significantly between groups; however, they increased significantly over time (p o0.01), independently from the presence of DS. Other clinical and biochemical parameters were not significantly different between groups at inclusion or over the follow-up Table 1 Biochemical parameters and depressive symptoms over the follow-up period
BDI score
Variable/time DS No DS p-value
Albumin (g/L)
t0 (n=32) (n=72) Baseline 0.67
40.064.0 40.064.0 Group 0.10
t1 (n=10) (n=39) Time 0.96
40.064.0 39.064.0 Timegroup 0.42
t2 (n=9) (n=20)
40.064.0 39.063.0
Phosphorus (mmol/L)
t0 (n=32) (n=72) Baseline 0.63
1.8460.55 1.9060.58 Group 0.04
t1 (n=10) (n=39) Time 0.56
1.6860.39 1.8760.65 Timegroup 0.09
t2 (n=9) (n=20)
1.5560.42 2.1360.58
hs-CRP (g/L)
t0 (n=32) (n=71) Baseline 0.43
6.0 (3.0-15.0) 7.0 (4.0-18.0) Group o0.01
t1 (n=10) (n=39) Time 0.58
4.0 (2.0-6.0) 10.0 (5.0-32.0) Timegroup 0.07
t2 (n=9) (n=20)
5.0 (2.0-13.0) 12.0 (4.0-41.0)
Total cholesterol (mmol/L)
t0 (n=32) (n=71) Baseline 0.22
4.0061.12 4.3261.23 Group 0.99
t1 (n=10) (n=39) Time 0.48
4.0861.37 4.3061.44 Timegroup 0.24
t2 (n=9) (n=20)
3.8561.31 4.2061.26
HDL-cholesterol (mmol/L)
t0 (n=32) (n=71) Baseline 0.64
1.0860.30 1.0460.27 Group 0.72
t1 (n=10) (n=39) Time 0.87
1.0960.27 1.0960.28 Timegroup 0.79
t2 (n=9) (n=20)
1.1360.27 1.0860.28
LDL-cholesterol (mmol/L)
t0 (n=32) (n=68) Baseline 0.14
1.92 (1.56-2.65) 2.36 (1.81-2.77) Group 0.50
t1 (n=10) (n=39) Time 0.67
1.63 (1.36-2.15) 2.05 (1.63-3.04) Timegroup 0.33
t2 (n=9) (n=19)
1.56 (1.03-2.59) 2.30 (1.36-3.11)
Triglycerides (mmol/L)
t0 (n=32) (n=71) Baseline 0.32
3.41 (2.15-5.66) 3.83 (2.65-5.93) Group 0.57
t1 (n=10) (n=39) Time 0.17
4.19 (3.41-6.65) 4.10 (3.11-6.21) Timegroup 0.22
t2 (n=9) (n=20)
3.49 (2.30-6.50) 4.82 (2.47-6.06)
Data presented as mean6standard deviation or median (interquartile range).
period, nor in terms of the interaction between groups and time of follow-up.
There were 34 deaths overall, 11 (32%) in the DS group. No statistically significant difference in mortality rate was detected between groups (no DS = 76% vs. DS = 59%,
p = 0.17) in the 2-year evaluation period. Neither gender nor time on HD were among the factors possibly associa-ted with outcome. Age (hazard ratio [HR] = 1.04; 95%CI 1.01-1.08; p = 0.01) was directly related to the outcome, and lean body mass (HR = 0.89; 95%CI 0.80-0.99; p = 0.038) Table 2 Depressive symptoms, quality of life, and MIS scores at baseline, stratified by nutritional classification
Nutritional classification
Variable Underfat (n=8) Standard (n=34) Overfat (n=32) Obese (n=30) p-value
WHOQOL
General 71.9620.9 77.0617.1 77.4618.9 71.7618.8 0.56
Physical domain 54.0628.4 58.8615.7 59.4614.3 51.1614.4 0.16
Psychological domain 60.4622.4 62.4616.0 65.0612.4 55.7614.4 0.11
Social relationships domain 60.4621.7 65.5619.8 69.5617.5 63.3619.2 0.50
Environment domain 57.4617.3 64.6614.9 65.2613.9 61.8610.7 0.44
BDI 11.5 (5.5-33.0) 12.5 (7.5-20.7) 10.5 (7.5-14.2) 15.5 (9.0-18.8) 0.33
MIS 6.0 (2.7-7.5) 4.0 (2.8-6.0) 3.5 (2.5-5.2) 3.5 (2.5-5.5) 0.07
Data presented as mean6standard deviation or median (interquartile range).
BDI = Beck Depression Inventory; MIS = malnutrition-inflammation score; WHOQOL = World Health Organization Quality of Life instrument.
Table 3 Quality of life domains and depressive symptoms over the follow-up period
BDI score
WHOQOL/time DS No DS p-value
General
t0 (n=32) (n=72) Baseline o0.01
65.7615.0 79.4618.3 Group 0.22
t1 (n=10) (n=38) Time 0.26
75.1619.8 76.7616.6 Timegroup 0.02
t2 (n=9) (n=19)
80.0617.1 78.0613.7 Physical domain
t0 (n=32) (n=72) Baseline o0.01
45.0615.0 61.5614.2 Group o0.01
t1 (n=10) (n=38) Time 0.94
52.568.3 58.4611.6 Timegroup 0.06
t2 (n=9) (n=19)
53.2611.8 56.6611.3
Psychological domain
t0 (n=32) (n=72) Baseline o0.01
50.0615.1 66.0612.7 Group 0.02
t1 (n=10) (n=38) Time 0.89
57.9614.3 60.5613.1 Timegroup o0.01
t2 (n=9) (n=19)
58.8612.2 59.7614.4
Social relationships domain
t0 (n=32) (n=72) Baseline o0.01
55.7619.0 70.1617.4 Group 0.02
t1 (n=10) (n=38) Time 0.83
62.5625.0 64.7625.6 Timegroup 0.32
t2 (n=9) (n=19)
58.3622.8 71.1616.5
Environment domain
t0 (n=32) (n=72) Baseline o0.01
55.5611.6 67.0613.1 Group 0.03
t1 (n=10) (n=38) Time 0.71
61.3616.3 62.4616.5 Timegroup 0.15
t2 (n=9) (n=19)
59.4614.0 66.1613.6
Data presented as mean6standard deviation.
had a protective effect. Conversely, DS, when stratified by nutritional status, did not relate to mortality.
Discussion
Significant DS occurred in 31% of the participants. These symptoms were strongly associated with hs-CRP and serum phosphorus concentration and weakly correlated with QoL. Patients with DS tended to have a lower survival rate in the 2-year evaluation period. DS prevalence was within the expected range even if a higher DS prevalence had been previously observed in a similar cohort, with the same evaluation instrument, but using a BDI score of 14 as the cutoff point.17Adopting different diagnostic criteria or cutoff points may produce significant variation in the prevalence of DS.13,18 Specific cutoff points have been recommended when using the BDI questionnaire to evaluate DS in patients with CKD - generally higher than those applied to the general population.19 Scores in our study cohort ranged from 0 to 51 (out of a possible 63).11 Some individuals did not exhibit DS, whereas others reported more intense symptoms. Although the difference was not statistically significant, participants in the DS group had been on HD for a longer period than those in the no DS group. Previous studies suggest that incident HD patients - during the first treatment year - are exposed to a higher DS burden.20,21 However, this finding is contra-dictory, as DS have been suggested to vary with CKD progression, being particularly dependent on clinical out-comes, complications, and adverse effects of HD.22 Possibly due to illness severity and to the demands of renal replacement therapy, patients with ESRD become frail and ineffective in the use of compensatory mechan-isms to overcome the minor conflicts of daily life. This may reinforce the impression that patients who have been on dialysis for longer experience more DS.
There is evidence that ESRD patients have compro-mised QoL, which deteriorates further as the DS burden increases.23,24HD therapy is critical for survival in ESRD, with patients unavoidably requiring at least one full-day session, three days a week. Devoting such a long time entirely to health maintenance certainly affects QoL. At inclusion, QoL scores differed between the DS and no DS groups; over time, QoL improved in the DS group, with increases in all WHOQOL scores, while patients in the no DS group had sustained or declining scores, which nevertheless remained higher than those of the DS group. These effects imply that QoL in patients undergoing HD may vary over time and in association with DS. All WHOQOL domains correlated with BDI scores, demon-strating consistency between the questionnaires.25
An association between inflammation and DS has been previously suggested. Pro-inflammatory cytokines (inter-leukin-6 and tumor necrosis factor-a) have been mea-sured at higher concentrations in patients presenting with DS as compared with non-depressed individuals. Cyto-kines are involved in the acute phase of the inflammatory response, but there is no evidence of a causal relation-ship in individuals with DS. However, DS may be accompanied by activation of the inflammatory response system.26 A higher hs-CRP level was found in the DS
group in another cohort study, suggesting an association between inflammation and DS.27 A similar relationship between inflammation and DS was verified in a cross-sectional study of patients undergoing HD. Those with DS had higher interleukin-6 and lower albumin levels.28 No association between hs-CRP and serum albumin level was observed in the present cohort. Cilan et al. reported higher concentrations of pro-inflammatory cytokines in an HD population compared with a control group; however, no significant difference between patients with or without DS was demonstrated.29Based on the available data, a relationship between DS, inflammation, and ESRD cannot be clearly demonstrated.
No significant difference in MIS scores was observed between the DS and no DS groups, although malnutrition and inflammation have been previously related to depression.7 There was a positive and significant varia-tion of MIS score over time, independent of the presence of DS, reinforcing the contribution of inflammation to the metabolic derangement that accompanies ESRD. Again, no relationship with DS prevalence was observed across nutritional status groups. The DS group had a significantly lower phosphorus concentration and a trend toward lower serum albumin levels, suggesting dietary inadequacy, which supports prior data.30
A relationship between BMI, serum albumin, and DS has been previously described.31,32However, the present study does not corroborate those findings. Our results only suggest a protective effect of lean body mass against all-cause mortality. Depressed individuals appear to have more body fat and less lean mass - a trend observed in this cohort. By jointly analyzing this observation and the strong correlation of BDI scores with WHOQOL physical domain scores, we may assume that patients in the DS group were less physically active.
DS and mortality are possibly associated in CKD. Occurrence of DS has been deemed a cause for increased risk of death in similar populations.33,34 However, no statistically significant difference in mortality rates was observed between groups. Zimmermann et al. followed a similar cohort of 125 patients for 8 years, and demon-strated that mortality rate was associated with age, treat-ment modality (HD or peritoneal dialysis), and occurrence of DS; kidney transplantation was the main mortality-lowering factor.35It is likely that after, a successful kidney transplant, patients who previously had DS experienced remission or reduction of their symptoms. The study underscores a correlation between age and all-cause mortality, which is to be expected in such a population.
This study’s strength derives from its prospective enroll-ment of participants with similar characteristics, recruited from a single HD unit, in a large enough number to support the observed differences. Nonetheless, some limitations must be mentioned. First, we enrolled prevalent and incident patients equally. However, time on HD did not correlate with the outcome of interest. Second, participants were not evaluated by a psychiatrist to establish a clinical diagnosis of depression - only a DS questionnaire (although validated and widely used) was administered.8
managed the imposed limitations of ESRD and HD in a positive manner, while others seemed unable to cope with the added burden. An association was found between DS and serum phosphorus concentration. BDI scores were significantly associated with the physical and psychological components of the WHOQOL-Bref questionnaire and with serum hs-CRP level, suggesting a relationship between DS and systemic inflammation. Nutritional markers did not correlate with DS. Lean body mass seemed protective for all-cause mortality. Properly designed, sequential evalua-tions of QoL and DS in patients with ESRD undergoing HD may establish new approaches for coping with this severe condition.
Acknowledgements
The authors thank all participants for their contribution to the study. AB was the recipient of a research grant from Conselho Nacional para o Desenvolvimento Tecnolo´gico e Cientı´fico (CNPq).
Disclosure
The authors report no conflicts of interest.
References
1 Levy NB. What is psychonephrology? J Nephrol. 2008;21:S51-3. 2 Palmer S, Vecchio M, Craig JC, Tonelli M, Johnson DW, Nicolucci A,
et al. Prevalence of depression in chronic kidney disease: systematic review and meta-analysis of observational studies. Kidney Int. 2013;84: 179-91.
3 Hedayati SS, Finkelstein FO. Epidemiology, diagnosis, and man-agement of depression in patients with CKD. Am J Kidney Dis. 2009;54:741-52.
4 Feroze U, Martin D, Reina-Patton A, Kalantar-Zadeh K, Kopple JD. Mental health, depression, and anxiety in patients on maintenance dialysis. Iran J Kidney Dis. 2010;4:173-80.
5 Bufalino C, Hepgul N, Aguglia E, Pariante CM. The role of immune genes in the association between depression and inflammation: a review of recent clinical studies. Brain Behav Immun. 2013;31: 31-47.
6 Dumler F, Kilates C. Prospective nutritional surveillance using bioe-lectrical impedance in chronic kidney disease patients. J Ren Nutr. 2005;15:148-51.
7 Choi MJ, Seo JW, Yoon JW, Lee SK, Kim SJ, Lee YK, et al. The malnutrition-inflammation-depression-arteriosclerosis complex is associated with an increased risk of cardiovascular disease and all-cause death in chronic hemodialysis patients. Nephron Clin Pract. 2012;122:44-52.
8 Chilcot J, Davenport A, Wellsted D, Firth J, Farrington K. An asso-ciation between depressive symptoms and survival in incident dialysis patients. Nephrol Dial Transplant. 2011;26:1628-34.
9 Andrade CP, Cruz MC, Urrutia M, Pereira O, Draibe SA, Nogueira-Martins LA, et al. Evaluation of depressive symptoms in patients with chronic renal failure. J Nephrol. 2010;23:168-74.
10 Barros A, da Costa BE, Poli de Figueiredo CE, Antonello IC, d’Avila DO. Nutritional status evaluated by multi-frequency bioimpedance is not associated with quality of life or depressive symptoms in hemo-dialysis patients. Ther Apher Dial. 2011;15:58-65.
11 Beck AT, Ward CH, Mendelson M, Mock J, Erbaugh J. An inventory for measuring depression. Arch Gen Psichiatry. 1961;4:561-71. 12 Gorestein C, Andrade LHSG. Inventa´rio de depressa˜o de Beck:
propriedades psicome´tricas da versa˜o em portugueˆs. Arch Clin Psi-quiatry. 1998;25:245-50.
13 Kimmel P, Cukor D, Cohen SD, Peterson RA. Depression in end-stage renal disease patients: a critical review. Adv Chronic Kidney Dis. 2007;14:328-34.
14 Development of the World Health Orgaziation WHOQOL-bref quality of life assessment. The WHOQOL Group. Psychol Med. 1998;28:551-8. 15 Kalantar-Zadeh K, Kopple JD, Block G, Humphreys MH. A malnutrition-inflammation score is correlated with morbidity and mortality in main-tenance hemodialysis patients. Am J Kidney Dis. 2001;38:1251-63. 16 Gallagher D, Heymsfield SB, Heo M, Jebb SA, Murgatroyd PR,
Sakamoto Y. Healthy percentages body fat ranges: an approach for developing guidelines based on body mass index. Am J Clin Nutr. 2000;72:694-701.
17 Diefenthaeler EC, Wagner MB, Poli-de-Figueiredo CE, Zimmermann PR, Saitovitch D. Is depression a risk factor for mortality in chronic hemodialysis patients? Rev Bras Psiquiatr. 2008;30:99-103. 18 Cohen SD, Norris L, Acquaviva K, Peterson RA, Kimmel PL.
Screening, diagnosis, and treatment of depression in end-stage renal disease patients. Clin J Am Soc Nephrol. 2007;2:1332-42. 19 Preljevic VT, Østhus TB, Sandvik L, Opjordsmoen S, Nordhus IH, Os
I, et al. Screening for anxiety and depression in dialysis patients: comparison of the Hospital Anxiety and Depression Scale and the Beck Depression Inventory. J Psychosom Res. 2012;73:139-44. 20 Watnick S, Kirwin P, Mahnensmith R, Concato J. The prevalence and
treatment of depression among patients starting dialysis. Am J Kid-ney Dis. 2003;41:105-10.
21 Chilcot J, Norton S, Wellsted D, Davenport A, Firth J, Farrington K. Distinct depression symptom trajectories over the first year of dia-lysis: associations with illness perceptions. Ann Behav Med. 2013;45:78-88.
22 Griva K, Davenport A, Harrison M, Newman S. An evaluation of ill-ness, treatment perceptions, and depression in hospital-vs. home-based dialysis modalities. J Psychosom Res. 2010;69:363-70. 23 Soni RK, Weisbord SD, Unruh ML. Health-related quality of life
out-comes in chronic kidney disease. Curr Opin Nephrol Hypertens. 2010;19:153-9.
24 Khalil AA, Abed MA. Perceived social support is a partial mediator of the relationship between depressive symptoms and quality of life in patients receiving hemodialysis. Arch Psychiatr Nurs. 2014;28:114-8. 25 Ricardo AC, Fischer MJ, Peck A, Turyk M, Lash JP. Depressive symptoms and chronic kidney disease: results from the National Health and Nutrition Examination Survey (NHANES) 2005-2006. Int Urol Nephrol. 2010;42:1063-8.
26 Dowlati Y, Herrmann N, Swardfager W, Liu H, Sham L, Reim EK, et al. A meta-analysis of cytokines in major depression. Biol Psy-chiatry. 2010;67:446-57.
27 Raison CL, Capuron L, Miller AH. Cytokines sing the blues: inflammation and the pathogenesis of depression. Trends Immunol. 2006;27:24-31. 28 Hung KC, Wu CC, Chen HS, Ma WY, Tseng CF, Yang LK, et al.
Serum IL-6, albumin and comorbidities are closely correlated with symptoms of depression in patients on maintenance haemodialysis. Nephrol Dial Transplant. 2011;26:658-64.
29 Cilan H, Oguzhan N, Unal A, Turan T, Koc AN, Sipahioglu MH, et al. Relationship between depression and proinflammatory cytokine levels in hemodialysis patients. Ren Fail. 2012;34:275-8.
30 Ng HJ, Tan WJ, Mooppil N, Newman S, Griva K. Prevalence and patterns of depression and anxiety in hemodialysis patients: a 12-month prospective study on incident and prevalent populations. Br J Health Psychol. 2015;20:374-95.
31 Preljevic VT, Østhus TB, Sandvik L, Bringager CB, Opjordsmoen S, Nordhus IH, et al. Psychiatric disorders, body mass index and C-reactive protein in dialysis patients. Gen Hosp Psychiatry. 2011;33: 454-61.
32 Hsu HJ, Yen CH, Chen CK, Wu IW, Lee CC, Sun CY, et al. Asso-ciation between uremic toxins and depression in patients with chronic kidney disease undergoing maintenance hemodialysis. Gen Hosp Psychiatry. 2013;35:23-7.
33 Palmer SC, Vecchio M, Craig JC, Tonelli M, Johnson DW, Nicolucci A, et al. Association between depression and death in people with CKD: a meta-analysis of cohort studies. Am J Kidney Dis. 2013;62:493-505.
34 Farrokhi F, Abedi N, Beyene J, Kurdyak P, Jassal SV. Association between depression and mortality in patients receiving long-term dialysis: a systematic review and meta-analysis. Am J Kidney Dis. 2014;63:623-35.