researchpaper
Temporal analysis of the reduction in gas emission in areas of
mechanically-harvested sugarcane using satellite imagery
Christiano Luna Arraes
1, Jesús Camacho-Tamayo
2, Teresa Tarlé Pissarra
3,
Célia P. Bueno
1,
and Sergio Campos
41Departamento de Suelos y Abonos and 3Departamento de Ingeniería Rural, Facultad de Ciencias Agronómicas y Veterinarias, Universidad Estatal Paulista, Jaboticabal, SP, Brasil. 2Programa de Ingeniería Agrícola, Universidad Nacional de Colombia, Sede Bogotá, Colombia. 4Departamento de Ingeniería Rural
Facultad de Ciencias Agronómicas y Veterinarias, Universidad Estatal Paulista, Botucatu, SP, Brasil.
Abstract
C. Luna Arraes, J. Camacho-Tamayo, T. Tarlé Pissarra, C.P. Bueno, and S. Campos. 2010. Temporal analysis of the reduction in gas emission in areas of mechanically-harvested sugarcane using satellite imagery. Cien. Inv. Agr. 37(1):113-121. The primary objective of this study was to estimate the amount of gas not emitted into the air in areas cultivated with sugarcane (Saccharum oficinarum) that were mechanically harvested. Satellite images CBERS-2/CCD, from 08-13-2004, 08-14-2005, 08-15-2006 and 08-16-2007, of northwestern São Paulo State were processed using the Geographic Information System (GIS)-IDRISI 15.0.
Areas of interest (the mechanically-harvested sugarcane ields) were identiied and quantiied
based on the spectral response of the bands studied. Based on these data, the amount of gas
that was not emitted was evaluated, according to the estimate equation proposed by the
Intergovernmental Panel on Climate Change (IPCC). The results of 396.65 km2 (5.91% for 2004); 447.56 km2 (6.67% for 2005); 511.54 km2 (7.62% in 2006); and 474.60 km2 (7.07% for 2007), calculated from a total area of 6,710.89 km2 with sugarcane, showed a signiicant increase of mechanical harvesting in the study area and a reduction of gas emissions of more than 300,000 t yr-1.
Key words: Geographic information system, orbital image, remote sensing, Saccharum
oficinarum.
Received 27 April 2009. Accepted 14 August 2009. Corresponding author: [email protected] Introduction
Sugarcane (Saccharum oficinarum L.) is one of the main agricultural products of Latin
Amer-ica, with ields covering an area of 89,336 km2.
The main Latin American producers are Brazil (56,317 km2), Mexico (6,400 km2) and Colombia
(4,317 km2), with a mean yield of 73.91; 75.58
and 92.69 t ha-1, respectively (FAO, 2008). Until
a few years ago, the harvesting system for sugar and alcohol production included burning the foliage before the sugarcane was cut, with the
consequent emission of ashes and combustion
gases. These gases contribute to the greenhouse effect and global warming, due to the increase of the concentrations of carbon dioxide (CO2), nitrous oxide (N2O) and methane (CH4).
me-chanical harvesters. This also contributes to improved soil properties by favoring carbon
se-questration.
In Latin America, Brazil is one of the countries where policies have been implemented to abol-ish burnings in sugarcane plantations. Some
regions have established speciic standards to
eliminate burnings, including the states of Mato Grosso do Sul, Goiás, Paraná and São Paulo. On September 19, 2002, Law 11.241 was enacted in the State of São Paulo, which created a gradual schedule for reducing sugarcane burning. This law, initiated in 2002, mandates that the prac-tice of burning must be completely eliminated by 2021 in mechanizable areas, and by 2031 in non-mechanizable areas with slopes greater than 12% (Moraes, 2007).
Due to increasing and easy-to-access informa-tion from remote sensing, and the recent in-corporation of new sensors with higher spatial, temporal and spectral resolutions, a better un-derstanding of the anthropic processes acting on the terrestrial system are now possible. Re-mote sensing, along with geoprocessing
tech-niques, has the potential to monitor agricultural
activities and supply reliable and objective in-formation on sowed areas and the productivity of crops (Terres et al., 1995; Ippoliti-Ramilo et al., 1999; Rizzi, 2004).
According to Sanches (2004), agricultural lifts obtained from remote sensing data are precise and objective, and along with a more detailed knowledge of the spectral behavior of the crops, allow for better data processing and analysis. Price (1999) showed that the combined use of these data can be used to explore areas of soil use and occupation.
The satellite, CBERS-2, features a synchronic orbit with the sun at 778 km, completing 14 revolutions a day around the Earth. This orbit
allows the satellite to cross the Equator at 13:30
GMT (10:30 a.m., local time in Brazil), thus capturing the same conditions of sun
illumina-tion to enhance comparison of images acquired
during different seasons (INPE, 2008).
A High Resolution Camera (Couple Charged Device-CCD) with a high spatial resolution (20 m) takes data from the same area every 26
days, in ive spectral channels: the blue region
B1 (450 to 520 nm), the green region B2 (520 to 590 nm), the red region B3 (630 to 690 nm), the infrared region B4 (770 to 890 nm) and the panchromatic region B5 (510 to 730 nm). Each image covers an area of 113 km2. These images
may be applied in agricultural studies to
iden-tify production zones, quaniden-tify areas of interest,
monitor the behavior of agricultural expansion,
quantify irrigation pivots, and estimate produc -tion (INPE, 2008).
It is fundamentally important to carry out a geo-reference of satellite images that is appropriate for the objective of a study, in order to determine
the localization of an image or vector ile in the space, as deined by a reference system of known coordinates (Eastman, 1998). An important igure to be considered is the root mean square (RMS)
of the georeference for each image, as mistakes may lead to incorrect conclusions if studies are done using a temporary scale. According to the Brazilian Cartographic Pattern of Accuracy (PEC) decree 89.817/1984, the error can have a maximum of 25 m for a 1:50,000 scale.
Considering the importance of sugarcane pro-duction and the use of tools for monitoring agricultural production in the world, the
objec-tive of our study was to identify and quantify
sugarcane areas with mechanical harvesting, as well as to estimate the amount of gases not emitted due to the absence of foliage burning. This study includes the years 2004 to 2007 and covers the northwest region of the State of São Paulo, Brazil.
Materials and methods
Area of study
The area of study covered 6,711 km2, located in
17’ 34” to 48º 26’ 28” longitude W). This area features a tropical climate, with an annual mean precipitation of 1,200 mm and a mean tempera-ture of 22 ºC during the summer and 18ºC dur-ing the winter. The altitude is between 578 and 722 m. The main forms of soil use and occupa-tion are as pastures and for the growth of sugar-cane and citrus fruits.
Image collection and processing
To construct a cartographic base of the study area, images from satellite CBERS-2 in TIFF format were obtained and converted to GEOTIIF format using the geographic information system (SIG)-IDRISI-15.0. This geoprocessing tool was used to obtain a visual analysis of the areas where
sug-arcane is mechanically harvested. The data col-lected by the CCD sensor (CCD High Resolution Camera) of satellite CBERS-2, in the color bands 3 (red), 4 (near infrared) and 2 (green) were used
to identify and quantify these areas.
The satellite images used were taken on August 13, 2004; August 14, 2005; August 15, 2006 and August 16, 2007, corresponding to orbit 156, point 127 of the satellite. These dates captured images of the zone of study under similar con-ditions, and because low or no cloudiness is characteristic in August, this guaranteed good
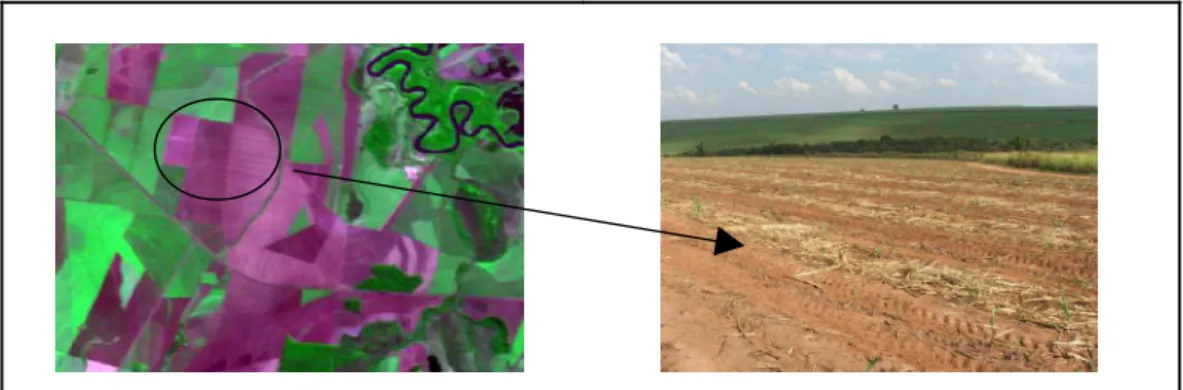
quality images as well as the same level of com -parison. The harvest zone of sugarcane, when collected mechanically, shows clear tones in the color composition (Figure 1), but when harvest-ed manually, shows bluish tones (Figure 2).
Figure 1. Spectral behavior of sugarcane areas with mechanical harvesting. Color composition 342 RGB (left) and image
obtained in the ield (right).
Figure 2. Spectral behavior of the sugarcane areas harvested manually. Color composition 342 RGB (left) and image
This difference is due to the presence of har-vest residues that are distributed uniformly in the soil during mechanical harvesting. In man-ual harvesting, the residues remaining at the surface do not cover the soil completely, and previous burning of sugarcane may reduce the amount of residues, increasing the proportion of exposed soil.
Therefore, before generating the tone composi-tion for each year, a georeference of bands 2, 3 and 4 was elaborated separately using the “Re-format/Resample” module of the SIG-IDRISI-15.0. We used topographic maps scanned at 300 dpi of the municipalities of Jaboticabal (SF-22 -X-D-III-3), Taiúva (SF-22-X-D-III-1) and Ri-beirão Preto (SF-23-V-C-I-I) in the State of São Paulo, at a 1:50.000 scale, and georeferenced the UTM projection (Universal Transversa de Mer-cator) with the horizontal Datum of the Corrego Alegre-22 Sur municipality.
In the process of geometric correction of the
digital images, 150 points were identiied, dis -tributed over the image surface. These points must be perfectly visible in both the image and in the topographic maps to allow a good band georeference. The geometric correction was
conirmed in ield using the Navegación Garmin
eTrex Vista Global Positioning System (GPS).
After the georeference was established, several points were used to outline the areas of study
(mechanically-harvested sugarcane ields), in
order to cover the maximum area possible on the colored georeferenced image.
Next, a spectral review was created using the “Makesig” module, and classiication was made using the “Piped” module. In the classiication,
soil with harvest residues due to mechanical
harvesting was identiied and differentiated.
The areas differentiated were outlined with
polygons on the image, creating a reference ile
for each category of use and occupation of soil.
Then, the images were classiied based on these data. Uncertain areas were conirmed in the ield, with the use of GPS.
Quantiication of surfaces cultivated with sugarcane
The sugarcane areas with mechanical
harvest-ing were quantiied for the years of study (2004,
2005, 2006 and 2007) using the “area” com-mand in the “Database Query” module. Based on these data, the amount of gases not emitted
was estimated, by the following the Equation,
as proposed by the Intergovernmental Panel on Climate Change (IPCC, 2006).
3
10
*
*
*
*
−=
Q C EE
A
M
F
F
G
where, GE: amount of gases emitted resulting from burning (CO2, CH4, N2O); A: burned area, ha; MQ: mass used for combustion, t ha-1; F
C:
combustion factor, and FE: emission factor, g kg-1 of burned dry matter.
For sugarcane, according to IPCC (2006), MQ is 6.5 t ha-1, equivalent to the burned residues
before harvest; FC is 0.80 for the gases emitted by combustion, and therefore, FE is 1,515 g kg-1
for CO2, 2.7 g kg-1 for CH
4 and 0.07 g kg -1 for
N2O.
Results and discussion
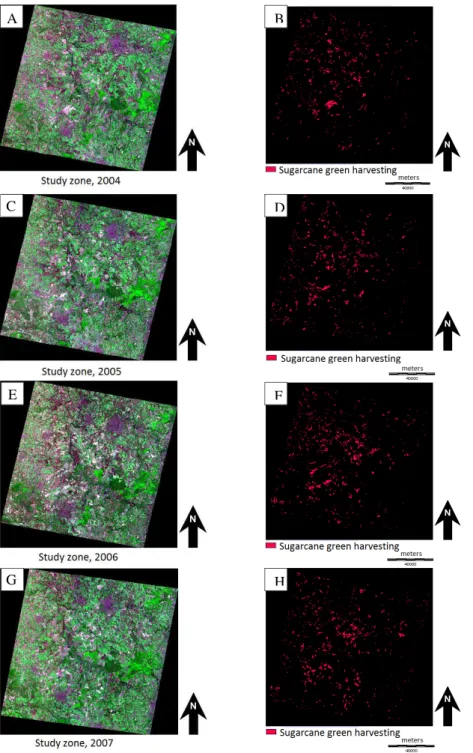
Initially, a zone of study was identiied using
A B
C D
E F
G H
Figure 3. False color images (3R4G2B), captured in 2004 (A), 2005 (C), 2006 (E) and 2007 (G) and classiications for the
Table 3. Area of mechanically-harvested sugarcane in the study area and gases retained by not burning the sugarcane before harvest. .
Year
Area AI1 Greenhouse gases retained, t
km2 % % CO
2 CH4 N2O
2004 396.65 5.91 - 312480.87 556.90 14.44
2005 447.56 6.67 12.83 352587.77 628.37 16.29
2006 511.54 7.62 28.96 402991.21 718.20 18.62
2007 474.6 7.07 19.65 373889.88 666.34 17.28
1AI: Area increased during the year 2004.
During the outlining of the sugarcane areas with
mechanical harvesting, it was conirmed that the
georeference of the topographic maps and the isolated bands conformed to the Brazilian Stan-dard for Cartographic Accuracy (PEC) decree 89.817/1984, as observed in Tables 1 and 2. The use of the images from satellite CBERS-2, in bands 3 (red), 4 (near infrared) and 2 (green),
allowed the identiication and differentiation of
the patterns of spectral responses for the area of interest. The spatial and spectral resolutions of the CCD instrument demonstrate that the use of
images is convenient for watching and monitor-ing agricultural and forest areas, as reported by other authors (Korontzi et al., 2008; McCarty
et al., 2008; Puni et al., 2008), especially in
ac-cidental or controlled ires.
Alter analyzing the spectral bands, an in-crease in the size of areas where mechani-cal harvesting is carried out was observed, showing an increase during the period be-tween 2004 and 2006 and a small reduction in 2007 (Table 3).
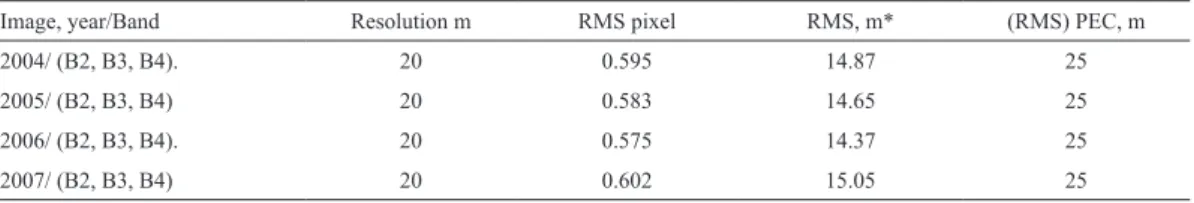
Table 1. Mean square error (EMS) for the satellite images, appropriate for the Brazilian Cartographic Accuracy Standard (PEC).
Image, year/Band Resolution m RMS pixel RMS, m* (RMS) PEC, m
2004/ (B2, B3, B4). 20 0.595 14.87 25
2005/ (B2, B3, B4) 20 0.583 14.65 25
2006/ (B2, B3, B4). 20 0.575 14.37 25
2007/ (B2, B3, B4) 20 0.602 15.05 25
*RMS (m) = [(RMS pixel)*(spatial resolution)]
Table 2. Mean square error (MSE) for topographic charts, appropriate to the Brazilian Standard for Cartographic Accuracy
(PEC).
Topographical card Resolution m RMS pixel RMS, m* RMS PEC, m
Jaboticabal 5 0.582 2.91 25
Taiúva 5 0.600 3.00 25
Ribeirão Preto 5 0.590 2.95 25
Additional climate sources show that the small reduction between 2006 and 2007 was due to higher pluviometric precipitation in April (54 mm), May (106 mm) and July (88 mm) of 2007, delaying the period of mechanical harvesting,
as sugarcane reineries commonly suspend me -chanical harvesting if precipitation is higher than 40 or 50 mm, due to excess humidity. Ac-cording to Aguiar et al. (2007), rain is the main inconvenience for harvesting, as rain directly affects the machinery.
A progressive increase of mechanically-har-vested areas was observed during the years studied, demonstrating an observance of the
state law and, consequently, a reduction of the
annual emission of combustion gases caused by the foliage burning (Table 3). The levels were 7,878 kg ha-1 for CO
2, 14.04 kg ha
-1 for CH 4 and
0.36 kg ha-1 for N 2O.
Campos (2003), found that mechanical harvest-ing reduced the emission of greenhouse effect gases by about 5 t ha-1 yr-1. Harvest residues
remain in the harvest system, and microbial activity and the decomposition process retain gases in the soil. Luca et al. (2008) found that
carbon ixation varied from 5,750 to 7,695 kg
ha-1 yr-1 of CO
2, in the irst 20 cm below ground,
3 years after the beginning of mechanical har-vesting.
Another aspect to be considered is the bal-ance of emitted greenhouse effect gases in the process of sugarcane production, including all aspects involved in the system (Möllersten et al., 2009), especially the use of supplies (seeds, pesticides and fertilizers) and the use of agri-cultural machinery, which varies according
to different crop activities (Withtreras et al.,
2009). Based on different requirements for
sugarcane production, Cerri et al. (2007) re-ported that with mechanical harvesting, com-pared to burning, around 1,275 kg ha-1 yr-1 of
CO2 is not emitted.
This systematic method provides coherent,
quantitative, spatial and temporally explicit
measurements, differentiating areas harvested mechanically from areas where sugarcane
fo-liage is burned. The results found here relect
only a three-month period of harvesting time, as once the harvest has been made, sugarcane begins its natural regeneration. Areas that have
been renewed recently are not identiied in the
images, as the soil remains uncovered. This pro-cess is carried out by farmers every 4 or 5 years using conventional farming methods. Therefore, in order to make an estimation of the mechan-ically-harvested areas during all the harvesting periods, it is advisable to take images over time
and make period ield visits, allowing consoli -dation of the information obtained.
From the results obtained in this study, it is possible to conclude that the SIG IDRISI-2.0
allowed fast and adequate results, and stored,
processed, transformed and analyzed informa-tion to achieve the proposed objective.
Bands 2, 3 and 4 of satellite CBERS-2/CCD
al-lowed differentiation and quantiication of the
Resumen
C. Luna Arraes, J. Camacho-Tamayo, T. Tarlé Pissarra, C.P. Bueno y S. Campos. 2010. Análisis temporal de reducción de emisión de gases en áreas de caña de azúcar cosechadas mecánicamente utilizando imágenes satelitales. Cien. Inv. Agr. 37(1):113-121. Este trabajo
tuvo por objetivo estimar temporalmente la cantidad de gases que dejaron de ser emitidos al aire,
en áreas cultivadas con caña de azúcar (Saccharum oficinarum), cosechadas mecánicamente, en el noroeste del Estado de São Paulo utilizando imágenes orbitales. Se utilizaron cuatro imágenes del satélite CBERS-2/CCD, con recepción los días 13/08/2004; 14/08/2005; 15/08/2006 e
16/08/2007, donde se procesó por medio del Sistema de Información Geográica (SIG) IDRISI 15.0. Fue posible, por medio de la clasiicación supervisada, identiicar y cuantiicar las áreas
de interés (caña cosechada mecánicamente) debido a las respuestas espectrales de las bandas estudiadas. Con base en estos datos, se valoró la cantidad de gases dejados de emitir, de acuerdo a la estimación propuesta por la Intergovernmental Panel on Climate Change (IPCC). Estas áreas calculadas corresponden a 396,65 km2 (5,91% para el 2004), 447,56 km2 (6,67% para el 2005); 511,54 km2 (7,62% para el 2006) y 474,60 km2 (7,07% para el 2007), de un total de 6710,89 km2 con caña de azúcar, presentando un aumento signiicativo de la cosecha mecanizada y reducción de emisión de gases de efecto invernadero, superior a 300.000 t año-1, para la zona de estudio.
Palabras clave: Imágenes orbitales, Saccharum oficinarum, sensoriamiento remoto, sistema
de información geográica.
References
Aguiar, D.A., W.F. Silva, F.F. Feitosa, F.G Gonçalves, R. Rizzi, and B.F.T. Rudorff. 2007. Análise Espa-2007. Análise Espa-cial da Colheita da Cana-de-Açúcar no Estado de
São Paulo: A Inluência da Precipitação. Pages
2231-2238. In: Memórias, XIII Simpósio Brasi-leiro de Sensoriamento Remoto, Florianópolis,
Brasil, Instituto Nacional de Pesquisas Espaciais
- INPE, 2007.
Campos, D.C de. 2003. Potencialidade do Sistema de Colheita Sem Queima da Cana-de-Açúcar Para
o Seqüestro de Carbono. Tesis de Doctorado en
Agronomía (Microbiología Agrícola), Escuela Superior de Agricultura Luiz de Queiroz, Univer-sidad de São Paulo, Piracicaba, Brasil. 103 pp. Cerri, C.E.P., G. Sparovek, M. Bernoux, W.E.
Easter-ling, J.M. Melillo, and C.C. Cerri. 2007. Tropi-2007. Tropi-cal agriculture and global warming: impacts and mitigation options. Scientia Agricola 64:83-99. Contreras, A.M., E. Rosa, M. Pérez, H. Van
Lan-genhove, and J. Dewulf. 2009. Comparative life cycle assessment of four alternatives for using by-products of cane sugar production. Journal of Cleaner Production 17:772–779.
Eastman, J.R. 1998. Idrisi for windows: Introdução e exercícios tutoriais. J. Ronald Eastman (eds.). Heinrich Hasenack and Eliseu Weber. UFRGS Centro de Recursos Idrisi, Porto Alegre, Brasil. 109 pp.
FAO. 2008. Faostat Agriculture. Food and Agricul-ture Organization of the United Nations (FAO). 2008. http://faostat.fao.org/site/601/default.aspx (Accessed: April, 2008).
INPE. 2008. Catálogo de imagens CBERS.
Institu-to Nacional de Pesquisas Espaciais (INPE). São
José dos Campos. Brasil. http://www.cbers.inpe. br. (Accessed: March, 2008).
IPCC. 2006. IPCC Guidelines for National Green-house Gas Inventories: Agriculture, forestry and others land use. v. 4. Intergovernmental Panel on Climate Change (IPCC).
Ippoliti-Ramilo, G.A. 1999. Imagens tm/ Landsat-5. da época de pré-plantio para a previsão de área de culturas de verão. Tesis de Maestría (Senso-riamento Remoto) – Instituto Nacional de
Pes-quisas Espaciais, São José dos Campos, Brasil.
183 pp.
Resolu-tion Imaging Spectroradiometer (MODIS). Jour-nal of the Air and Waste Management Associa-tion 58:1235-1239.
Luca, E.F. de, C. Feller, C.C. Cerri, B. Barthès, V. Chaplot, D.C. Campos, and C. Manechini. 2008.
Avaliação de atributos físicos e estoques de car
-bono e nitrogênio em solos com queima e sem queima de canavial. Revista Brasileira de Ciên -cia do Solo 32:789-800.
McCarty, J.L., T. Loboda, and S. Trigg S. 2008. A hy-A
hy-brid remote sensing approach to quantifying crop
residue burning in the United States. Applied En-gineering in Agriculture 24:515–527.
Möllersten, K., J. Yan, and J.R. Moreira. 2009. Po-tential market niches for biomass energy with CO2 capture and storage-Opportunities for en-ergy supply with negative CO2 emissions. Bio- Bio-mass and Bioenergy 25: 273-285.
Moraes, M.A.F.D. 2007. O mercado de trabalho da
agroindústria canavieira: desaios e oportunida -des. Economia Aplicada 11:605-619.
Price, J.J. 1999. Combining Multispectral Data of Different Spatial Resolution. IEEE Transactions
on Geoscience and Remote Sensing 37:1199-1203.
Punia, M, V.P. Nautiyal, and Y. Kant. 2008. Identify-ing biomass burned area patches of agriculture residue using satellite remote sensing data. Cur- Cur-rent Science (India) 94:1185-1190.
Rizzi, R. 2004. Geotecnologias em um Sistema de Estimativa de Produção de Soja: Estudo de Caso no Rio Grande do Sul. Tesis de Doctorado (Sen-soriamiento Remoto). Instituto Nacional de
Pes-quisas Espaciais, São José dos Campos, Brasil.
214 pp.
Sanches, I.A. 2004. Sensoriamento Remoto para Le-vantamento Espectro-Temporal e Estimativa de Area de Culturas Agrícolas. Tesis de Maestría en Sensoriamiento Remoto (INPE-10290-TDI/909),
Instituto Nacional de Pesquisas Espaciais, São
José dos Campos, Brasil. 172 pp.