Engineering
ISSN: 1809-4430 (on-line)
_________________________
2 Universidade Estadual Paulista “Júlio de Mesquita Filho”, Faculdade de Ciências Agrárias e Veterinárias/ Jaboticabal - SP, Brasil.
SHIFTS AND HARVESTING SYSTEMS ON QUALITY OF IMPURITIES SAMPLES IN SUGARCANE
Doi:http://dx.doi.org/10.1590/1809-4430-Eng.Agric.v37n3p510-519/2017
ALINE S. ALCANTARA1*, ANTONIO T. S. ORMOND2, PAULO R. DE SOUSA JÚNIOR2,
ROUVERSON P. DA SILVA2, ELIZABETH H. KAZAMA2
1*Corresponding author. Universidade Estadual Paulista “Júlio de Mesquita Filho”, Faculdade de Ciências Agrárias e Veterinárias/
Jaboticabal - SP, Brasil. E-mail: [email protected]
ABSTRACT: Semi-mechanical and mechanical harvesting methods may influence the content of
impurities in harvested sugarcane. This study aimed to evaluate the quality of three mechanical methods of sugarcane harvesting: one semi-mechanical, and two mechanical ones - self-performed and outsourced, during three working shifts. As quality indicators, both mineral and vegetal impurities were accounted. About 50 random samples were collected in the studied area during 35 harvest days and in three working shifts, for each harvesting method. Mineral impurities showed similar behavior for both self-performed and outsourced mechanical harvesting, thus displaying a low variability. On the other hand, vegetal impurities showed to be unstable for all three shifts. Additionally, the statistical process control analysis showed that the semi-mechanical method had the greatest variability.
KEYWORDS: mechanical harvesting, agricultural machinery, statistical process control,
Saccharum officinarum.
INTRODUCTION
Sugarcane mechanical harvesting is considered the most important process within the crop production since it controls operation costs and has an influence on raw material quality (SANTOS et al., 2014). Thus, studies on agricultural machinery and mechanization for sugarcane crops are essential to optimizing crop yields, farm operations, besides reducing costs (PELOIA et al., 2010).
In the mechanical harvesting of sugarcane, improper regulation of the harvester according to crop conditions, especially of its cleaning equipment, can increase the content of vegetal and mineral materials and, consequently, leading to losses of raw material (RAMOS et al., 2015).
Investments for improvement of mechanical field operations, in daytime and nighttime shifts, tend to increase but information availability is still lacking, therefore, further studies can improve the management and the quality of some operations (VOLTARELLI et al. 2013). One of the remaining drawbacks is the increasing levels of mineral impurities released into mechanically harvested sugarcane made with no natural lighting, i.e. at night (GIACHINI et al., 2016).
Statistical Process Control (SPC) can be very useful to determine changes in certain processes; however, its use to evaluate or control the quality of mechanical agricultural operations has still been done in a small scale (ZERBATO et al., 2014).
SPC has become more common in agriculture especially by using individual control charts or Shewhart charts. These charts can be an option for monitoring certain processes, analyzing the results and, subsequently, supporting decision-makings with the aim of improving process quality (TOLEDO et al., 2013; ZERBATO et al., 2014).
Given the aforementioned, analysing impurities in the harvested sugarcane can be an important quality indicator of this operation. Thus, this study used the statistical process control, as an analysis tool to assess the quality of three sugarcane mechanical harvesting methods (semi-mechanical, self-performed and outsourced mechanical) performed in three working shifts, using as quality indicators mineral and vegetal impurity contents in the harvested sugarcane load.
MATERIAL AND METHODS
Data were collected in a 1,700-ha area, which is located in farms belonging to the Usina Vale
sugar mill. The experimental area is in the city of Onda Verde – SP (Brazil), near the geodetic
coordinates 20°37'3" S and 49°18'1" W. The local climate is classified as Cwa according to the
Köppen’s classification, which is characterized by warm wet summers and dry winters.
The experimental design was based on a quality control standpoint, using the contents of mineral (soil) and vegetal (green leaves, straw, sugarcane tips, and weeds) impurities as indicators. The impurity levels were determined for 40 to 50 random sugarcane samples collected in areas where the harvesting methods were semi-mechanical, self-performed and outsourced mechanical, during three working shifts, namely A, B, and C.
In the first evaluation, sampling was carried out in a 10-year-old crop field, from March 23 to April 27 of 2015. The area was planted with the following sugarcane cultivars: RB835486, RB855035, RB855156, RB855453, RB925345, and RB966928, which have an average total
productivity of 77 t ha-1.
Samples of vegetal and mineral impurities were gathered from areas where harvesting was performed by semi-mechanical (SM) (previously burned), self-performed mechanical (MP) (using self-performed machinery), and outsourced mechanical (MT) (subcontracting harvest task), during three working shifts (7 a.m. to 3 p.m., 3 to 11 p.m., and 11 p.m. to 7 a.m).
A ValtraTM tractor, manufactured in 2001, was used for the semi-mechanical harvesting, being
rated at 132.38 kW (180 hp) and at 30 Hz (1800 rpm). Yet for the mechanical harvesting methods,
John DeereTM harvesters were used. In the self-performed harvesting, the used machine was
manufactured in 2010, and its engine was rated at 251 kW (342 hp) and at 35 Hz (2100 rpm). The
outsourced mechanical harvesting was performed by contractors using a John DeereTM harvester,
model 3520, manufactured in 2014, with engine rated at 279.5 kW (380 hp) and at 36.6 Hz (2200 rpm).
Sugarcane samples containing impurities were collected using an oblique probe sampler. These samples of raw material were taken from a truckload, being then sent to the laboratory located in the Vale sugar mill. After homogenization, a 10-kg sample of the material was weighed. Then, vegetal impurities, such as green leaves, straw, sugarcane tips, and weeds, were separated from the sample. Subsequently, mineral impurities, such as soil, were separated from the cake using a 5-mm mesh sieve.
The mineral impurities were quantified by calcination method, which was considered as the difference between ash contents in dirty (with mineral and vegetal impurities) and clean (sample of ten billets from each shift) sugarcane samples, being expressed, as usual, in kg of mineral impurity per ton of transported sugarcane.
variation due to uncontrolled process factors (special factors), being estimated based on the standard deviation of the variables, as shown in eqs (1) and (2).
3
x
LSC
(1)
3
x
LIC
(2) In which,UCL: upper control limit;
x
: variable overall average; : standard deviation,
LCL: lower control limit.
The formula MR / d2 is the best estimator of for an R graph, where d2 is a tabulated value,
and MR is the mean of the amplitudes.
The control charts were prepared considering a data series under control not to be autocorrelated nor stationary. Therefore, the graphs are expected to show a reliable performance. Non-autocorrelated data are independent (MONTGOMERY eta al., 2009).
These charts were used to evaluate operation quality using all above-mentioned variables as quality indicators. All quality indicators were used to plot the control charts, regardless of the normality assumption.
RESULTS AND DISCUSSION
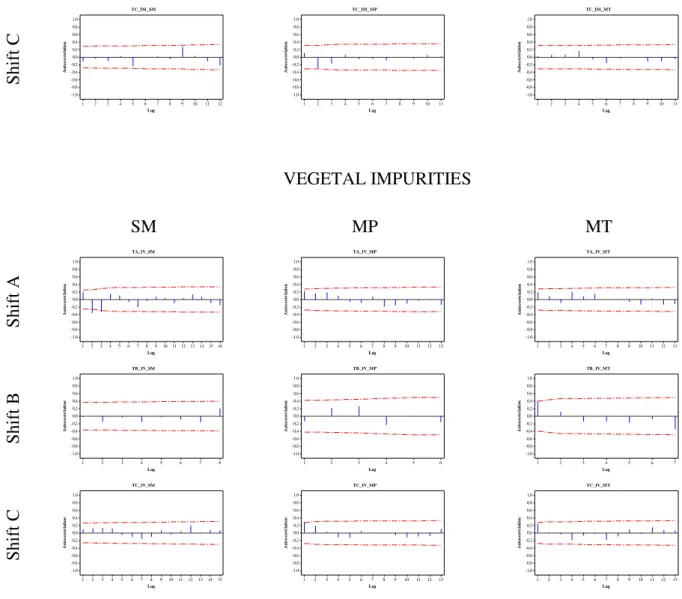
Non-autocorrelated data were independent within the analyzed lags (Figure 1). Yet the autocorrelated data were dependent, that is, above-average values tend to be followed by other values above the mean, the same trend occurs for values below the average. Such a trend indicates little differences between consecutive pairs of points, thus reducing the range of movement. This result implies lower limits, increasing the rate of false alarms (MONTGOMERY, 2004; VACCARO et al., 2011).
MINERAL IMPURITIES
SM MP MT
S hift C 12 11 10 9 8 7 6 5 4 3 2 1 1,0 0,8 0,6 0,4 0,2 0,0 -0,2 -0,4 -0,6 -0,8 -1,0 Lag A ut oc or re la ti on TC_IM_SM 11 10 9 8 7 6 5 4 3 2 1 1,0 0,8 0,6 0,4 0,2 0,0 -0,2 -0,4 -0,6 -0,8 -1,0 Lag A ut oc or re la ti on TC_IM_MP 11 10 9 8 7 6 5 4 3 2 1 1,0 0,8 0,6 0,4 0,2 0,0 -0,2 -0,4 -0,6 -0,8 -1,0 Lag A ut oc or re la ti on TC_IM_MT VEGETAL IMPURITIES
SM MP MT
S hift A 16 15 14 13 12 11 10 9 8 7 6 5 4 3 2 1 1,0 0,8 0,6 0,4 0,2 0,0 -0,2 -0,4 -0,6 -0,8 -1,0 Lag A ut oc or re la ti on TA_IV_SM 13 12 11 10 9 8 7 6 5 4 3 2 1 1,0 0,8 0,6 0,4 0,2 0,0 -0,2 -0,4 -0,6 -0,8 -1,0 Lag A ut oc or re la ti on TA_IV_MP 13 12 11 10 9 8 7 6 5 4 3 2 1 1,0 0,8 0,6 0,4 0,2 0,0 -0,2 -0,4 -0,6 -0,8 -1,0 Lag A ut oc or re la ti on TA_IV_MT S hift B 8 7 6 5 4 3 2 1 1,0 0,8 0,6 0,4 0,2 0,0 -0,2 -0,4 -0,6 -0,8 -1,0 Lag A ut oc or re la ti on TB_IV_SM 6 5 4 3 2 1 1,0 0,8 0,6 0,4 0,2 0,0 -0,2 -0,4 -0,6 -0,8 -1,0 Lag A ut oc or re la ti on TB_IV_MP 7 6 5 4 3 2 1 1,0 0,8 0,6 0,4 0,2 0,0 -0,2 -0,4 -0,6 -0,8 -1,0 Lag A ut oc or re la ti on TB_IV_MT S hift C 15 14 13 12 11 10 9 8 7 6 5 4 3 2 1 1,0 0,8 0,6 0,4 0,2 0,0 -0,2 -0,4 -0,6 -0,8 -1,0 Lag A ut oc or re la ti on TC_IV_SM 13 12 11 10 9 8 7 6 5 4 3 2 1 1,0 0,8 0,6 0,4 0,2 0,0 -0,2 -0,4 -0,6 -0,8 -1,0 Lag A ut oc or re la ti on TC_IV_MP 13 12 11 10 9 8 7 6 5 4 3 2 1 1,0 0,8 0,6 0,4 0,2 0,0 -0,2 -0,4 -0,6 -0,8 -1,0 Lag A ut oc or re la ti on TC_IV_MT
FIGURE 1. Autocorrelation function for mineral and vegetal impurities in sugarcane, at 5%
significance level for semi-mechanical, self-performed, and outsourced mechanical
harvesting methods in three working shifts.
The analysis of operational quality only by means of individual control charts may be hampered since it requires detection and interpretation of random patterns (cluster, mixture, trend, and oscillating) by the evaluators. Therefore, the evaluators should have full knowledge of the entire process, besides of knowing the statistical parameters ruling these patterns (VOLTARELLI et al., 2015). Ergo, we used the run charts.
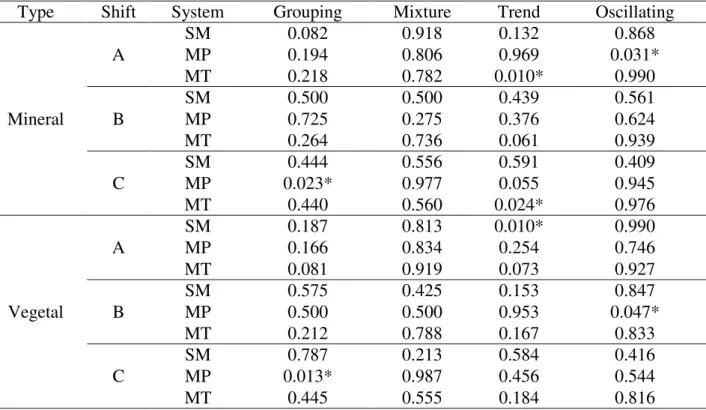
An analysis of the run charts in Table 1 reveals a non-random oscillating and trend patterns for mineral impurities in shift A, both for self-performed and outsourced mechanical harvesting methods, respectively; and in shift C, grouping and trend patterns were observed for the same methods, respectively.
TABLE 1. Standard probability values of the run charts for the quality indicators.
Type Shift System Grouping Mixture Trend Oscillating
Mineral
SM 0.082 0.918 0.132 0.868
A MP 0.194 0.806 0.969 0.031*
MT 0.218 0.782 0.010* 0.990
SM 0.500 0.500 0.439 0.561
B MP 0.725 0.275 0.376 0.624
MT 0.264 0.736 0.061 0.939
SM 0.444 0.556 0.591 0.409
C MP 0.023* 0.977 0.055 0.945
MT 0.440 0.560 0.024* 0.976
Vegetal
SM 0.187 0.813 0.010* 0.990
A MP 0.166 0.834 0.254 0.746
MT 0.081 0.919 0.073 0.927
SM 0.575 0.425 0.153 0.847
B MP 0.500 0.500 0.953 0.047*
MT 0.212 0.788 0.167 0.833
SM 0.787 0.213 0.584 0.416
C MP 0.013* 0.987 0.456 0.544
MT 0.445 0.555 0.184 0.816
**A- Grouping; M- Mixing; T- Trend; O- Oscillating; * non-random standard values detected by the probability test at p<0,05.
The quality of raw material can explain the trend, oscillating, and grouping non-random patterns observed for vegetal impurity. According to MARQUES et al. (2014), after fully harvesting (with leaves and tips), sugarcane samples undergo technical analysis in the industries, demonstrating that the presence of straw and impurities impairs its quality.
Conversely, for the mineral impurity indicator, oscillating and trend (Shift A), and grouping and trend (shift C) patterns were observed for self-performed and outsourced mechanical methods, respectively, evidencing small sampling variations in the individual control charts. This result may be acceptable for this parameter since the harvesters were not equipped with a floating mechanism.
Finally, as a complement to this analysis, it is necessary to use individual and moving range charts to verify whether the process is being affected by extrinsic factors. These factors are known as the 6 M's (machine, manpower, materials, methods, measures, and mother nature), through which we can enquire about whether a certain process is predictable or not (VOLTARELLI et al., 2013).
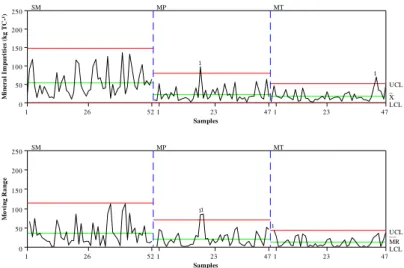
The control chart for mineral impurities in shift A (Figure 2) showed that both self-performed and outsourced mechanical harvesting had outliers above the upper control limit, evidencing the occurrence of special factors in individual and moving range charts, as well as in run chart.
Still, despite showing one outlier, the outsourced mechanical working front (MT) had less variability, i.e. points were close to the upper and lower control limits. The new machinery used and the technological innovations might be the cause of this result.
47 23
1 47 23
1 52 26
1 250
200
150
100
50
0
Samples
M
ine
ra
l I
m
pu
ri
ti
es
(k
g
TC
-¹
)
_ X UCL
LCL
SM MP MT
47 23
1 47 23
1 52 26
1 250
200
150
100
50
0
Samples
M
ov
in
g
R
an
ge
__ MR UCL
LCL
SM MP MT
1 1
1 1
1
FIGURE 2. Control charts for mineral impurities (kg TC-1) in shift A for the three mechanical
harvesting methods. (a) Individual control chart. (b) Moving range chart. UCL: Upper control limit. LCL: Lower control limit. : Average. AM: Average moving range.
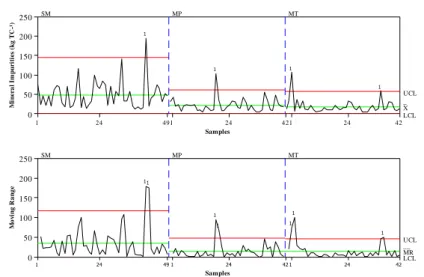
Regarding mineral impurity control charts for shift B, shown in Figure 3, the three harvesting methods presented outliers. It might have contributed to an increasing variability in the semi-mechanized process. This finding could have been caused by sugarcane loading along with mineral impurities to the truck through grab loaders.
Both self-performed and outsourced mechanized methods had points closer to the average
impurity content, being of 21.4 and 18.3 kg TC-1, respectively. In cane fields where plants have a
more upright growing habit, using tip cutters prevents the loading of such vegetal material into the cargo trucks and, consequently, vegetable impurity values become lower (RAMOS et al., 2014).
Likewise, the same performance was observed for the moving range charts.
22 11 1 26 13
1 28 14
1
250 200 150 100 50 0
Samples
M
in
er
al
I
m
pu
ri
ti
es
(k
g
TC
-¹
)
_ X UCL
LCL
SM MP MT
22 11 1 26 13
1 28 14
1
250 200 150 100 50 0
Samples
M
ov
in
g
R
an
ge
UCL
LCL
SM MP MT
__ MR
1 1
1 1
1 1
1 1 1
FIGURE 3. Individual control charts for mineral impurities (Kg TC-1) in shift B for the three
sugarcane mechanical harvesting methods. (a) Individual control charts. (b) Moving
range chart. UCL: Upper control limit; LCL: Lower control limit; : Average; A̅M̅:
Average moving range.
Both self-performed and outsourced mechanized methods had points closer to the average
impurity content, being of 21.5 and 17.9 kg TC-1, respectively. The same performance was observed
for the moving range charts.
42 24
1 42 24
1 49 24
1
250 200 150 100 50 0
Samples
M
in
er
al
I
m
pu
ri
ti
es
(k
g
TC
-¹
)
_ X UCL
LCL
SM MP MT
42 24
1 42 24
1 49 24
1
250 200 150 100 50 0
Samples
M
ov
in
g
R
an
ge
__ MR UCL
SM MP MT
LCL
1 1
1 1
1 1
1 1
1 1
1
FIGURE 4. Control charts for mineral impurities (Kg TC-1) in shift C for the three sugarcane
mechanical harvesting methods. (a) Individual control charts (b) Moving range chart.
UCL: Upper control limit; LCL: Lower control limit; : Average. A̅M̅: Average
moving range.
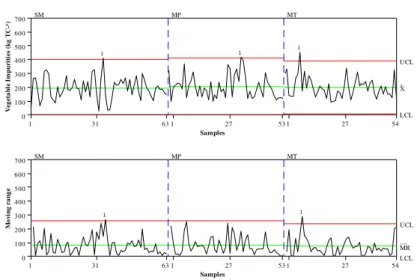
Figure 5 displays the control charts for the variable vegetal impurity in Shift A. In these, it is possible to observe at least one outlier above the upper control limit for the three harvesting methods, which makes them unstable processes. Regarding the process variability, all three
methods behaved similarly, presenting on average 191 kg TC-1 for individual control charts.
The increase of vegetable impurities in self-performed and outsourced mechanized methods may be related to the fact that plants were harvested unburned. As reported by GIMENEZ et al. (2016), unburned crops increased in 15% plant (straw, billets, and green leaves) and mineral impurities added to industrial processing.
Both charts presented high sampling variability, i.e. outliers far away from the average. One of the reasons might have been the coincidence of harvest time and local rainy season, hampering an efficient burning of sugarcane crops for later harvesting. Hence, a lot of vegetable impurities were added into the semi-mechanized method.
54 27 1
53 27
1 63 31
1 700
600
500
400
300
200
100
0
Samples
V
eg
et
ab
le
I
m
pu
ri
ti
es
(k
g
TC
-¹
)
_ X UCL
LCL
SM MP MT
54 27 1
53 27
1 63 31
1 700
600
500
400
300
200
100
0
Samples
M
ov
in
g
ra
ng
e
__ MR UCL
SM MP MT
LCL
1 1
1
1 1
FIGURE 5. Control charts for vegetal impurities (Kg TC-1) in shift A for the three sugarcane
mechanical harvesting methods. (a) Individual control charts (b) Moving range charts. UCL: upper control limit. LCL: Lower control limit; : Average; AM: average moving range.
Figure 6 shows the individual control charts for vegetal impurities in shift B. It is noteworthy that the lowest variability occurred for the outsourced mechanical harvesting, despite the upper limit outlier. In this case, while working with control charts, CAMPOS et al. (2008) suggest a removal of 5% of the discrepant data, thus remaining more than 95% of the points within control limits, making the process stable.
The moving range charts showed that although most of the data of all three harvesting methods were close to the average, the presence of outliers increased process variability and, consequently, increasing the averages of vegetal impurity for this shift.
26 13
1 24 12 1
31 15
1
700 600 500 400 300 200 100 0
Samples
V
eg
et
ab
le
I
m
pu
ri
ti
es
(k
g
TC
-¹
)
_ X UCL
LCL
SM MP MT
26 13
1 24 12 1
31 15
1
700 600 500 400 300 200 100 0
Samples
M
ov
in
g
R
an
ge
__ MR UCL
SM MP MT
LCL
1 1
1 1
1
FIGURE 6. Individual control charts for vegetal impurities (Kg TC-1) in shift B for the three
sugarcane mechanical harvesting methods. (a) Individual control charts (b) Moving range charts. UCL: upper control limit. LCL: Lower control limit; : Average; AM: average moving range.
The moving range charts had the same variability performance as the individual ones for all harvesting methods; however, the self-performed method had no outliers.
50 25
1 51 25
1 58 29
1
700 600 500 400 300 200 100 0
Samples
V
eg
et
ab
le
I
m
pu
ri
ti
es
(k
g
TC
-¹
)
_ X UCL
LCL
SM MP MT
50 25
1 51 25
1 58 29
1
700 600 500 400 300 200 100 0
Samples
M
ov
in
g
R
an
ge
__ MR UCL
SM MP MT
LCL
1
1 1
1
1 1 1
1
FIGURE 7. Individual control charts for vegetal impurities (Kg TC-1) in shift C for the three
sugarcane mechanical harvesting methods. (a) Individual control charts (b) Moving range charts. UCL: upper control limit. LCL: Lower control limit; : Average; AM: average moving range
CONCLUSIONS
Both self-performed and outsourced mechanized harvesting showed similar performance regarding the content of mineral impurities, both with an improved process quality.
Regarding the vegetal impurities, the processes performed in the three shifts were unstable and had similar variability.
Within a quality control context, the semi-mechanized method showed the greatest variabilities.
REFERENCES
CAMPOS, C. M.; MILAN, M.; SIQUEIRA, L. F. F. Identificação e avaliação de variáveis críticas
no processo de produção da cana-de-açúcar. Engenharia Agrícola, Jaboticabal, v. 28, n. 3, p.
554-564, set. 2008. DOI: 10.1590/S0100-69162008000300016
GIACHINI, C. F.; RAMOS, C. R. G.; LANÇAS, K. P.; LYRA, G. A.; MILLANI, T. M. Consumo
de combustível e perdas de cana-de-açúcar durante a colheita diurna e noturna. Energia na
Agricultura, Botucatu, v. 31, n. 1, p. 10-16, 2016.
GIMENEZ, A. Z.; FRANZÉ, R. V.; MADALENO, L. L.Teores de impurezas vegetais e a
concentração do amido no caldo de cana. Ciência & Tecnologia, Jaboticabal, v. 8, n. 1, p. 42-54, 2016.
GRAY, G. R.; MAGALHÃES, P. S. G.; BRAUNBECK, A. O. Suspensão pantográfica para corte
de base de cana-de-açúcar. Ciência Rural, Santa Maria, v.39, n. 3, p.766-771, maio/jun. 2009.
DOI: 10.1590/S0103-84782008005000096
MARQUES, T. A.; JUNIOR, E. L. D.; RAMPAZO, É. M.; MARQUES, P. A. A. Palhiço, polímero hidrogel e sistemas de plantio nos parâmetros de biometria, tecnologia, energia e produtividade de
cana-de-açúcar. Bioscience Journal, Uberlândia, v. 30, n. 5, p.501-511. 2014. Disponível em:
MONTGOMERY, D. C. Introdução ao controle estatístico da qualidade. 4. ed. Rio de Janeiro: LTC. 2004. p. 513.
MONTGOMERY, D. C.; RUNGER G. C.; HUBELE N. F. Engineering statistics, New York:
John Wiley & Sons, 2009.
PELOIA, P. R.; MILAN, M.; ROMANELLI, T. L. Capacity of the mechanical harvesting process
of sugarcane billets. Scientia Agricola, Piracicaba, v. 67, p. 619-623, 2010.
RAMOS, C. R. G.; LANÇAS, K. P.; SANDI, J.; LYRA, G. A.; MILLANI, T. M. Qualidade do corte dos rebolos na colheita mecanizada da cana-de-açúcar em diferentes condições
operacionais. Energia na Agricultura, Botucatu, v. 30, n. 3, p. 217-224, 2015.
RAMOS, C. R. G.; LANÇAS, K. P.; DE LYRA, G. A.; MILLANI, T. M. Qualidade da colheita mecanizada de cana-de-açúcar em função da velocidade de deslocamento e rotação do motor da
colhedora. Energia na agricultura, Botucatu, v. 29, n. 2, p.87-94. 2014.
DOI: 10.17224/EnergAgric.2014v29n2p87-94
SANTOS, N. B. D.; SILVA, R. P.; JUNIOR, C. G. D. Economic analysis for sizing of sugarcane
(Saccharum spp.) mechanized harvesting. Engenharia Agrícola, Jaboticabal, v. 34, n. 5, p.
945-954, 2014. DOI: 10.1590/S0100-69162014000500013
TOLEDO, A.; SILVA, R. P.; FURLANI, C. E. A. Quality of cut and basecutter blade configuration
for the mechanized harvest of green sugarcane. Scientia Agricola, Piracicaba, v. 70, n. 6, p.
384-389, nov./dez. 2013. DOI: 10.1590/S0103-90162013000600002
VACCARO, G. L. R.; MARTINS, J. C.; MENEZES, T. M. Análise estatística da qualidade de
níveis de tensão em sistemas de distribuição de energia elétrica. Produção, São Paulo, v. 21, n. 3, p.
539-552, jul./set. 2011. DOI: 10.1590/S0103-65132011005000047
VOLTARELLI, M. A., DA SILVA, R. P., ZERBATO, C., PAIXÃO, C. S. S. Monitoramento das perdas no processo de colheita mecanizada de tomate industrial/monitoring of losses in the process
of mechanical harvesting of tomato. Engenharia na Agricultura, Viçosa, MG, v. 23, n. 4, p. 315,
2015.
VOLTARELLI, M. A.; SILVA, R. P.; ROSALEN, D. L.; ZERBATO, C.; CASSIA, M. A. Quality of performance of the operation of sugarcane mechanized planting in day and night
shifts. Australian Journal Crop Science, Brisbane, v. 7, n. 9, p. 1396-1406, 2013. Disponível em:
<http://www.cropj.com/voltareli_7_9_2013_1396_1406.pdf>. Acesso em: 8 mar. 2015.
VOLTARELLI, M. A.; SILVA, R. P.; ZERBATO, C.; SILVA, V. F. A.; CAVICHILI, F. A.
Agronomic capability of mechanized sugarcane planting (2014). Australian Journal of Crop
Science. Brisbane, v. 8, n. 10, p.1448-1460. 2014. Disponível em:
<http://www.cropj.com/voltarlli_8_10_2014_1448_1460.pdf>. Acesso em: 8 mar. 2015.
ZERBATO, C.; FURLANI, C. E. A.; VOLTARELLI, M. A.; BERTONHA, R. S.; SILVA, R. P.
Quality control to seeding methods and densities in peanut crop. Australian Journal Crop
Science, Brisbane, v. 8, n.6, p. 992-998, 2014. Disponível em: