Contents lists available at GrowingScience
Decision Science Letters
homepage: www.GrowingScience.com/dsl
Integrated AHP and network DEA for assessing the efficiency of Iranian handmade carpet industry
Azadeh Omida* and Seyed Hessameddin Zegordib
aMaster of Science in Industrial Engineering , Tarbiat Modares University, Tehran, Iran
bCorresponding Author, Associate Professor, Industrial Engineering Dept., School of Engineering, Tarbiat Modares University, Tehran, Iran
C H R O N I C L E A B S T R A C T Article history:
Received February 9, 2015 Received in revised format: May 12, 2015
Accepted June 2, 2015 Available online June 3 2015
Data envelopment analysis (DEA) is a method for measuring the efficiency of peer decision making units (DMUs). Traditional DEA models deal with measurements of relative efficiency of DMUs regarding multiple-inputs vs. multiple-outputs. One of the drawbacks of these models is the neglect of intermediate products or linking activities. Recently, DEA has been extended to examine the efficiency of network structures, where there are lots of sub-processes that are linked with intermediate parameters. These intermediate parameters can be considered as the outputs of the first stage and simultaneously as the inputs for the second stage. In contrast to the traditional DEA analysis, network DEA analysis aims to measure different sub-processes’ efficiencies in addition to the total efficiency. Lots of network DEA technique has been used recently, but none of them uses Analytic Hierarchy Process (AHP) in network DEA for assessing a network’s efficiency. In this paper, AHP methodology is used for considering the importance of each sub-process and network DEA is used for measuring total and partial efficiencies based on the importance of each department measured from AHP methodology. In this regard, the case of Iranian Handmade Carpet Industry (IHCI) is used.
Growing Science Ltd. All rights reserved. 5
© 201
Keywords:
Analytic hierarchy process Network data envelopment analysis
Efficiency
Iranian handmade carpet industry
1. Introduction
Data envelopment analysis (DEA) is a method for measuring relative efficiency of peer decision making units (DMUs) with multiple inputs and outputs (Charnes et al., 1978). Although DEA has been applied in many different fields, DMUs have traditionally considered as black boxeswith its inputs and outputs and without any consideration of what is happening inside the DMUs (Liu et al., 2013). Castelli et al. (2010) classified the contributions of DEA literature by evaluating DMUs whose internal structure is known. Traditional DEA models fail to measure the efforts of different processes and sub processes within the organization (Moreno & Lozano, 2012). To overcome this, Kao (2008) introduced a linear formulation of the two-level DEA model. This model transforms the nonlinear model into a linear one using a variable substitution technique (Kao 2008). This transformation was required because linear
* Corresponding author.
478
models are easier to solve than their nonlinear counterparts (Kao, 2009). For network structures with more than two stages, Kao (2009) proposed the relational network DEA model. Liu and Lu (2010) enhanced the network-based approach, which is a novel method to increase discrimination in data envelopment analysis. Next, Hiseh and Lin (2010) utilized relational network DEA to construct a model to analyze the efficiency and effectiveness of international tourist hotel. More valuable research in the field of supply chain efficiency measurement by means of network DEA has been accomplished by Chang et al. (2011) and Vaz et al. (2010).
Cook et al. (2010a) reviewed DEA models and established relationships among various approaches. They showed that all the existing approaches could be categorized by using either Stackelberg (leader-follower), or cooperative game concepts (Cook et al., 2010a). Recently, Li et al. (2012) modeled a two stage structure by assuming the inputs to the second stage including both the outputs from the first stage and additional inputs to the second stage and proposed two new models for evaluating the performance of this general two-stage network structures.
An additive efficiency decomposition method has been proposed lately. Chen et al. (2010) developed a set of DEA models for measuring the performance of two-stage network processes with shared inputs. In addition, in their research additive efficiency decomposition approach for measuring the efficiency of two-stage network process was presented. The models were developed under the assumption of variable returns to scale (VRS), but could be readily applied under the assumption of constant returns to scale (CRS) (Chen et al., 2010). Cook et al. (2010b) represented the overall efficiency of an open multistage process as an additive weighted average of the efficiencies of the individual components or stages that make up that structure. The model therefore allowed one to evaluate not only the overall performance of the network, but also represented how that performance could be decomposed into measures for the individual components of the network (Cook et al., 2010b). Amirteimoori (2013) used the same approach for modeling a two-stage decision process with the existence of perfect and imperfect outputs for the case of Iranian car representatives. In addition, Kao and Liu (2014) developed a multi-period efficiency measurement in DEA to calculate overall and period efficiencies of a DMU at the same time. In their methodology, the overall efficiency is a weighted average of the period efficiencies. In all of these illustrations, the importance of each sub process is based on the amount of relative inputs entered to each one.
Analytic Hierarchy Process (AHP) is a multi-criteria decision making approach developed by Saaty (1990). It is a theory of measurement for dealing with quantifiable and intangible criteria that has been applied to numerous areas, such as decision theory and conflict resolution (Saaty, 2008). In AHP, a pairwise comparison matrix is constructed using a scale of relative importance (Saaty, 1980, 2008). The AHP determines the consistent weights and evaluates the composite performance score of alternatives to position the rank of an alternative in a hierarchical manner (Rao, 2013). There are numerous examples of AHP applications for key aspects of the operation of enterprises e.g. project management (Martinsuo, 2013), evaluation of technology, buyer decision process (Sumi & Kabir, 2010), integrated manufacturing (Putrus, 1990) and engineering (Triantaphyllou, 1995). AHP is used to arrive at a consensus in situations involving several decision makers with different conflicting objectives and helps to systematically compare and determine the priorities of the criteria and sub-criteria (Tam & Tummala, 2001). The model enables the problem to be structured in a hierarchical manner in terms of criteria and sub-criteria.
Analysis of historical data can also help managers do this duty, successfully. According to the efficiency scores of different DMUs, specialists can make suggestions about which DMU performs better and has priority for more investigation; additionally if a DMU's performance is poor, partial efficiency scores of sub processes can help managers realize which sub process needs to be strengthening in order to maximize the overall performance.
In handmade carpet industry there are different categories of carpets in terms of design, color, size, raw material and the proficiency of weavers; Carpet specialists classified these different types of carpet to some particular categories which is mostly named as the geographic region in which carpets are weaved. Production costs of these categories are different based on various weavers' wages depend on gender and geographic region, in addition different kinds of raw material with various prices are used such as wool, silk, fluff, lint and etc.
From a managerial point of view, the carpet industry's performance is the aggregated efforts of different departments, involving both the production and the sales department. Sales department consists of two major markets: internal market and external market which are working jointly to maximize the productivity of the company. Besides, there is a changeable demand for distinct kinds of carpet in the internal and external markets; some are sold better in the local markets although some are better to be exported. Hence it is necessary to perceive which category is more efficient in production and marketing.
Therefore, if we assume each category of handmade carpets as a DMU, it is so crucial for decision makers to know which DMU works, efficiently. It can help managers allocate more budgets to this category for the next year. In addition, partial efficiency can benefit managers a lot. If managers may reach to the partial efficiency score of various departments they will be able to understand which component is inefficient, so specialists will focus on this department and by empowering it, the overall efficiency of the DMU will increase too. By the knowledge of author, there is no research done yet in the field of measuring the performance of handmade carpet texture industry.
For ease of notation, Section 2 begins with introducing new approach to modeling multi-stage system of Iranian Handmade Carpet Industry (IHCI), then in Section 3, the methodology used for assessing the efficiency of this multi-stage network in introduced. Section 4 summarizes experimental data and the results of solving the model. Conclusions are given in the last section.
2. Methodology
In this investigation DMUs are not treated as a black-box, instead the proposed modeling considers internal structure of Iranian Handmade Carpet Industry, so the overall performance and the effectiveness of IHCI's sub processes will be measured.
2.1. Model construction
480
are called as undesired outputs which are sent out of the system as wastage. The part of these desired outputs enter as inputs to the external sales department and the rest enter to the internal sales department. The profit earned from each market is the output of these sub processes. Additionally, external sales department has its own inputs which are independent from the first stage that relates to expenses for customs clearance and transportation, so it is considered as an independent input to the external sales sub process. Since the internal sales expenses are much less than customs and transportation costs it can be ignored in the modeling. Fig. 1 presents the divisions and components of handmade carpet industry. This study aims to evaluate efficiency of the overall organization and effectiveness of major departments' operations.
Fig. 1. Multistage structure of Iranian Handmade Carpet Industry (IHCI)
Consider that there are k DMUs where each DMUj (j=1,…,k) consists of two main stages named as
production stage and sales stage as shown in Fig 1. Suppose that each DMUj (j=1,…,k) has m inputs denoted by xij (i=1,…,m) to the whole process as well as n desired outputs denoted by ztj (t=1,…,n) from the first stage, which then become inputs to the second stage and are referred to intermediate measures. Additionally, suppose that each DMUj (j=1,…,k) has l undesired outputs denoted by Urj
(r=1,…,l) from the first stage, which get out of the system as losses. The desired outputs from the first
stage (ztj) shared as inputs between two sub processes of the second stage, the proportion of these inputs measured by �� is dedicated to the first sub process while the remaining measured by �� is associated with the second one, so ��+�� = 1. Furthermore, we assume that the first sub process of second stage has extra inputs from outside of the system denoted by Hdj (d=1,…,p). Eventually, ysj is the outputs of
sth sub process of second stage. These parameters are also illustrated in Fig 1. Consistent with two-stage frameworks commonly used in the existing literatures, the overall organization efficiency can be calculated as follows (Liang et al., 2008; Kao, 2008):
����� = ���∑ �∑ �� �����− ∑ �� ����� ��
� ��� +∑ ℎ� ����� (1)
��1= ���∑ �� ��∑ ����− ∑ �� ����� ��
� ��� (2)
��2= ���∑ � ∑ �� �����
�����
� +∑ ℎ� ����� (3)
As can be clearly seen, efficiency of each stage is defined as the ratio of the weighted sum of outputs to the weighted sum of inputs. The rationale for the negative sign of the second term in the numerator of first stage's efficiency is that the outputs ��� are undesirable and try to be minimized so it should be decreased in the production process. Therefore, the model can be illustrated as follows:
subject to
∑ �� �����− ∑ �� �����
∑ �� ����� +∑ ℎ� ����� ≤
1 (5)
∑ �� �����− ∑ �� �����
∑ �� ����� ≤
1 (6)
∑ �� �����
∑ �� �����+∑ ℎ� ����� ≤ 1 (7)
�1��1�
���1��1�+ℎ��� ≤
1 (8)
�2��2�
���2��2� ≤ 1 (9)
For a specific DMUj, constraint 5 considers the system as a whole and represents that the weighted summation of outputs of the whole process is smaller or equal to its inputs. As it is mentioned before, since ��� is undesired outputs, it should be decreased and that is why it has negative sign in this constraint. Similarly, constraint 6 corresponds to the same constraint as 5 with the difference that it considers the first stage as a box. Constraint 7 represents the whole second stage's efficiency which is smaller or equal to one. Constraint 8 and 9 represent the relative efficiencies of each sub processes of the second stage to be smaller or equal to one. Based on relational model (Kao, 2008), we assume that
the same factor has the same multiplier, no matter how it is used. It means that we assume ��� =
�1� = �2�, therefore �� and �� coefficients represent the difference between amounts of inputs enter to each sub process of second stage. We also assume���= �1� = �2� =��.
The purpose of this issue is to determine the optimal value of the variables ���,���,���,��� ���ℎ�� for each DMUj (j=1,…,k) such that the overall efficiency of the whole system is maximized. It is blindingly evident that this modeling results to a multi-objective program which cannot be solved with standard linear programming approaches and needs some changes to transform into one objective function. In the following, a new procedure is introduced to alter this multi-objective program. In this paper, integrated AHP approach with network DEA is used for transforming this multi-objective problem.
2.2. Sub-processes’ importance by AHP
482
weighted total outputs to the total inputs corresponding to that component. Note that the weights are intended to represent the relative importance or contribution of the performances of individual stages. An alternative approach for measuring the efficiency of the multistage process is to view them from a centralized perspective, and determine a set of optimal weights that maximize the aggregate efficiency score to achieve maximum profit. One reasonable choice for weights is to use AHP technique. The AHP is a multi-criteria decision making approach that was developed by Saaty (1990).
For assessing the relative importance of criteria, Saaty (1980, 2008) suggested a quantified on the linguistic “one to nine” measurement scale in where aij =1 signifies that criteria i and j are equally important, 2= i weakly or slightly more important than j, 3= moderately, 4= moderately plus, 5= strongly, 6= strongly plus, 7= very strongly or demonstrated, 8= very, very strongly, 9= extremely. A value of aij=1/5 indicates that criterion j is strongly more important than i and aij=1/9 indicates that criterion j is extremely more important than i.
For measuring the relative importance of each sub-process, expand interviews are accomplished with IHCI’s experts and chief managers in order to collect their insights. In this regard, some personal meetings for discussion were held with field experts. Therefore, expert’s views have been collected based on the nine point Likert scale and then to check the internal consistence of collected data, reliability analysis has been performed using SPSS 16 software, through calculating the Cronbach’s alpha coefficient, which comes as 0.781, under the recommended range: 0.7<α<0.95. In Table 1, the results of relative importance of criterion are summarized based on consultants accomplished by IHCI’s experts.
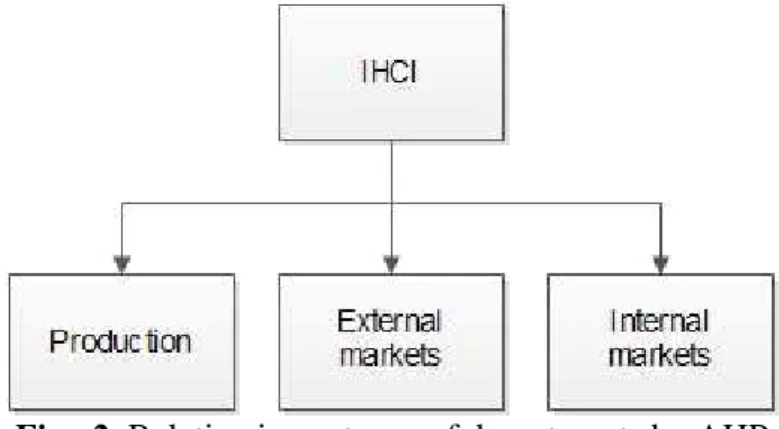
Fig. 2. Relative importance of departments by AHP
Table 1
Relative importance of IHCI’s sub-processes in one to nine Likert scale
Production Internal markets External markets
Production 1 1/3 1/5
Internal markets 3 1 1/4
External markets 5 4 1
Based on the data collected in Table 1, the relative importance of each sub-process can be calculated by Expert Choice software as follows:
Table 2
Relative importance of IHCI’s sub-processes calculated by AHP methodology
Production Internal markets External markets
Relative importance 0.101 0.226 0.674
�� =������+������+������ (10)
We propose to combine three departments in a weighted average of efficiency scores of each department where ���, ��� and ��� are the efficiency ratios of production, internal and external sales department, respectively. Furthermore, ���, ��� and ��� illustrate the relative importance of each component from AHP approach such that ���+���+��� = 1. Note that this definition ensures that a DMU is overall efficient if and only if all departments are efficient. Where:
��� = ∑ �� ��∑ ����− ∑ �� ����� ��
� ���
(11)
��� = ∑ � ∑ �1��1�
��1���+∑ ℎ���
��� = ∑ �∑ �2��2� ��2���
We then set out to optimize the overall efficiency �� of the multistage process, subject to the restrictions that the individual efficiency measures must not exceed unity. These restrictions can be converted to the linear programming format by using the usual Charnes and Cooper (1962) transformation. By applying the Charnes–Cooper transformation, the above fractional program (constraint set 5 to 9) can be converted to the following model:
subject to
(12)
� ������
�
− � ������
�
− � ���
�
��� − � ℎ�����
�
≤0
� ���
�
���− � ������
�
− � ���
�
��� ≤0
� ������− � ������
�
− � ℎ����� ≤0
� �
��01� �0
2��.�
�1�
�2�� − �
��
��� ����− �ℎ
� 0
0 0�.� ��
��� ≤0
In the constraint set above, the summation of weighted outputs is smaller than the summation of weighted inputs. It can be clearly seen that the proposed methodology converts the nonlinear constraint set 5 to 9 into the linear programming format which is summarized in constraint set 12. In addition to the overall efficiency of the system, the relative efficiencies of sub processes can be calculated from Eq. (11) where ���, ��� and ��� are the efficiency ratio of production, internal and external sales department, respectively.
3. Empirical study
484
plan, design and the equipment needed for weaving a carpet (X3j). The amount of perfect carpets weaved by weavers is measured by area (m2) which is assumed as desired output of first stage(Zj) which enters the second stage. Besides, undesired or imperfect carpets are denoted by Uj which is sent to outside of the system. The proportion of the desired outputs denoted by ���� enters to the external markets and the remaining denoted by ���� enters to the internal markets. Consider that ������� are the parameters of the model and ��+�� = 1. In addition, independent inputs to the external markets are denoted by Hj. The profit earned from each market is the outputs of these sub processes denoted by y1j and y2j for external and internal sales sub processes, respectively. The data set for a one year period is summarized in Table 3. The results are reported in Table 4. The first column of Table 4 shows the overall efficiency score. In addition partial efficiency score of all departments are summarized in the rest columns of Table 4.
Table 3
Data set of Iranian Handmade Carpet Company (IHCC's archives, 2013)
second stage's outputs Second stage's inputs
Intermediate variables First stage's inputs
DMU Internal
markets' profit External markets' earning Customs and transportation Β Α Undesired output Desired output Other expenses Wages raw material 28 103 22 0.70 0.30 24 470 41 190 56 Dep1 80 579 58 0.53 0.47 75 1280 6.8 298 282 Dep2 317 285 26 0.77 0.23 61 800 5.8 122 38 Dep3 36 86 8 0.84 0.16 19 310 23 262 82 Dep4 87 172 5 0.82 0.18 21 610 15 208 18 Dep5 58 314 53 0.66 0.34 71 1120 30 295 129 Dep6 66 169 22 0.75 0.25 13 600 29 132 79 Dep7 59 128 18 0.74 0.26 12 460 21 128 54 Dep8 36 198 32 0.69 0.31 30 710 15 98 63 Dep9 26 99 8 0.86 0.14 12 360 13 85 43 Dep10 26 148 16 0.81 0.19 19 530 17 129 76 Dep11 90 241 19 0.83 0.17 34 860 25 120 68 Dep12 161 103 12 0.85 0.15 28 370 2.7 124 85 Dep13 20 69 7 0.77 0.23 12 250 7.9 75 95 Dep14 13 88 5 0.87 0.13 30 320 9.3 55 54 Dep15 Table 4
Results of efficiency measurement
Internal sales efficiency External sales efficiency Production efficiency Total efficiency DMU 0.165 0.345 0.474 0.317 Dep1 0.229 0.496 1.000 0.487 Dep2 1.000 0.732 1.000 0.820 Dep3 0.269 0.820 0.204 0.634 Dep4 0.338 1.000 1.000 0.851 Dep5 0.152 0.390 0.556 0.353 Dep6 0.285 0.533 1.000 0.525 Dep7 0.337 0.506 0.876 0.506 Dep8 0.143 0.425 1.000 0.420 Dep9 0.163 0.929 0.875 0.751 Dep10 0.118 0.695 0.864 0.582 Dep11 0.245 0.779 1.000 0.681 Dep12 0.995 0.877 0.788 0.895 Dep13 0.202 0.567 0.532 0.481 Dep14 0.091 1.000 0.803 0.776 Dep15
working properly and has an efficient score of 0.338. Therefore, the consequence is that total efficiency score of this DMU must be less than one because all departments of this DMU is not efficient. The results illustrate the value of 0.851 for total efficiency score of this DMU.
Results summarized in Table 4 can be used to develop beneficial management strategies for future years. For instance, department No. 3, 5 and 13 have higher total efficiency scores among all 15 departments. So, during the production planning and resource allocation in the following year, more resources will be allocated to these special categories of handmade carpet in order to maximize the profit and productivity of the company. In addition, by focusing on partial effectiveness of different departments, most efficient departments can be classified as the following: among production departments, DMUs No. 2, 3, 5, 7, 9 and 12 are efficient DMUs. It means that production department of these DMUs produces the maximum amount of desired output in proportion to their inputs compared with other DMUs. Among external sales departments, DMUs No. 5 and 15 are efficient. These DMUs earn maximum profitability of export. By planning for more investment on these categories, the company will earn more income from export. Among internal sales departments, DMUs No. 3 and 13 have the greatest amounts of efficiency score. Hence, these categories of Iranian carpets are the most profitable kinds of carpets in domestic markets.
4. Conclusion
Standard data envelopment analysis considers just inputs and outputs for measuring the efficiency of DMUs with neglecting the intermediate parameters. On the contrary, network data envelopment analysis focuses on intermediate parameters and aims to measure the efficiency of all sub-processes in addition to the whole efficiency of DMUs. Therefore, the conventional problem in data envelopment analysis converts to a multi-objective problem where the efficiency of each sub-process can be measured as one objective. One approach for solving this multi-objective approach is the usage of weighting approach while the weights of each sub-process can be measured from AHP methodology. In this regard, this study focuses on measuring the efficiency of Iranian Handmade Carpet Industry (IHCI) by means of integrated AHP and network data envelopment analysis.
The main objective of this paper is to assess the performance of handmade carpet industry for the first time. To achieve this goal, this study measures the efficiency and effectiveness of Iranian Handmade Carpet Industry (IHCI) which is a multi-stage system with extra inputs, undesired outputs and shared variables. Because of network structure of the system, the main problem convert to a multi-objective problem which aims to maximize partial efficiency the same as the total efficiency. In order to solve this multi-objective problem, integrated AHP and network data envelopment analysis have been used. This approach converts the multi-objective problem into a one objective function which is the summation of partial efficiency of each sub process multiplied by optimal weights. Optimal weights are obtained from solving an AHP problem that consider experts’ insights.
Results calculated from empirical data of IHCI illustrate that this methodology could assess total and partial efficiency of a multi-stage network at the same time and also it could distinguish the most efficient departments. Further researches will shed light on the exploration of using other multi-objective programming methodology in order to solve network DEA models for measuring the performance of more complex multi-stage networks with undesired outputs and in variable return to scale mode. In addition, based on the importance of carpet industry, more investigations in this area are needed.
References
Amirteimoori, A. (2013). A DEA two-stage decision processes with shared resources. Central
486
Castelli, L., Pesenti, R., & Ukovich, W. (2010). A classification of DEA models when the internal structure of the Decision Making Units is considered. Annals of Operations Research, 173(1), 207-235.
Chang, T.-S., Tone, K., & Wei, Q. (2011). Ownership-specified network DEA models. Annals of
Operations Research, 214(1), 1-26.
Charnes, A., & Cooper, W. W. (1962). Programming with linear fractional functionals. Naval Research
Logistics Quarterly, 9(3-4), 181-186.
Charnes, A., Cooper, W. W., & Rhodes, E. (1978). Measuring the efficiency of decision making units.
European Journal of Operational Research, 2(6), 429-444.
Chen, Y., Du, J., David Sherman, H., & Zhu, J. (2010). DEA model with shared resources and efficiency decomposition. European Journal of Operational Research, 207(1), 339-349.
Cook, W. D., Liang, L., & Zhu, J. (2010a). Measuring performance of two-stage network structures by DEA: A review and future perspective. Omega, 38(6), 423-430.
Cook, W. D., Zhu, J., Bi, G., & Yang, F. (2010b). Network DEA: Additive efficiency decomposition.
European Journal of Operational Research, 207(2), 1122-1129.
Hsieh, L.-F., & Lin, L.-H. (2010). A performance evaluation model for international tourist hotels in
Taiwan—An application of the relational network DEA. International Journal of Hospitality
Management, 29(1), 14-24.
Kao, C. (2008). A linear formulation of the two-level DEA model. Omega, 36(6), 958-962.
Kao, C. (2009). Efficiency decomposition in network data envelopment analysis: A relational model.
European Journal of Operational Research, 192(3), 949-962.
Kao, C. (2013). Dynamic data envelopment analysis: A relational analysis.European Journal of
Operational Research, 227(2), 325-330.
Kao, C., & Liu, S. T. (2014). Multi-period efficiency measurement in data envelopment analysis: The
case of Taiwanese commercial banks. Omega, 47, 90-98.
Li, Y., Chen, Y., Liang, L., & Xie, J. (2012). DEA models for extended two-stage network structures.
Omega, 40(5), 611-618.
Liang, L., Cook, W. D., & Zhu, J. (2008). DEA models for two‐stage processes: Game approach and efficiency decomposition. Naval Research Logistics (NRL), 55(7), 643-653.
Liu, J. S., Lu, L. Y. Y., Lu, W.-M., & Lin, B. J. Y. (2013). Data envelopment analysis 1978–2010: A citation-based literature survey. Omega, 41(1), 3-15.
Liu, J. S., & Lu, W.-M. (2010). DEA and ranking with the network-based approach: a case of R&D performance. Omega, 38(6), 453-464.
Moreno, P., & Lozano, S. (2014). A network DEA assessment of team efficiency in the NBA. Annals
of Operations Research, 214(1), 99-124.
Vaz, C. B., Camanho, A. S., & Guimarães, R. C. (2010). The assessment of retailing efficiency using
Network Data Envelopment Analysis. Annals of Operations Research, 173(1), 5-24.
Yang, F., Wu, D., Liang, L., Bi, G., & Wu, D. (2011). Supply chain DEA: production possibility set
and performance evaluation model. Annals of Operations Research, 185(1), 195-211.