HESSD
6, 6865–6893, 2009Increase in surface runoffin Central
Mexico
N. Gratiot et al.
Title Page
Abstract Introduction
Conclusions References
Tables Figures
◭ ◮
◭ ◮
Back Close
Full Screen / Esc
Printer-friendly Version
Interactive Discussion
Hydrol. Earth Syst. Sci. Discuss., 6, 6865–6893, 2009 www.hydrol-earth-syst-sci-discuss.net/6/6865/2009/ © Author(s) 2009. This work is distributed under the Creative Commons Attribution 3.0 License.
Hydrology and Earth System Sciences Discussions
This discussion paper is/has been under review for the journal Hydrology and Earth System Sciences (HESS). Please refer to the corresponding final paper in HESS if available.
Increase in surface runo
ff
in the central
mountains of Mexico: lessons from the
past and predictive scenario for the next
century
N. Gratiot1, C. Duvert2, L. Collet2, D. Vinson2, J. N ´emery1, and C. Saenz-Romero3
1
LTHE – Universit ´e Grenoble 1/IRD, G-Inp, CNRS, UJF, France
2
Centro de Investigaciones en Ecosistemas, Universidad Nacional Aut ´onoma de M ´exico, Morelia, Michoac ´an, Mexico
3
Instituto de Investigaciones Agropecuarias y Forestales, Universidad Michoacana de San
Nicol ´as de Hidalgo, Tar´ımbaro, Michoac ´an, Mexico
Received: 16 October 2009 – Accepted: 26 October 2009 – Published: 9 November 2009
Correspondence to: N. Gratiot ([email protected])
HESSD
6, 6865–6893, 2009Increase in surface runoffin Central
Mexico
N. Gratiot et al.
Title Page
Abstract Introduction
Conclusions References
Tables Figures
◭ ◮
◭ ◮
Back Close
Full Screen / Esc
Printer-friendly Version
Interactive Discussion
Abstract
The hydrological response of a medium scale mountainous watershed (Mexico) is ana-lysed over half a century. The hydrograph separation highlights an increasing sur-face runoffcontribution since the early 1970’s. This increase is attributed to land use changes while the meteorological forcing (rains) remains statistically stable over the
5
same period. As a consequence, the intensity of annual extreme floods has tripled up over the period of survey, increasing flood risks in the region. The paper ends with a cli-matic projection over the 21st century. The decrease of precipitation and the increase of temperature should accentuate the trend engaged since the 1970’s by reducing groundwater resources and increasing surface-runoffand associated risks.
10
1 Introduction
Over the last decades, Mexico has suffered from degradation of its surface water bodies which is imposing undeniable economical costs (Alcocer and Escobar, 1993). Nowa-days Mexican water resources are commonly considered poor in quality and sparse in quantity (Vidal et al., 1985), a situation exemplified in Michoac ´an state. A recent
15
study led by various local institutions (Ortiz ´Avila, 2009) stressed that water contam-ination, solid residuals management and drinkable water are the main environmental priorities of the Michoac ´an settlements. In terms of quantity, the state has experienced a decrease of about 70% in its surface water resources over the last century (Vargas Uribe, reported by Morales, 2007). This evolution has been correlated with the high
20
emigration rate in Michoac ´an (63% of total population), which contributed to the main soils and water resources use changes (L ´opez-Granados et al., 2006).
The present paper aims at investigating water cycle changes from 1956 to 2001 in the Cointzio watershed (Michoac ´an state), a medium scale mountainous basin repre-sentative of the Central Transvolcanic Mexican Belt.
25
HESSD
6, 6865–6893, 2009Increase in surface runoffin Central
Mexico
N. Gratiot et al.
Title Page
Abstract Introduction
Conclusions References
Tables Figures
◭ ◮
◭ ◮
Back Close
Full Screen / Esc
Printer-friendly Version
Interactive Discussion
changes on water runoff in the watershed. To that purpose a hydro-meteorological database running from 1956 to 2001 was employed following the latter methodology: available rain and water discharge series were gathered (and digitalized when neces-sary) and criticized (missing data and quality control) to provide reliable series. A par-ticular effort was paid to estimate the accuracy of the historical water discharge data
5
in relation with sampling frequency (Sect. 3). In a second time, hydrograph separation technique was applied to water discharge records to define the baseflow/surface-runoff ratio and its evolution over decades. The generated time series were tested with vari-ous statistical methods in order to provide accurate hydro-climatic trends and objective interpretations (Sect. 4). Finally, a climate model was applied to five meteorological
10
stations to go towards scenarios of evolution for the coming century (Sect. 5).
2 Study area
The Cointzio watershed is located in the hydrological region of Lerma-Chapala, within the Central Transvolcanic Mexican Belt, in the state of Michoac ´an (Fig. 1). It drains a surface of about 650 km2, ended by the Cointzio reservoir (4 km2, 65 Mm3). The
15
latter provides about 22% of drinking water distributed in Morelia, capital of the state situated 13 km downstreams. Water demand of the city has been growing over the last decades because of increasing individual water consumption coupled with a severe urban growth: Morelia experienced an augmentation of its population of 600% during the period 1975–2000 (L ´opez-Granados et al., 2001) and counts now over 700 000
20
inhabitants (INEGI, 2006).
The climate of the region is temperate sub-humid, characterized by a rainy season from May to October and a dry season the rest of the year (Rubio, 1998). Mean annual rainfall is 770 mm in Morelia, ranging from 400 to 1100 mm/y in thirty years (period 1975–2005) (Carl ´on Allende and Mendoza, 2007). These meteorological conditions
25
HESSD
6, 6865–6893, 2009Increase in surface runoffin Central
Mexico
N. Gratiot et al.
Title Page
Abstract Introduction
Conclusions References
Tables Figures
◭ ◮
◭ ◮
Back Close
Full Screen / Esc
Printer-friendly Version
Interactive Discussion
the Rio Grande de Morelia whose source lies about 25 km upstream of the Cointzio reservoir.
The Cointzio basin is underlain by igneous rocks (both lavas and pyroclasts) orig-inating from Quaternary volcanic activity. Soils and landforms developed in most of the watershed have been derived from these volcanic materials (Carl ´on Allende et al.,
5
2009). Such soils present susceptibility to erosion (Poulenard et al., 2001). They are mainly Andisol in the headwater areas, Acrisol in the hillsides and Luvisol in the plain (INEGI, 2002).
In 2000, major land cover and land uses were scrublands (23.7%), forests (19.6%), rain fed agricultural lands (18.5%), irrigated cultures (15.5%) and grassland (6.3%)
10
(L ´opez-Granados et al., 2001). According to these uses, the basin can be classified as agro-sylvo-pastoral.
Using GIS to represent data of land cover and land use, Mendoza and L ´opez-Granados (2007) were able to identify the major changes in the Cointzio watershed over the period 1975–2000. The main changes in surface were increase of
scrub-15
lands (9.6%), recovery of forests (6.2%), deforestation (5.5%), degradation of forests (4.1%) and urbanization (1.3%). The major part of these changes occurred during the 1986–1996 period.
3 Data and methods
3.1 The hydrometeorological historical database and its limitation
20
Rain series were extracted from the Mexico Climatological Station Network Data (CLI-COM). This database reports all of the meteorological stations surveyed by the Servicio Nacional de Meteorolog´ıa de M ´exico. A pre-analysis was realized by Vinson (2008). Among the eighty meteorological stations in the state of Michoac ´an, five were consid-ered of interest. Three are located within the Cointzio watershed, namely the stations of
25
HESSD
6, 6865–6893, 2009Increase in surface runoffin Central
Mexico
N. Gratiot et al.
Title Page
Abstract Introduction
Conclusions References
Tables Figures
◭ ◮
◭ ◮
Back Close
Full Screen / Esc
Printer-friendly Version
Interactive Discussion
SU and C in Fig. 1). The stations of Jesus del Monte (2180 m) and Morelia (1920 m) that are close to the watershed delimitation were also taken into account (JdM and M in Fig. 1). The first one is of interest to examine potential orographic effects and the second one because of its reliability and local importance.
The quality of time series has been examined and is summarized in Table 1. All years
5
presenting missing values have been rejected as well as years presenting evident data capture errors. The station of Acuitzio del Canje (Ac) is the only one showing significant gaps during the whole period. For a reason of clarity, results presented in Sect. 4.1 focus on the precipitation series of Santiago Undameo and Cointzio (Fig. 2a). These latter are the only consistent time series within the watershed and the five series exhibit
10
a very similar pattern (for details see Vinson, 2008).
The gauging station of Santiago Undameo (SU in Fig. 1) constitutes the ultimate control upstream the reservoir of Cointzio: it drains 628 km2. Its monitoring has been launched in 1939, year of construction of the reservoir of Cointzio. A Parshall flume was built, allowing a control of the hydraulic section, and a stage-discharge rating curve
15
was established by the Comisi ´on Nacional del Agua (CNA). The monitoring ended in 2001.
The 1939–1985 period was previously digitalized by the CNA (BANDAS database), while the 1985–2001 period was digitalized as part of our investigations. Although overall database covers the 1939–2001 period, we decided to focus on 1956–2001
20
series since the first flume was destroyed during a major event in 1953. The re-building and its calibration ended during 1955. The water discharge database is presented in Fig. 2b. Some minor missing period events were identified in 1975, from 17–20 October because of a flood event. Four days of missing data are reported in 1992 and one more in 1997. With a period of missing data of several weeks in September and October, the
25
year 1998 could not be considered in our analysis.
deter-HESSD
6, 6865–6893, 2009Increase in surface runoffin Central
Mexico
N. Gratiot et al.
Title Page
Abstract Introduction
Conclusions References
Tables Figures
◭ ◮
◭ ◮
Back Close
Full Screen / Esc
Printer-friendly Version
Interactive Discussion
mined through the stage-discharge rating curve. Our aim was to take advantage of this high-frequency monitoring to evaluate the accuracy of daily discharge values provided by historical time-series, and thus to carry out a long-term analysis without misinter-pretation.
Daily discharge data was historically deduced by the CNA from a minimum of three
5
manual measures (respectively at 06:00 LT, 12:00 LT and 18:00 LT). Taking into account the occurrence of flash flood events in the basin, the historical sampling frequency is questionable. To validate the methodology, a sub-sampling of the real-time-series ac-quired in 2008 was generated. Resulting mean daily discharges were then compared to reference mean daily discharges derived from the high-frequency time-series (Fig. 3).
10
Reference discharge values and sub-sampled ones exhibit a strong linear relation-ship (Fig. 3a). Distribution of the relative error presented in Fig. 3b exhibits a Gaussian shape, centred on zero and characterized by a low standard deviation of about 7%. Such pattern demonstrates the reliability of the historical sampling. Loss of accuracy remains very limited if focusing on short-term dynamics as well as on seasonal
wa-15
ter budgets calculation (maximum under-estimation of 2% of reference volume). The further processing of 1956–2001 historical time-series is thereby validated.
3.2 Hydrograph separation technique
We aimed to consider the effects that may have induced an alteration of physical char-acteristics of the watershed, such as land use change, on the hydrological cycle. We
20
subsequently focused on the characterization of annual baseflow/surface-runoff ratio and its evolution over the past fifty years at Santiago Undameo.
Stream flow hydrographs were separated into Annual Base Flow (ABF) and Annual Surface-Runoff (ASR) components. The baseflow component has traditionally been associated with groundwater discharging into the stream and the surface-runoff
com-25
HESSD
6, 6865–6893, 2009Increase in surface runoffin Central
Mexico
N. Gratiot et al.
Title Page
Abstract Introduction
Conclusions References
Tables Figures
◭ ◮
◭ ◮
Back Close
Full Screen / Esc
Printer-friendly Version
Interactive Discussion
trends in water discharge behaviour. The reader can refer to Chapman (1999) and Nathan and McMahon (1990) to get an overview of techniques commonly used by engineers to quantify the baseflow contribution of a watershed.
A variant of a hydrograph separation method was programmed using Matlab© soft-ware. The algorithm used is based on the concept developed by Pettyjohn and Henning
5
(1979) and is commonly referred as the “smoothed minima technique” in the literature (Brodie and Hostetler, 2005). This method can be described as connecting with straight lines the minima of fixed intervalsτof the hydrograph. The sequence of these connect-ing lines defines the baseflow hydrograph. In case of missconnect-ing data, a mean value cal-culated from nearest neighbours was used. Calcal-culated Base Flow delimitation (CBF)
10
was thus obtained as follows:
CBF(d ,τ)= min
d∈[d−τ
2, d+2τ]
Qd(d) (1)
Withd: day of the year
τ: interval parameter (in days and necessarily pair)
Qd: mean daily water discharge (in m3.s−1)
15
Annual Base Flow (ABF) and Annual Surface Runoff (ASR) were then estimated by:
ABF= 365
X
d=1
CBF(d) (2a)
ASF= 365
X
d=1
Qd−ABF (2b)
In our analysis, we tested a broad range ofτ values from four to fourteen days. From
20
HESSD
6, 6865–6893, 2009Increase in surface runoffin Central
Mexico
N. Gratiot et al.
Title Page
Abstract Introduction
Conclusions References
Tables Figures
◭ ◮
◭ ◮
Back Close
Full Screen / Esc
Printer-friendly Version
Interactive Discussion
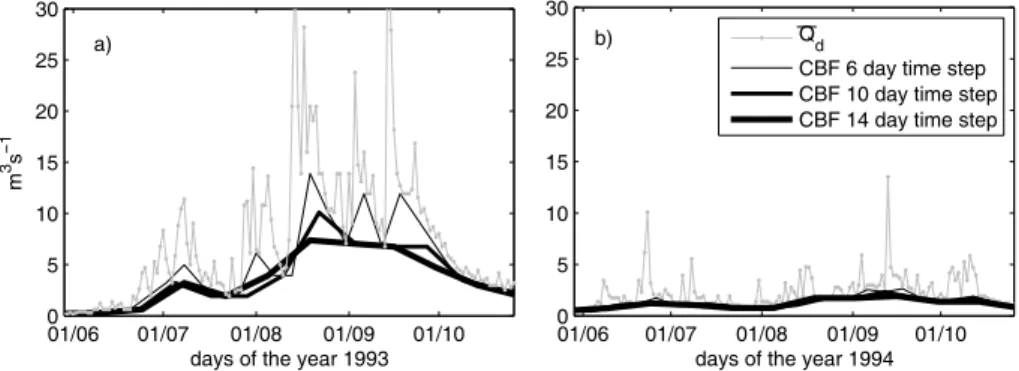
significant flooding periods lasting several days. CBF function decreases significantly for increasingτvalues from six to fourteen days. Conversely, in the case of year 1994 (Fig. 4b), periods with high water discharge were scarce and never exceeded a couple of days. As expected, CBF function does not vary significantly withτ.
To determine whether a largeτvalue (fourteen days or more) or a low one (six days
5
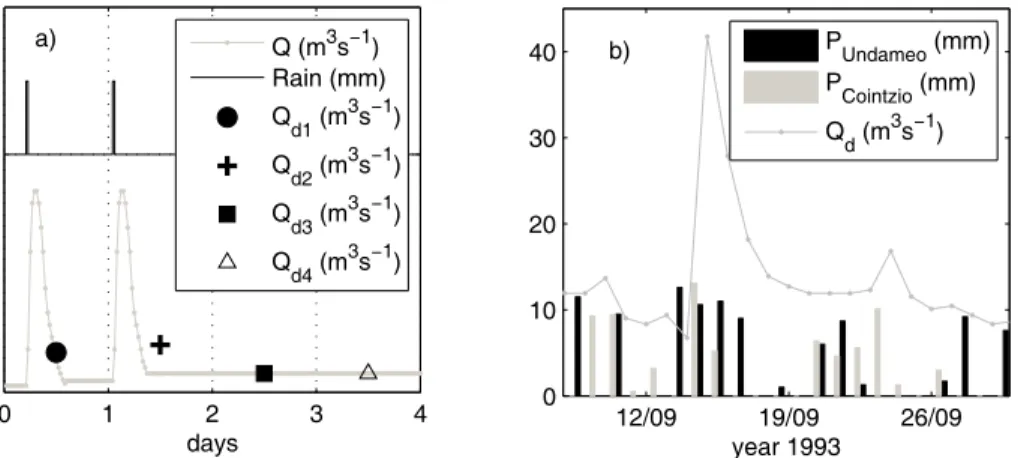
or less) is more appropriate, it is necessary to introduce a physically based analysis. Let’s imagine a theoretical Dirac precipitation uniformly distributed on the watershed. The water surface runoffincreases rapidly at the outlet before its recession. The base-flow reacts slowly and its level increases slightly (Fig. 5a, first day). Considering an independent event occurring the following day, the watershed reacts similarly (Fig. 5a,
10
second day). Since historical database only provides some mean daily discharges (circle, cross, square and triangle in Fig. 5a), the estimation of baseflow level requires a minimal period of one day without significant precipitation. In that case:
Qinst≈ctte (3a)
Qd= 1
N N X
i=1
ctte≈Qinst (3b)
15
WithQinst: instantaneous water discharge (in m 3
.s−1),
N: number of samples per day.
The real situation occurring in September 1993 illustrates perfectly the concept. It is presented in Fig. 5b as part of the series presented in Fig. 4a. Significant rain-falls occurred at the meteorological stations of Cointzio and Santiago Undameo until
20
17 September (black and grey bars in Fig. 5b) and were followed by a four days dry period. The hydrological response follows this meteorological forcing with a delay of one to two days. In that case, it is clear that baseflow level is reached during the period extending from 19–23 September.
By examining the precipitation database at our disposal, it appeared that the longest
25
HESSD
6, 6865–6893, 2009Increase in surface runoffin Central
Mexico
N. Gratiot et al.
Title Page
Abstract Introduction
Conclusions References
Tables Figures
◭ ◮
◭ ◮
Back Close
Full Screen / Esc
Printer-friendly Version
Interactive Discussion
approximately of five days. The upper discussion highlights that aτinterval of six days is best suitable in Fig. 4a, while coinciding with both rainfall pattern and hydrograph visual examination.
However, to prevent any misinterpretation, the algorithm was also run with both a shorter (four days) and a longer (ten days)τvalue.
5
3.3 Trends detection from statistical methods
Statistical significance of gradual trends was detected by applying the rank-based Mann-Kendall test (Mann, 1945; Kendall, 1975) and magnitude of trends was esti-mated from Sen’s method (Sen, 1968).
The Mann Kendall test is a non parametric statistic that has been widely used to
10
assess the significance of monotonic trends in hydro-meteorological time-series (e.g., Lettenmaier et al., 1994; Marengo and Tomasella, 1998; Jiang et al., 2007; Zhang et al., 2008; among others). The test assumes that there is no serial correlation in the data. Such assumption is reasonable for the rainfall and runoff records presented in this paper.
15
The null hypothesis H0 is that the sample of data is independent and identically
distributed. The alternative hypothesisH1is that a monotonic trend exists in the
time-series. Mann-Kendall method was applied by considering the statisticS as:
S=
n X
i=2
i−1
X
j=1
sign(xi−xj) (4)
Wherexi andxj are the sequential data values,nis the length of the time-series and
20
sign(xi−xj) is−1 for (xi−xj)<0; 0 for (xi−xj)=0 and 1 for (xi−xj)>0.
In the absence of ties, the variance Var [S] of the statisticS was obtained as:
Var[S]=n(n−1)(2n+5)
HESSD
6, 6865–6893, 2009Increase in surface runoffin Central
Mexico
N. Gratiot et al.
Title Page
Abstract Introduction
Conclusions References
Tables Figures
◭ ◮
◭ ◮
Back Close
Full Screen / Esc
Printer-friendly Version
Interactive Discussion
The standardized statistical testZ was computed by:
Z=
S−1
√
Var[S] ifS >0
0 ifS=0
S+1
√Var[
S] ifS <0
(6)
Positive value ofZ indicates an increasing trend while negativeZ indicates a decreas-ing trend. When testdecreas-ing monotonic trends at anα significance level, H0 was rejected
for absolute value ofZgreater thanZ(1−α/2), whereZ(1−α/2)is the value of the standard
5
normal distribution with a probability ofα/2. In this work, significance level ofα=0.01 (99% confidence) was applied and null hypothesis was rejected if|Z|>Z0.995=2.575.
Sen’s method is a non-parametric statistic used in determining the presence and magnitude of a trend slope. This test proceeds by calculating the slope as a change in measurement per change in time. Trend slopes magnitudes were obtained following
10
the method of Hirsch et al. (1982):
β=median
"
(xj−xi)
(j−i)
#
for alli < j (7)
Where xj and xi are data points measured at timesj andi, respectively.
Mann-Kendall test and Sen’s method were applied on precipitation, surface runoff and water discharge time series. Results are presented in Sect. 4.2.
15
4 Results
4.1 Pattern of the precipitation time-series from 1956 to 2001
HESSD
6, 6865–6893, 2009Increase in surface runoffin Central
Mexico
N. Gratiot et al.
Title Page
Abstract Introduction
Conclusions References
Tables Figures
◭ ◮
◭ ◮
Back Close
Full Screen / Esc
Printer-friendly Version
Interactive Discussion
of the 5% days undergoing maximum rainfall events. The latter basically corresponds to a virtual “top eighteen days” each year.
Results presented in Fig. 6 only focus on the stations of Cointzio and Santiago Un-dameo but, as said previously conclusions are similar for the three other stations.
Annual precipitation series fluctuates significantly in the range 650–1200 mm/y;
5
however there is no evidence of tendencies over the last fifty years. Cumulated top 5% precipitations correspond to about 400–500 mm of total annual precipitations, which means that 50% of annual volumes are precipitated in 5% of the time. Such ratio highlights the heavy rainfall pattern characterizing the region during wet season.
Maximal precipitation exhibits the same pattern than annual volumes and top 5%
10
precipitations. Although maximum daily precipitation fluctuates from year to year, it basically remains stable in the range 35–60 mm and roughly corresponds to 5% of annual precipitation.
4.2 Pattern of the Annual Surface Runoff(ASR) from 1956 to 2001
Annual Surface Runoff(ASR) and Annual Base Flow (ABF) were calculated from 1956
15
to 2001 by applying Eqs. (1) and (2) withτintervals of four, six and ten days.
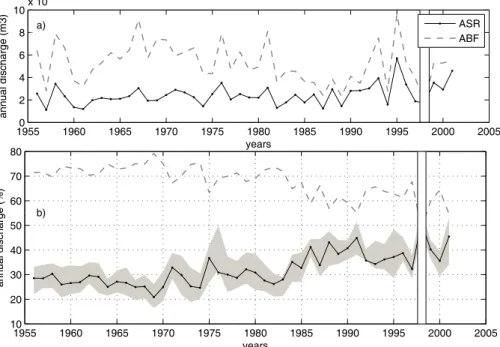
As shown in Fig. 7a, ASR volume series remains globally constant over 1956–2001 period, in the range (10–40)×106m3.y−1. ABF volume is always predominant. It fluc-tuates in the range (30–80)×106m3.y−1. Unlike ASR, ABF volume exhibits clear inter-decades trends. It shows a continuous decrease from the beginning of the seventies
20
to the end of the eighties that could be correlated to the dry cycle discussed by Carl ´on Allende and Mendoza (2007) and Metcalfe et al. (2007).
Another interesting pattern is depicted by %ASR and %ABF series presented in Fig. 7b. Unlike ASR volume, %ASR has been increasing substantially since the sev-enties. It remains almost constant (nearly 25%) until 1970 and then increases to reach
25
about 40% by the end of the eighties to 2001. This significant water balance change does not depend on the hydrograph separation processing as it is observed for every
HESSD
6, 6865–6893, 2009Increase in surface runoffin Central
Mexico
N. Gratiot et al.
Title Page
Abstract Introduction
Conclusions References
Tables Figures
◭ ◮
◭ ◮
Back Close
Full Screen / Esc
Printer-friendly Version
Interactive Discussion
encountered in North American watersheds (Neffet al., 2005).
Looking simultaneously at volumes and percentages it appears that surface runoff versus baseflow is not affected by the precipitation pattern. This is well illustrated by couples of years 1956–1957 and 1993–1994. Between years 1956 and 1957, the total water discharge rose from 39×106m3to 113×106m3(Fig. 7a) while %ASR (or %ABF)
5
remained almost stable (28.5% to 33%, Fig. 7b). Between years 1993 and 1994, the total water discharge dropped from 153×106m3to 44×106m3while %ASR (or %ABF) did not change significantly (34% to 36%).
The last two paragraphs point out that the ratio ASR/ABF and its evolution over years does not depend on meteorological forcing. Hence, it is the partition of rainfall input
10
between surface-runoffand baseflow that has changed gradually in Cointzio. Between 1956 and 2001 the watershed has been retaining less surface runoff and has been sustaining lower baseflow. This change in hydrological response is very likely to be associated with physical alterations of the watershed, such as land use change and surface impermeabilization. Consequently, %ASR evolution is hereafter considered as
15
an indicator of the human-induced environmental changes in the watershed.
4.3 Evolution of water discharge extreme events
The goal of the present section is to quantify hydro meteorological trends and evaluate the relative impacts of both meteorological and human-induced changes on floods. The Mann Kendal test was applied to annual rain (Cointzio weather station), %ASR
20
series and water discharge. Results are presented in Table 2 and trends are depicted in Fig. 8.
As specified in Sect. 4.1, rain series does not exhibit any trend (Fig. 8a, Table 2). Hence, it can be considered that climatic changes, in terms of water input in the wa-tershed, were insignificant during the study period. Conversely, %ASR increases
sig-25
HESSD
6, 6865–6893, 2009Increase in surface runoffin Central
Mexico
N. Gratiot et al.
Title Page
Abstract Introduction
Conclusions References
Tables Figures
◭ ◮
◭ ◮
Back Close
Full Screen / Esc
Printer-friendly Version
Interactive Discussion
of the %ASR increment (see Sect. 4.2) has undoubtedly contributed to the increase in extreme floods intensity depicted in Fig. 8c. This graph displays the annual flood peakQdmax. The series exhibits a clear increase with trend slope amplitude of 0.50.
It corresponds to an increase rate ofQdmax as high as 232% over half a century. The series also shows a clear increment of the variability since 1975 but there is no doubt
5
that flood risk has increased over years.
5 Potential evolutions over next decades
In terms of water management, it is crucial to evaluate whether the engaged trend will continue or not.
Future climate change prediction was thus conducted for the five weather stations
10
considered. Estimates of mean annual precipitation and temperature presented in Fig. 9a, b are deduced from a spline climatic model developed for a normalized period (years 1961 to 1990, nominated “contemporary climate”) and updated with weighted outputs from a Global Circulation Model (Canadian Centre for Climate Modelling and Analysis), emission scenario A2, for the decades centred in the years 2030, 2060
15
and 2090 (Crookston, 2008; Saenz-Romero et al., 2009). Following Saenz-Romero et al. (2009), precipitation and temperature series are combined to provide an aridity index (ratio of the square root of annual degree days>5◦C to annual precipitation) that represents the potential for moisture stresses to develop in the vegetation (Fig. 9c).
Average estimations among the five weather stations for the contemporary climate
20
and compared to the global change scenario, indicate an expected decrement in pre-cipitation of 15.4, 19.1 and 27.7%, and an increment in mean annual temperature of 1.6, 2.5 and 4.4◦C, for the decades centred in the years 2030, 2060 and 2090, respec-tively.
In terms of extreme events, it would be inappropriate to associate the annual
pre-25
HESSD
6, 6865–6893, 2009Increase in surface runoffin Central
Mexico
N. Gratiot et al.
Title Page
Abstract Introduction
Conclusions References
Tables Figures
◭ ◮
◭ ◮
Back Close
Full Screen / Esc
Printer-friendly Version
Interactive Discussion
The combination of increment of temperature and decrement of precipitation evi-dently causes an increment of aridity, measurable through the annual aridity index (Fig. 9c, where smaller values mean a climate colder and moister and larger values indicate a climate warmer and dryer). Since the aridity index is closely related to the type of vegetation (Rehfeldt, 2006; Rehfeldt et al., 2006), it is reasonable to expect that
5
climate change will cause a decrement of the vegetation coverage, and consequently, an increment of runoffcontribution, as previously reported by Ranzi et al. (2002) and Garc´ıa-Ruiz et al. (2008).
6 Conclusion and perspectives
Over half a century, significant changes have occurred in the water balance of Cointzio,
10
a medium scale watershed representative of the mountainous highlands of Central Mexico. Surface-runoffhas increased of about 70% and has consequently led to a se-vere increase in extreme flood events (magnitude has tripled up over 1956–2001). The main changes occurred from the 1970’s and are believed to be principally driven by human-induced changes.
15
The state of Michoac ´an experienced very strong migration fluxes which contributed to the main soils and water resources use changes, as revealed by L ´opez-Granados et al. (2006) from remote sensing analysis. Within the watershed, inhabitants have been leaving countryside while Morelia (capital of Michoac ´an) has been growing tremen-dously, from 100 000 inhabitants in 1950 to 700 000 in 2005. During the same period,
20
precipitation exhibited no statistical trend in the region, attesting the absence of signif-icant climatic change.
Predicting in which proportion water cycle disequilibrium engaged since the 1970’s will extend in the coming decades is a key issue. First, the growth in water consumption related to urban needs and new agricultural practices (avocados) will reinforce the
25
HESSD
6, 6865–6893, 2009Increase in surface runoffin Central
Mexico
N. Gratiot et al.
Title Page
Abstract Introduction
Conclusions References
Tables Figures
◭ ◮
◭ ◮
Back Close
Full Screen / Esc
Printer-friendly Version
Interactive Discussion
budget (−28% in 2090) and an increase of the aridity. These changes are expected to alter vegetation coverage and consequently, accentuate the surface-runoffcontribution. At a global scale, Bates et al. (2008) recently reported that flash-floods and inun-dation should become more frequent worldwide. A regional analysis of precipitation intensity would be required to further improve our understanding of flood risk in the
5
highlands of Central Mexico.
Acknowledgements. The authors acknowledge all the persons who participated to this
pro-gram, financed by the STREAM ANR-project and the DESIRE European project, especially M. Esteves and C. Prat who coordinate these projects. The authors wish to thank the Centro de Investigaciones en Ecosistemas, particularly K. A. Oyama. Our thanks are extended to the
10
Comisi ´on Nacional del Agua for providing us with the long-term hydro-climatologic data and for all people who contributed to the digitalization (P. Burgos, C. Hernandez Wences and S. Van Hecke).
15
The publication of this article is financed by CNRS-INSU.
References
Alcocer, J. and Escobar, E.: Morphometric characteristics of six Mexican coastal-lakes related to productivity, Rev. Biol. Trop., 41(2), 171–179, 1993.
Bates, B. C., Kundzewicz, Z. W., Wu, S., and Palutikof, J. P.: Climate Change and Water,
20
Technical Paper VI of the Intergovernmental Panel on Climate Change, IPCC Secretariat, Geneva, 210 pp., 2008.
HESSD
6, 6865–6893, 2009Increase in surface runoffin Central
Mexico
N. Gratiot et al.
Title Page
Abstract Introduction
Conclusions References
Tables Figures
◭ ◮
◭ ◮
Back Close
Full Screen / Esc
Printer-friendly Version
Interactive Discussion
hydrographs, in: Proceedings of the NZHS-IAH-NZSSS 2005 Conference, Auckland, New Zealand, 28 November–2 December 2005, 2005.
Carl ´on Allende, T., Mendoza, M. E., L ´opez-Granados, E. M., and Morales-Manilla, L. M.:
Hy-drogeographical regionalisation: an approach for evaluating the effects of land cover change
in watersheds, a case study in the Cuitzeo Lake watershed, Central Mexico, Water Resour.
5
Manag., 23(12), 2587–2603, 2009.
Carl ´on Allende, T. and Mendoza, M. E.: An ´alisis hidrometeorol ´ogico de las estaciones de la
cuenca del lago de Cuitzeo, Investigaciones Geogr ´aficas, Bolet´ın del Instituto de Geograf´ıa,
UNAM, 63, 56–76, 2007.
Chapman, T.: A comparison of algorithms for streamflow recession and baseflow separation,
10
Hydrol. Process., 13, 701–714, 1999.
Crookston, N. L.: Custom climate data requests, in: Climate Estimates, Climate Change and Plant Climate Relationships, Moscow Forestry Sciences Laboratory, Rocky Mountain Research Station, USDA Forest service, http://forest.moscowfsl.wsu.edu/climate/, access: 15 December 2008.
15
Garc´ıa-Ruiz, J. M., Reg ¨u ´es, D., Alvera, B., Lana-Renault, N., Serrano-Muela, P.,
Nadal-Romero, E., Navas, A., Latron, J., Mart´ı-Bono, C., and Arnaez, J.: Flood generation and
sediment transport in experimental catchments affected by land use changes in the central
Pyrenees, J. Hydrol., 356(1–2), 245–260, 2008.
Hirsch, R. M., Slack, J. R., and Smith, R. A.: Techniques of trend analysis for monthly water
20
quality data, Water Resour. Res., 18(1), 107–121, 1982.
Instituto Nacional de Estad´ıstica y Geograf´ıa (INEGI): Carta edafol ´ogica 1:50 000, Map number
EI4A23, Morelia, 2002.
Instituto Nacional de Estad´ıstica y Geograf´ıa (INEGI): Conteo de Poblaci ´on y Vivienda 2005,
Resultados definitivos, Sistema Nacional de Informaci ´on Estad´ıstica y Geogr ´afica, M ´exico,
25
2006.
Jiang, T., Su, B., and Hartmann, H.: Temporal and spatial trends of precipitation and river flow in the Yangtze River Basin, 1961–2000, Geomorphology, 85(3–4), 143–154, 2007.
Kendall, M. G.: Rank Correlation Methods, Griffin, London, 1975.
Lettenmaier, D., Wood, E., and Wallis, J.: Hydro-climatological trends in the continental United
30
States, 1948–88, J. Climate, 7, 586–607, 1994.
HESSD
6, 6865–6893, 2009Increase in surface runoffin Central
Mexico
N. Gratiot et al.
Title Page
Abstract Introduction
Conclusions References
Tables Figures
◭ ◮
◭ ◮
Back Close
Full Screen / Esc
Printer-friendly Version
Interactive Discussion
Central Mexico, Agr. Syst., 90, 62–78, 2006.
L ´opez-Granados, E. M., Bocco, G., and Mendoza, M. E.: Predicci ´on del cambio de cobertura
y uso del suelo, El caso de la ciudad de Morelia, Investigaciones Geogr ´aficas, Bolet´ın del
Instituto de Geograf´ıa, UNAM, 45, 56–76, 2001.
Mann, H. B.: Nonparametric tests against trend, Econometrica, 13, 245–259, 1945.
5
Marengo, J. A. and Tomasella, J.: Trends in streamflow and rainfall in tropical South America: Amazonia, eastern Brazil, and northwestern Peru, J. Geophys. Res., 103, 1775–1783, 1998.
Mendoza, M. E. and L ´opez-Granados, E. M.: Caracterizaci ´on f´ısico-geogr ´afica de la subcuenca
de Cointzio, Michoac ´an: informaci ´on b ´asica para el manejo integrado de cuencas, in: Bases Metodol ´ogicas para el Manejo Integrado de Cuencas Hidrol ´ogicas, edited by: S
´anchez-10
Brito, C., Fragoso-Tirado, E., and Bravo-Espinoza, M., Libro T ´ecnico INIFAP, 2007.
Metcalfe, S. E., Davies, S. J., Braisby, J. D., Leng, M. J., Newton, A. J., Terrett, N. L., and O’Hara, S. L.: Long and short-term change in the P ´atzcuaro Basin, central Mexico, Palaeo-geogr. Palaeocl., 247(3–4), 272–295, 2007.
Morales, D.: Michoac ´an ha perdido 70% de aguas superficiales en los ´ultimos 100 a ˜nos, La
15
Jornada Michoac ´an, 25 November 2007.
Nathan, R. J. and McMahon, T. A.: Evaluation of automated techniques for baseflow and re-cession analyses, Water Resour. Res., 26(7), 1465–1473, 1990.
Neff, B. P., Day, S. M., Piggott, A. R., and Fuller, L. M.: Base Flow in the Great Lakes Basin, US
Geological Survey Scientific Investigations Report 2005, 5217, 23 pp., 2005.
20
Ortiz- ´Avila, T.: Estrategia interinstitucional para el quehacer ambiental municipal en
Mi-choac ´an: experiencias y propuestas de la Unidad de Vinculaci ´on del CIEco, Conference, Centro de Investigaciones en Ecosistemas, UNAM Campus Morelia, Mexico, April 2009. Pettyjohn, W. A. and Henning, R.: Preliminary estimate of ground-water recharge rates, related
streamflow and water quality in Ohio, Ohio State University, Water Resources Center Project
25
Completion Report Number 552, 323 pp., 1979.
Poulenard, J., Podwojewski, P., Janeau, J. L., and Collinet, J.: Runoffand soil erosion under
rainfall simulation of Andisols from the Ecuadorian P ´aramo: effect of tillage and burning,
Catena, 45, 185–207, 2001.
Ranzi, R., Bochicchio, M., and Bacchi, B.: Effects on floods of recent afforestation and
urbani-30
sation in the Mella River (Italian Alps), Hydrol. Earth Syst. Sci., 6, 239–254, 2002, http://www.hydrol-earth-syst-sci.net/6/239/2002/.
plant-HESSD
6, 6865–6893, 2009Increase in surface runoffin Central
Mexico
N. Gratiot et al.
Title Page
Abstract Introduction
Conclusions References
Tables Figures
◭ ◮
◭ ◮
Back Close
Full Screen / Esc
Printer-friendly Version
Interactive Discussion
climate relationship for the western United States, Int. J. Plant Sci., 167(6), 1123–1150, 2006.
Rehfeldt, G. E.: A spline model of climate for the western United States, Gen. Tech. Rep. RMRS-GTR-165, Fort Collins, Colorado, USDA Forest Service, 2006.
Rubio, M.: Din ´amica del cambio de la cobertura y del uso de los suelos en la microcuenca
5
de At ´ecuaro (Michoac ´an, M ´exico), Una perspectiva desde las ciencias ambientales, PhD thesis, Univ. Michoacana de San Nicol ´as de Hidalgo, Univ. Aut. Barcelona, 253 pp., 1998. Saenz-Romero, C., Rehfeldt, G. E., Crookston, N. L., Duval, P., St-Amant, R., Beaulieu, J., and
Richardson, B. A.: Spline models of contemporary, 2030, 2060 and 2090 climates for Mexico and their use in understanding climate-change impacts on the vegetation, Climatic Change,
10
in press, 2009.
Sen, P. K.: Estimates of the regression coefficient based on Kendall’s tau, J. Am. Stat. Assoc.,
63, 1379–1389, 1968.
Sloto, R. A. and Crouse, M. Y.: HYSEP: a computer program for streamflow hydrograph separa-tion and analysis, US Geological Survey, Water-Resources Investigasepara-tions Report, 96-4040,
15
46 pp., 1996.
Susperregui, A. S., Gratiot, N., Esteves, M., and Prat, C.: A preliminary hydrosedimentary view of a highly turbid, tropical, manmade lake: Cointzio Reservoir (Michoac ´an, Mexico), Lake Reserv. Manage., 14(1), 31–39, 2009.
Vidal, J., Valero, M., and Rangel, R.: Frontera acu´ıcola, Comisi ´on del Plan Nacional Hidra ´ulico,
20
Mexico, 216 pp., 1985.
Vinson, D.: Impact of socio-environmental modifications on the sedimentary streams of the sub watershed of Cointzio, Morelia, Michoac ´an, Part 2: Meteorological and Hydrological Analysis, Internship report, Master AgroParisTech, Paris-Grignon, 32 pp., 2008.
Zhang, S. R., Lu, X. X., Higgitt, D. L., Chen, C. T., Han, J., and Sun, H.: Recent changes of
25
HESSD
6, 6865–6893, 2009Increase in surface runoffin Central
Mexico
N. Gratiot et al.
Title Page
Abstract Introduction
Conclusions References
Tables Figures
◭ ◮
◭ ◮
Back Close
Full Screen / Esc
Printer-friendly Version
Interactive Discussion
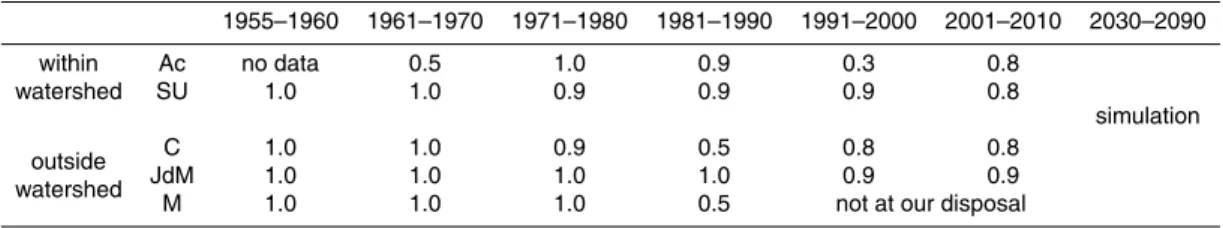
Table 1. Quality of the rain database for the five stations considered. A value of one
corre-sponds to a complete time-series.
1955–1960 1961–1970 1971–1980 1981–1990 1991–2000 2001–2010 2030–2090
within Ac no data 0.5 1.0 0.9 0.3 0.8
simulation
watershed SU 1.0 1.0 0.9 0.9 0.9 0.8
outside C 1.0 1.0 0.9 0.5 0.8 0.8
watershed JdM 1.0 1.0 1.0 1.0 0.9 0.9
HESSD
6, 6865–6893, 2009Increase in surface runoffin Central
Mexico
N. Gratiot et al.
Title Page
Abstract Introduction
Conclusions References
Tables Figures
◭ ◮
◭ ◮
Back Close
Full Screen / Esc
Printer-friendly Version
Interactive Discussion
Table 2.Results of Mann-Kendall and Sen’s tests for runoff, extreme discharges and
precipita-tion time-series.
S Calculated Critical Significant Trend Increase
Zscore Zvalue trend at 99% slopeβ between 1956
atα=0.01 confidence and 2001
%ASR 1956–2001 541 5.11 2.575 Increasing 0.33 +69%
Qdmax 1956–2001 463 4.37 2.575 Increasing 0.50 +232%
HESSD
6, 6865–6893, 2009Increase in surface runoffin Central
Mexico
N. Gratiot et al.
Title Page
Abstract Introduction
Conclusions References
Tables Figures
◭ ◮
◭ ◮
Back Close
Full Screen / Esc
Printer-friendly Version
Interactive Discussion
Fig. 1.Localisation of the Cointzio watershed in the Transvolcanic Mexican Belt. The darkened
HESSD
6, 6865–6893, 2009Increase in surface runoffin Central
Mexico
N. Gratiot et al.
Title Page
Abstract Introduction
Conclusions References
Tables Figures
◭ ◮
◭ ◮
Back Close
Full Screen / Esc
Printer-friendly Version
Interactive Discussion 1955 1960 1965 1970 1975 1980 1985 1990 1995 2000 2005
0 10 20 30 40
years
Qd
(m
3 s
−
1)
1955 1960 1965 1970 1975 1980 1985 1990 1995 2000 2005 0
50 100 150
P (mm)
b) Undameo a) Undameo Cointzio
Fig. 2.Hydrometeorological time-series.(a)Rain series at Santiago Undameo (black line) and
HESSD
6, 6865–6893, 2009Increase in surface runoffin Central
Mexico
N. Gratiot et al.
Title Page
Abstract Introduction
Conclusions References
Tables Figures
◭ ◮
◭ ◮
Back Close
Full Screen / Esc
Printer-friendly Version
Interactive Discussion
0 2 4 6 8 10
0 2 4 6 8 10
Qd : 3 times a day (m3.s−1) Qd
: every 5’ (m
3.s
−
1)
a) y = 1.01*x + 0.02 r 2 =0.99
−60 −40 −20 0 20 40 60 20
40 60 80 100
Relative error (%)
Number of values per class
σd= 7%
Fig. 3. (a)Inter-comparison of sub-sampled time-series (three times a day) and real-time water
discharge measurements for the 2008 year. (b) Distribution of the relative error for the time
HESSD
6, 6865–6893, 2009Increase in surface runoffin Central
Mexico
N. Gratiot et al.
Title Page
Abstract Introduction
Conclusions References
Tables Figures
◭ ◮
◭ ◮
Back Close
Full Screen / Esc
Printer-friendly Version
Interactive Discussion
01/06 01/07 01/08 01/09 01/10
0 5 10 15 20 25 30
days of the year 1994
01/06 01/07 01/08 01/09 01/10
0 5 10 15 20 25 30
days of the year 1993
m
3s
−
1
Qd
CBF 6 day time step CBF 10 day time step CBF 14 day time step
a) b)
Fig. 4. Application of the hydrological separation method (Eqs. 1 and 2) for(a)wet year 1993
HESSD
6, 6865–6893, 2009Increase in surface runoffin Central
Mexico
N. Gratiot et al.
Title Page
Abstract Introduction
Conclusions References
Tables Figures
◭ ◮
◭ ◮
Back Close
Full Screen / Esc
Printer-friendly Version
Interactive Discussion
0 1 2 3 4
days
Q (m3s−1)
Rain (mm)
Qd1 (m3s−1)
Qd2 (m3s−1)
Qd3 (m3s−1)
Qd4 (m3s−1)
12/09 19/09 26/09
0 10 20 30 40
year 1993
PUndameo (mm)
PCointzio (mm)
Qd (m3s−1)
a) b)
Fig. 5. Hydrograph separation when considering mean daily discharge Qd. (a) Conceptual
description of Eq. (3). While working withQd instead ofQinst, a reliable estimation of baseflow
(versus surface-runoff) is only possible for days without rain. In our example, Qd3 and Qd4
are the only days satisfying Eq. (3b). (b) Illustration through a real case. In 1993, four days
HESSD
6, 6865–6893, 2009Increase in surface runoffin Central
Mexico
N. Gratiot et al.
Title Page
Abstract Introduction
Conclusions References
Tables Figures
◭ ◮
◭ ◮
Back Close
Full Screen / Esc
Printer-friendly Version
Interactive Discussion
1950 1960 1970 1980 1990 2000 2010
101 102 103 104
years
precipitation (mm)
Cointzio Undameo
annual
sum P 5%
max P
Fig. 6. Main statistical indicators of precipitation time-series at Santiago Undameo and
HESSD
6, 6865–6893, 2009Increase in surface runoffin Central
Mexico
N. Gratiot et al.
Title Page
Abstract Introduction
Conclusions References
Tables Figures
◭ ◮
◭ ◮
Back Close
Full Screen / Esc
Printer-friendly Version
Interactive Discussion
1955 1960 1965 1970 1975 1980 1985 1990 1995 2000 2005
10 20 30 40 50 60 70 80
years
annual discharge (%)
19550 1960 1965 1970 1975 1980 1985 1990 1995 2000 2005
2 4 6 8
10x 10
7
years
annual discharge (m3)
ASR ABF a)
b)
Fig. 7.Evolution of Annual Surface Runoff(ASR) and Annual Base Flow (ABF) through 1956 to
2001:(a)in volume,(b)in percentage. The grey shading in (b) shows the range of predictions
HESSD
6, 6865–6893, 2009Increase in surface runoffin Central
Mexico
N. Gratiot et al.
Title Page
Abstract Introduction
Conclusions References
Tables Figures
◭ ◮
◭ ◮
Back Close
Full Screen / Esc
Printer-friendly Version
Interactive Discussion
1950 1960 1970 1980 1990 2000 2010
500 1000 1500
years
P annual (in mm)
y = − 0.31*x + 1.4e+003
1950 1960 1970 1980 1990 2000 2010
0 10 20 30 40 50
years Q d
max (in m
3 s
−
1 )
y = 0.51*x − 9.9e+002
1950 1960 1970 1980 1990 2000 2010
20 30 40 50
years
ASR (in %) y = 0.37*x − 6.9e+002
a)
c) b)
Fig. 8. Trends in precipitation, surface-runoff and extreme water discharges over the 1956–
HESSD
6, 6865–6893, 2009Increase in surface runoffin Central
Mexico
N. Gratiot et al.
Title Page
Abstract Introduction
Conclusions References
Tables Figures
◭ ◮
◭ ◮
Back Close
Full Screen / Esc
Printer-friendly Version
Interactive Discussion
1950 2000 2050 2100
16 18 20 22 24 26
years
T (°C)
1950 2000 2050 2100
0.06 0.08 0.1 0.12 0.14
years
Aridity index
1950 2000 2050 2100
500 600 700 800 900 1000 1100
years
P (mm)
Ac C Morelia SU JdM mean
Fig. 9. (a)Estimated annual precipitation for contemporary climate (period 1961–1990, centred
in 1975), and for a climate change scenario for decades centred in 2030, 2060 and 2090.
(b)Estimated mean annual temperature for contemporary climate (period 1961–1990, centred
in 1975), and for a climate change scenario for decades centred in 2030, 2060 and 2090.
(c)Annual aridity index for contemporary climate (period 1961–1990, centred in 1975), and for