BGD
6, 10089–10120, 2009
Organic carbon sequestration and
discharge
S. J. Kim et al.
Title Page
Abstract Introduction
Conclusions References
Tables Figures
◭ ◮
◭ ◮
Back Close
Full Screen / Esc
Printer-friendly Version
Interactive Discussion
Biogeosciences Discuss., 6, 10089–10120, 2009 www.biogeosciences-discuss.net/6/10089/2009/ © Author(s) 2009. This work is distributed under the Creative Commons Attribution 3.0 License.
Biogeosciences Discussions
Biogeosciences Discussionsis the access reviewed discussion forum ofBiogeosciences
Organic carbon sequestration and
discharge from a deciduous forest
catchment in Korea
S. J. Kim1, J. Kim1, and K. Kim2
1
Global Environment Laboratory and Department of Atmospheric Sciences, Yonsei University, Seoul 120-749, Korea
2
Forest Water Resources Laboratory, Korea Forest Research Institute, Seoul 130-712, Korea Received: 21 September 2009 – Accepted: 12 October 2009 – Published: 28 October 2009 Correspondence to: S. J. Kim ([email protected])
BGD
6, 10089–10120, 2009
Organic carbon sequestration and
discharge
S. J. Kim et al.
Title Page
Abstract Introduction
Conclusions References
Tables Figures
◭ ◮
◭ ◮
Back Close
Full Screen / Esc
Printer-friendly Version
Interactive Discussion
Abstract
Soil infiltration and surface discharge of precipitation are critical processes that affect the sequestration and discharge of dissolved organic carbon (DOC) and particulate organic carbon (POC) in forested catchments. Both DOC and POC are highly con-centrated in the soil surface in most forest ecosystems and their discharge may not
5
be negligible particularly under the monsoon climate. In East Asia, however, there are little data available to evaluate the role of such processes in forest carbon budget. In this paper, we address two basic questions: 1) how does stream discharge respond to storm events in a forest catchment? and 2) how much DOC and POC are discharged from the catchment particularly during the summer monsoon period? To answer these
10
questions, we collected hydrological data (e.g., precipitation, soil moisture, runoff dis-charge, groundwater level) and conducted hydrochemical analyses (including DOC, POC, and six tracers) for a deciduous forest catchment in Gwangneung National Ar-boretum in west-central Korea. Based on the end-member mixing analysis of the six storm events during the summer monsoon in 2005, the surface discharge was
esti-15
mated as 30 to 80% of the total runoffdischarge. The stream discharge responded to precipitation within 12 h during these storm events. The annual discharge of DOC and POC from the catchment was estimated as 0.04 and 0.05 t C ha−1yr−1, respectively.
Approximately 70% of the annual organic carbon efflux occurred during the summer
monsoon period. Overall, the annual discharge of organic carbon was estimated to
20
be 4 to 14% of the net ecosystem carbon exchange (NEE) obtained by eddy covari-ance technique at the same site. Considering the current trends of increasing intensity and amount of summer rainfall and the large interannual variability in NEE, ignoring the organic carbon discharge from forest ecosystems would result in an overestimation (underestimation) of the strength of forests as a carbon sink (source) in the monsoon
25
BGD
6, 10089–10120, 2009
Organic carbon sequestration and
discharge
S. J. Kim et al.
Title Page
Abstract Introduction
Conclusions References
Tables Figures
◭ ◮
◭ ◮
Back Close
Full Screen / Esc
Printer-friendly Version
Interactive Discussion
1 Introduction
A significant portion of carbon stored in terrestrial ecosystems is exported with water movement in both organic and inorganic forms, which are defined as particulate organic carbon (POC), dissolved organic carbon (DOC), and dissolved inorganic carbon (DIC). The transport of terrestrial carbon into streams, rivers and eventually the oceans is an
5
important link in the global carbon cycle (Ludwig et al., 1996; Warnken and Santschi, 2004; Battin et al., 2009). Of the organic carbon entering rivers globally, about 50% is transported to the ocean, 25% is oxidized within the system, and 25% stored as POC in the system as sediment (Hope et al., 1994). As compared to the terrestrial carbon sinks (of 1.9–2.8 Gt C yr−1), the organic carbon transport from terrestrial ecosystems
10
to oceans has been estimated to be 0.4–0.9 Gt C yr−1 (Meybeck, 1982; Hope et al., 1994; Prentice et al., 2001; Canadell et al., 2007; Battin et al., 2009), representing a substantial component of the ecosystem carbon balance. Hydrological processes strongly affected organic carbon discharge from terrestrial ecosystems especially in the monsoon climate regions. In East Asia, for example, 60 to 80% of annual organic
15
carbon is exported to the ocean during the summer monsoon (Tao, 1998; Liu et al., 2003; Kawasaki et al., 2005; Zhang et al., 2009).
Forests are the major terrestrial biome, in which soils and vegetation are the primary sources of DOC and POC in the streamwater. Within the forest soil profile, concen-trations of DOC are highest typically in the interstitial waters of the organic-rich upper
20
soil horizons (McDowell and Likens, 1988; Richter et al., 1994; Dosskey and Bertsch, 1997). A significant portion of DOC is transported by the preferential flow, given that the state of adsorption equilibrium cannot be reached owing to the reduced contact time between DOC and the soil surface (e.g., Jardine et al., 1989; Hagedorn et al., 1999). Understanding the flow paths of DOC discharge from forested catchments to
25
BGD
6, 10089–10120, 2009
Organic carbon sequestration and
discharge
S. J. Kim et al.
Title Page
Abstract Introduction
Conclusions References
Tables Figures
◭ ◮
◭ ◮
Back Close
Full Screen / Esc
Printer-friendly Version
Interactive Discussion
The identification of flow paths in forested catchments has been elusive because of difficulties in measuring subsurface flow. Forested catchments are spatially complex and subsurface flow is invisible. Hence, one can only infer the movement and mixing of water from the natural tracer elements that the water carries (Pinder and Jones, 1969). Using various tracers, the end-member mixing analysis has been used to elucidate
5
flow paths and hydrological processes in several catchments (e.g. Hooper et al., 1990; Christophersen et al., 1990; Elsenbeer et al., 1995; Katsuyama et al., 2001). Numer-ous conceptual models have adopted the flow path dynamics proposed by Anderson et al. (1997), i.e., both pre-event soil water and bedrock groundwater contribute to the formation of a saturated zone in the area adjacent to the stream (e.g., McGlynn et al.,
10
1999; Bowden et al., 2001; Uchida et al., 2002).
Storm events can alter DOC and POC concentrations and fluxes significantly by shifting dominant flow paths toward preferential flow through macropores, runoff, and lateral flow (Tipping et al., 1997; Katsuyama and Ohte, 2002; McGlynn and McDonnell, 2003). The concentration of POC depends notably on stream discharge and the
con-15
centration of suspended particulates, suggestive of particle mobilization when physical thresholds are exceeded (Tipping et al., 1997). The higher pore water velocity leads to the shorter contact time between soil water and the solid matrix, which creates condi-tions of chemical and physical non-equilibrium. Thus, adsorption of DOC is diminished in mineral soil horizons. Flushing of DOC adsorbed on aggregate surfaces and
con-20
centrated in subsurface micropores also contributes to increasing DOC concentrations and efflux at the beginning of storm events (e.g., Kalbitz et al., 2000).
In Korea, more than 50% of annual precipitation falls in the summer monsoon sea-son, which discharges quickly to the ocean due to steep slopes and short river lengths (<500 km). However, the paucity of observation data hinders our scrutiny of flow paths,
25
BGD
6, 10089–10120, 2009
Organic carbon sequestration and
discharge
S. J. Kim et al.
Title Page
Abstract Introduction
Conclusions References
Tables Figures
◭ ◮
◭ ◮
Back Close
Full Screen / Esc
Printer-friendly Version
Interactive Discussion
DOC concentrations in throughfall, soil water, groundwater, and streamwater during the storm events with two questions in mind: 1) how does stream discharge respond to storm events in this forest catchment? and 2) how much DOC and POC are discharged from the catchment particularly during the summer monsoon period? In this paper, we present the results of our analyses and demonstrate the importance of the water cycle
5
in the carbon budget estimation in a forested catchment under the monsoon climate.
2 Materials and methods
2.1 Study site
The study was conducted in a deciduous forest catchment (22.0 ha) at the Gwangne-ung catchment (221 ha) located in the west-central part of the Korean Peninsula
10
(37◦45′25.37′′N, 127◦9′11.62′′E) with an elevation ranging from 90 to 470 m (Fig. 1). This forest catchment is a core flux measurement site where long-term ecological, meteorological and hydrological studies have been conducted to ascertain water and carbon exchanges (http://www.koflux.org). The (30-yr normal) annual air temperature at the site is 11.5◦C; mean annual precipitation and runoff(from 1982 to 2004) are 1332
15
and 809 mm, respectively. The Gwangneung catchment is a tributary drainage of the Bongsunsa, the Toegyewon, and the Han River basin in an increasing order (Fig. 1).
The study area is dominated by an old natural forest ofQuercus sp.andCarpinus sp.
(80–200 yr old), and represents a typical montane landscape of the country. The catch-ment is covered with weathered gneiss, and the hillsides are dominated by slopes of
20
BGD
6, 10089–10120, 2009
Organic carbon sequestration and
discharge
S. J. Kim et al.
Title Page
Abstract Introduction
Conclusions References
Tables Figures
◭ ◮
◭ ◮
Back Close
Full Screen / Esc
Printer-friendly Version
Interactive Discussion
2.2 Hydrological measurements
Stream discharge at the site was measured continuously at a 120◦V-notch weir located downstream of a spring through which groundwater emerges to the surface. Precip-itation was measured using a tipping bucket near the gauging station. Water-filled porosity was recorded every 5 min. at two sites with time-domain-reflectometry (TDR)
5
rods at 0–0.1, 0–0.3, and 0.3–0.6 m in depth (Fig. 1c).
Based on a hydrological perspective, we classified the groundwater into two cate-gories, i.e., the responses of the groundwater level to storm events and on the usual groundwater condition. The SP1 and SP2 sites for the sampling of hillslope ground-water (HGW) were located in the upper slope of the catchment where the groundground-water
10
level changed noticeably. During the dry season, the saturated groundwater table did not appear in HGW, and the response to storm events was the same as that for the riparian groundwater. The R1 and R2 sites for the sampling of riparian groundwater (RGW) were located in the riparian zone in the middle slope of the catchment. This zone was saturated with groundwater throughout the year.
15
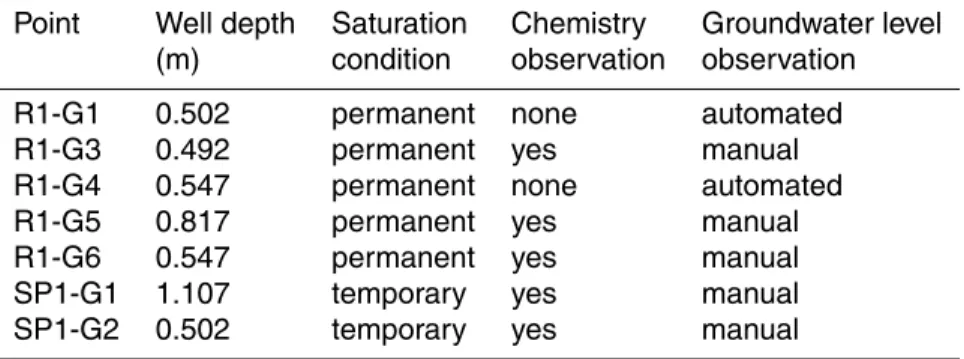
In April 2005, we installed the wells made of bore pipes with 0.05 m in diameter, perforated with small holes around their bottoms (Table 1). The R1 area was adjacent to the stream and was saturated with groundwater throughout the year. The SP1 area was not saturated except during the storm events. The groundwater levels at R1-G1 and R1-G4 were measured by automatic multi-probe data loggers (CTD-diver, Van
20
Essen Instruments, The Netherlands) at 1 min. intervals. The groundwater levels at R1-G3, R1-G5, R1-G6, SP1-G1, and SP1-G2 were measured by the water-level logger before sampling.
2.3 Sampling and chemical analysis
Samples of throughfall, soil water, hillslope groundwater, riparian groundwater, spring
25
BGD
6, 10089–10120, 2009
Organic carbon sequestration and
discharge
S. J. Kim et al.
Title Page
Abstract Introduction
Conclusions References
Tables Figures
◭ ◮
◭ ◮
Back Close
Full Screen / Esc
Printer-friendly Version
Interactive Discussion
the gauging station. To collect soil water, we installed two tension-free lysimeters at a depth of 0.05 m at SP1, SP2, R1, and R2 in April 2005. The lysimeters were made of PVC funnel (0.2×0.3×0.05 m) attached to two outlets with silicon sample extraction
tubes. Groundwater was collected weekly using a silicon tube and 50 ml injector. The spring water was collected weekly using a 50 ml injector. The stream water samples
5
during the storm events were collected by automated water sampler (6712FR, ISCO, USA) every 2 h for 48 h, except DOC samples between 1 and 3 July 2005. We col-lected events samples for six storms: 26–28 June (E050626), 1–3 July (E050701), 9–10 July (E050709), 24–26 August (E050824), 13–15 September (E050913), and 30
September–2 October (E050930) in 2005. Hillslope runoffsamples were collected at
10
SP1, SP2, and R1 during the storm events (i.e., E050626, E050701, and E050913). The electric conductivity (EC) of water samples was measured with an electrode probe (013010MD, Thermo Electron Co., USA). Samples for ion analysis were sealed in 200 ml polyethylene bottles, and were refrigerated until analysis. The concentrations of Cl−, SO24−, Na+, Mg2+, and Ca2+ were analyzed by ion chromatography (Cl− and
15
SO24−, DE/S-135, Sykam, Germany; Na+, Mg2+, and Ca2+, DX-320, Dionex, USA) after filtering through a cellulose acetate filter with 0.45µm pore. The DOC and POC samples were collected in 150 ml glass bottles wrapped with aluminum foil, and 0.01 g HgCl was added to inhibit bacterial decomposition. Samples were refrigerated until analysis. We used glass microfiber filter with 0.7µm pore (GF/F, Whatman, USA) after
20
combusting at 500◦C for two hours to remove organic contaminants in the filter. The
samples were filtered through this contaminant-free glass microfiber filter, and added with 1 ml of 1 M HCl to remove inorganic carbon before analysis. DOC concentration was analyzed by carbon analyzer (Multi N/C 3000 analyzer, Analytik Jena, Germany). Suspended particulate was collected by filtering known volumes (30–110 ml) of water
25
BGD
6, 10089–10120, 2009
Organic carbon sequestration and
discharge
S. J. Kim et al.
Title Page
Abstract Introduction
Conclusions References
Tables Figures
◭ ◮
◭ ◮
Back Close
Full Screen / Esc
Printer-friendly Version
Interactive Discussion
2.4 Hydrographic separation
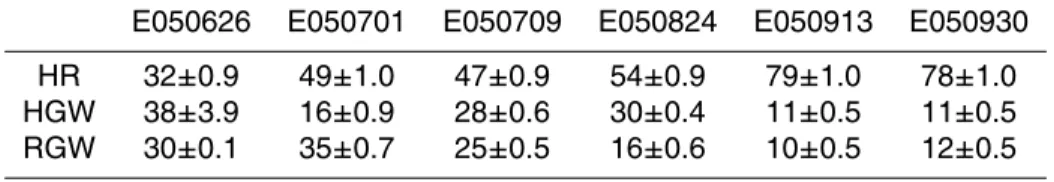
The end-member mixing analysis (EMMA) with principal components analysis (PCA) was applied to each storm event to evaluate quantitatively the contribution of each wa-ter component (Christophersen and Hooper, 1992; Burns et al., 2001). The dataset consisted of six tracers (EC, Cl−, SO24−, Na+, Mg2+, and Ca2+) for 146 samples of
5
stream water from the headwater catchment. The data were standardized into a corre-lation matrix, and a PCA was performed on the correcorre-lation matrix using all six tracers, and all combinations of six tracers. A model was selected that accounted for the great-est amount of variability with two principal components.
The PCA chosen for the use of EMMA incorporated six tracers, because the first
10
two principal components from the covariance matrix explained 94% of the variabil-ity in these data. We selected three end-members with large spatial and temporal concentration variations within the catchment. We used the hillslope runoffas an end-member, which was collected at SP1, SP2, and R1 areas during the storm events (i.e., E050626, E050701, and E050913). The solutes for hillslope and riparian
groundwa-15
ter end-members were collected at SP1 and R1 areas before individual storm events (Fig. 1).
The contribution of each end-member was calculated by solving the following si-multaneous mass balance equations (e.g., Hooper et al., 1990; Burns et al., 2001; Katsuyama et al., 2001):
20
QHR+QHGW+QRGW=Qst (1)
U1HRQHR+U1HGWQHGW+U1RGWQRGW=U1stQst (2)
U2HRQHR+U2HGWQHGW+U2RGWQRGW=U2stQst (3)
whereQ is the discharge; subscripts HR, HGW, RGW, and st denote hillslope runoff, hillslope groundwater, riparian groundwater, and stream water, respectively; and U1
25
BGD
6, 10089–10120, 2009
Organic carbon sequestration and
discharge
S. J. Kim et al.
Title Page Abstract Introduction Conclusions References Tables Figures ◭ ◮ ◭ ◮ Back Close
Full Screen / Esc
Printer-friendly Version
Interactive Discussion
2.5 Time lag calculation
We quantified the time lag between the precipitation and stream discharge by calculat-ing the cross correlation (CAB), which measures the persistence of two signals (Aand
B) during the measurement period and is defined as (Stull, 1988):
CAB(L)=
N−j−1
P
k=0
h
Ak−Ak Bk+j −Bk+j
i
"
N−j−1
P
k=0
Ak−Ak
2 #1/2"
N−j−1
P
k=0
Bk+j−Bk+j
2 #1/2
(4)
5
where L is time lag (=j∆t), ∆t is measurement interval, Ak=N1−j
N−j−1
P
k=0
Ak and
Bk+j=N1−j
N−j−1
P
k=0
Bk+j.
2.6 Estimation of water and DOC infiltration
To estimate the water infiltration rate, we calculated the groundwater recharge rate from the groundwater table fluctuation following Moon et al. (2004):
10
α= P∆h
P ×Sy (5)
whereα is the recharge rate,∆his the change of groundwater level,P is precipitation, andSy is the specific yield.
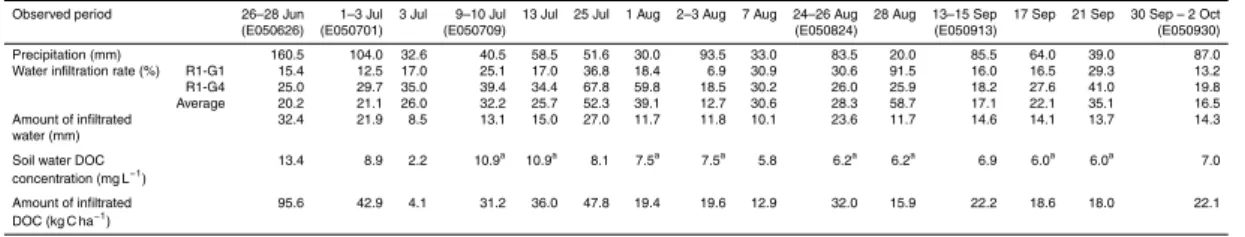
DOC infiltration was calculated from multiplying the water infiltration and DOC con-centration in soil water at R1 each precipitation.
BGD
6, 10089–10120, 2009
Organic carbon sequestration and
discharge
S. J. Kim et al.
Title Page
Abstract Introduction
Conclusions References
Tables Figures
◭ ◮
◭ ◮
Back Close
Full Screen / Esc
Printer-friendly Version
Interactive Discussion
3 Results
3.1 Hydrological characteristics of the storm events
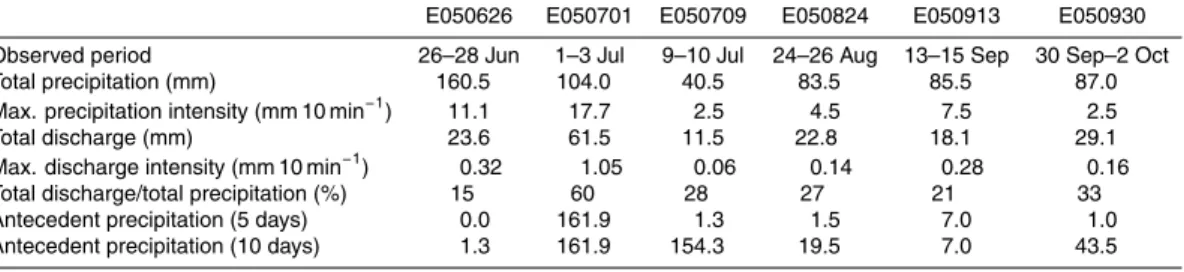
The hydrological characteristics of the six storm events observed during and after the monsoon season in 2005 are summarized in Table 2. The precipitation intensity and discharge intensity were highest on 1 July during E050701 with 17.7 mm 10 min−1and
5
1.0 mm 10 min−1, respectively. The proportion of stream discharge relative to the total precipitation ranged from 15 to 60% with an average of 30%. The maximum discharge rate was also observed during this period, which was associated with five days’ an-tecedent precipitation.
Figure 2 shows precipitation, water-filled porosity, groundwater level, and stream
10
discharge for the six storm events. As expected, the water-filled porosity in the shallow soil layer increased more quickly and to a greater extent than in the deeper soil layer. The groundwater level at R1-G4 sensitively responded to the precipitation. In E050626, the groundwater level in the beginning was 0.3 m below the surface, which gradually increased to the subsurface and then decreased.
15
Table 3 shows the time lags computed from the cross correlation analysis among stream discharge, precipitation, and filled porosity. The time lags between water-filled porosity and stream discharge were<10 min, except for the 0.3–0.6 m soil layer in E050626 and E050913, which yielded time lags of 1 h 30 min and 30 min, respectively. When the maximum precipitation intensity was higher than 7 mm 10 min−1, the time
20
lag between the stream discharge and precipitation was of the order of 20 to 30 min. Time lags between precipitation and water-filled porosity varied from 2 to 11 h with low correlations.
3.2 Flow paths of water during the storm events
The relative contributions of each flow paths are summarized in Table 4. In E050626,
25
BGD
6, 10089–10120, 2009
Organic carbon sequestration and
discharge
S. J. Kim et al.
Title Page
Abstract Introduction
Conclusions References
Tables Figures
◭ ◮
◭ ◮
Back Close
Full Screen / Esc
Printer-friendly Version
Interactive Discussion
stream discharge throughout the period, except for the time of the peak precipitation
when the surface runoff component accounted for about 40%. In E050701, the HR
component (which accounted for almost 50%) increased as the saturated zone spread out after the rainfall ceased. In E050709, the contributions of each component did not change significantly. Despite the low total precipitation and maximum precipitation
in-5
tensity (as compared to those in E050626 and E050701), E050824 showed a relatively high surface discharge of nearly 80% in the early stage. The groundwater compo-nent, however, increased to 60% by the end of E050824. In the fall (i.e., E050913 and E050930), the surface discharge was high up to almost 80% (Table 4).
In E050913 and E050930, the values of water-filled porosity in the surface layer
10
(0–0.1 m) was about 5% higher than the maximum observed during the previous storm events (Fig. 2). This higher water-filled porosity (as compared to prior storm events) led to a low water infiltration rate and an increase in the contribution of surface discharge (Tables 4 and 5). Previous studies suggested that a maintained precipitation expands the saturation zone and increases macropore flows in the forested catchment (e.g.,
15
McDonnell, 1990). Such macropore flows deliver new water in which dissolved ion concentrations are low because of the short contact time with soil and bedrock (Burns et al., 1998). Table 4 also suggests a potential contribution of the overland flow to the stream discharge in E050913 and E050930.
3.3 Variations of DOC and POC in stream water and soil profile
20
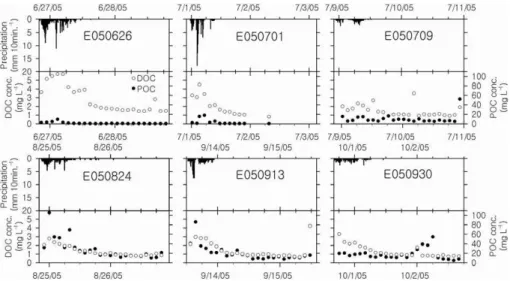
Temporal variations in DOC and POC concentrations during the individual storm events are shown in Fig. 3. The DOC concentrations in E050626 were higher than those in other storm events and were positively related to the discharge rate. The POC concentrations in the latter four storm events (i.e., E050709, E050824, E050913, and E050930) were higher than those in the former two storm events (i.e., E050626 and
25
E050701). After the precipitation ceased, the DOC and POC concentrations returned to the pre-storm levels.
in-BGD
6, 10089–10120, 2009
Organic carbon sequestration and
discharge
S. J. Kim et al.
Title Page
Abstract Introduction
Conclusions References
Tables Figures
◭ ◮
◭ ◮
Back Close
Full Screen / Esc
Printer-friendly Version
Interactive Discussion
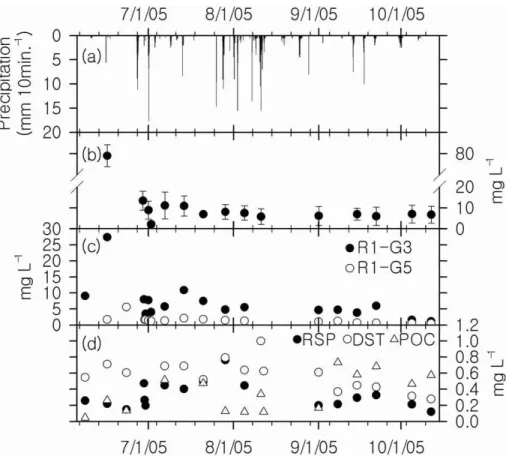
creased to 79 mg L−1, and drastically decreased to around 10 mg L−1 after first storm
events (Fig. 4a,b). For the entire observation period, the concentrations of DOC
in the groundwater at 0.5 m (R1-G3, R1-G6, and SP1-G2) were significantly higher (p<0.0001) than those in the groundwater at 0.8–1.0 m (R1-G5 and SP1-G1) (Fig. 5). The DOC concentrations of groundwater at 0.5 m in the riparian area (R1-G3) also
de-5
creased after the storm events (Fig. 4c). The DOC and POC concentrations observed in the spring water and the stream water during the periods of baseflow conditions were consistently low at<1.0 mg L−1(Fig. 4d).
4 Discussion
4.1 Effects of storm events on DOC and POC discharge
10
The DOC concentration in the soil water (0–0.05 m) was highest before the storm events (Fig. 4). Such a maximum concentration resulted from the increase in DOC concentrations following the rewetting due to small amount of precipitation (9.4 mm on 15 June) after dry periods (e.g., Tipping et al., 1999; Kalbitz et al., 2000), which was discharged later during E050626 and E050701 (Table 2).
15
The results from the hydrographic separation during the storm events indicated that a large amount of water discharged through the surface and subsurface soil layers
(HR+HGW; Table 4). An inverse relationship between DOC concentrations and water
fluxes in the organic soil horizons (Fig. 4b and Table 4) suggests that a simple leaching model might explain some of the seasonal changes in DOC (e.g., McDowell and Wood,
20
1984). The contact time between the soil and the soil water is critical for the concen-tration of dissolved material. The calculated mean residence time of water based on the35S analysis varied with changing water regime in the study area, ranging from 20 to 40 days during the summer monsoon period (Kim et al., 2009). Especially, for the
stream water sample taken on 15 September when the surface runoffincreased due
25
BGD
6, 10089–10120, 2009
Organic carbon sequestration and
discharge
S. J. Kim et al.
Title Page
Abstract Introduction
Conclusions References
Tables Figures
◭ ◮
◭ ◮
Back Close
Full Screen / Esc
Printer-friendly Version
Interactive Discussion
et al., 2009; Table 4). Thus, DOC concentrations were lower in the summer when more water passed through the forest floor with shorter contact time. On the contrary, the groundwater content with longer contact time may lead to higher DOC concentrations (e.g., Kalbitz et al., 2000).
The increase of POC concentration during the latter four storm events probably arose
5
from both catchment erosional processes and the entrainment of particulate material accumulated in the stream bed over the former storm events (e.g., Tipping et al., 1993). We suppose that the increase of surface runoffwould induce the sharp responses of POC concentration (Fig. 3 and Table 4).
To derive the annual DOC and POC fluxes for the entire year in 2005, a linear
re-10
gression of DOC and POC discharge was used against the stream discharge as an alternative method of estimating values during the periods of missing observation (Fig. 6a,b). In this study, the annual DOC and POC discharge from the Gwangneung decidu-ous forest catchment was estimated as about 0.04 and 0.05 t C ha−1
yr−1
, respectively (Fig. 6c). These values are equivalent to 2% of the annual net primary production
15
(NPP of 4.3 t C ha−1yr−1; Lim et al., 2003) and 4 to 14% of the net ecosystem carbon exchange (NEE of −2.46∼0.66 t C ha−1yr−1; Kwon et al., 2009) of the Gwangneung
deciduous forest (Fig. 7). Through the discharge processes as discussed previously,
50 and 80% of the annual DOC and POC efflux were transported out of this forest
catchment during the summer monsoon period.
20
4.2 DOC infiltration during the summer monsoon
According to the results from the water infiltration rates, 0.44 t C ha−1 DOC was infil-trated into the soil from late June to early October (Table 5), which represented approx-imately 8% of the stored carbon in the forest floor (5.6 t C ha−1
; Lim et al., 2003) and 20 to 70% of NEE (−2.46 to 0.66 t C ha−1yr−1; Kwon et al., 2009) (Fig. 7). These results
25
BGD
6, 10089–10120, 2009
Organic carbon sequestration and
discharge
S. J. Kim et al.
Title Page
Abstract Introduction
Conclusions References
Tables Figures
◭ ◮
◭ ◮
Back Close
Full Screen / Esc
Printer-friendly Version
Interactive Discussion
0.5% of the soil carbon (92.0 t C ha−1; Lim et al., 2003) would be retained from DOC during the summer monsoon (Fig. 7). While these values seem to be relatively small, soil organic carbon can be accumulated in the mineral soil for an extended period (e.g., Michalzik et al., 2003); potentially making the 0.5% of soil carbon retained from DOC during the summer monsoon an important component of the forest carbon budget to
5
consider (e.g., Battin et al., 2009).
4.3 Effects of antecedent precipitation on DOC discharge
The antecedent precipitation index (API) can be used to examine the effect of tempo-ral variation of precipitation on DOC concentration in the stream water during baseflow periods. This index is commonly used to model the residual effect of previous
precipita-10
tion on current soil moisture and runoffand can be calculated as (Ziemer and Albright, 1987; Uchida et al., 2002; Kawasaki, 2005):
API=
∞
X
i=1
0.5i /TPi (6)
where T is the “half-life” representing the decay characteristic of a particular reces-sion andPi is the daily precipitation during the i days beforehand. The values of T
15
were tested from 5 to 120 days. Figure 8 represents the changes in correlation coeffi -cient (r) as a function ofT, where the former is the relationship between stream water DOC concentration and API for the correspondingT. Ther values did not change sig-nificantly with T >10 d, suggesting that the antecedent precipitation did not cause the temporal variation of stream water DOC concentration. This result indicates that the
20
BGD
6, 10089–10120, 2009
Organic carbon sequestration and
discharge
S. J. Kim et al.
Title Page
Abstract Introduction
Conclusions References
Tables Figures
◭ ◮
◭ ◮
Back Close
Full Screen / Esc
Printer-friendly Version
Interactive Discussion
5 Conclusions
Based on our intensive field measurements for six storm events from June to Octo-ber in 2005, 30 to 80% of water was discharged through surface runoff in a natural deciduous forest catchment in Korea. Consequent rises of DOC and POC concentra-tion in streamwater were observed immediately upon the onset of these storm events.
5
Through these discharging processes, 50 and 80% of the annual DOC and POC efflux
(0.04 and 0.05 t C ha−1yr−1, respectively) was transported out of this forest catchment during the monsoon season. The annual organic carbon efflux was estimated to be 4 to 14% of the annual NEE of this forest ecosystem, that was small in terms of the total carbon budget of the whole ecosystem. However, 8% of litterfall carbon was estimated
10
to be infiltrated into the soil as DOC during the same period, which was accumulated in soil through adsorption processes. To better understand the carbon cycling in this catchment, it is necessary to estimate the annual accumulation of DOC and the concur-rent water movement in the soil. The organic carbon discharged from the ecosystems of the Korean river basin may constitute an important carbon sink through burial in
15
coastal sea sediments or sea floor, which may be accelerated by the annually recur-ring and intensified monsoon in East Asia. In order to make an accurate estimation of the ecosystem carbon budget, these missing components should be taken into account particularly in the monsoon Asia. The data presented in our study can be used to cal-ibrate and improve eco-hydrological schemes such as the Regional Hydrological and
20
Ecological Simulation System (RHESSys) model to examine the sensitive couplings between carbon and water exchanges, which are currently in progress.
Acknowledgements. This research was supported by grants (code: 1-8-3) from Sustainable Water Resources Research Center for 21st Century Frontier Research Program, the Long-term Ecological Study and Monitoring of Forest Ecosystem Project of Korea Forest Research
25
BGD
6, 10089–10120, 2009
Organic carbon sequestration and
discharge
S. J. Kim et al.
Title Page
Abstract Introduction
Conclusions References
Tables Figures
◭ ◮
◭ ◮
Back Close
Full Screen / Esc
Printer-friendly Version
Interactive Discussion
References
Anderson, S. P., Dietrich, W. E., Montgomery, D. R., Torres, R., Conrad, M. E., and Loague, K.: Subsurface flow paths in a steep unchanneled catchment, Water Resour. Res., 33, 2637– 2653, 1997.
Battin, Y. J., Luyssaert, S., Kaplan, L. A., Aufdenkampe, A. K., Richter, A., and Tranvik, L. J.:
5
The boundless carbon cycle, Nature Geosci., 2, 598–600, 2009.
Bowden, W. B., Fahey, B. D., Ekanayakem, J., and Murray, D. L.: Hillslope and wetland hydro-dynamics in a Tussock grassland, South Island, New Zealand, Hydrol. Process., 15, 1707– 1730, 2001.
Burns, D. A., Hooper, R. P., McDonnell, J. J., Freer, J. E., Kendall, C., and Beven, K.: Base
10
cation concentrations in subsurface flow from a forested hillslope: the role of flushing fre-quency, Water Resour. Res., 33, 3535–3544, 1998.
Burns, D. A., McDonnell, J. J., Hooper, R. P., Peters, N. E., Freer, J. E., Kendall, C., and Beven, K.: Quantifying contributions to storm runoff through end-member mixing analysis and hydrologic measurements at the Panola Mountain Research Watershed (Georgia, USA),
15
Hydrol. Process., 15, 1903–1924, 2001.
Canadell, J. G., Quere, C. L., Raupach, M., Field, C. B., Buitenhuis, E. T., Ciais, P., Con-way, T. J., Gillett, N. P., Houghton, R. A., and Marland, G.: Contributions to accelerating atmospheric CO2 growth from economic activity, carbon intensity, and efficiency of natural sinks, P. Natl. Acad. Sci. USA, 104, 18866–18870, 2007.
20
Christophersen, N., Neal, C., Hooper, R. P., Vogt, R. D., and Andersen, S.: Modelling streamwa-ter chemistry as a mixture of soilwastreamwa-ter end-members – a step towards second-generation acidification models, J. Hydrol., 116, 307–320, 1990.
Christophersen, N. and Hopper, R. P.: Multivariate analysis of stream water chemical data: the use of principal components analysis for the end-member mixing problem, Water Resour.
25
Res., 28, 99–107, 1992.
Dosskey, M. G. and Bertsch, P. M.: Transport of dissolved organic matter through a sandy forest soil, Soil Sci. Soc. Am. J., 61, 920–927, 1997.
Elsenbeer, H., Lorieri, D., and Bonell, M.: Mixing model approaches to estimate storm flow sources in an overland flow-dominated tropical rain forest catchment, Water Resour. Res.,
30
31, 2267–2278, 1995.
BGD
6, 10089–10120, 2009
Organic carbon sequestration and
discharge
S. J. Kim et al.
Title Page
Abstract Introduction
Conclusions References
Tables Figures
◭ ◮
◭ ◮
Back Close
Full Screen / Esc
Printer-friendly Version
Interactive Discussion
transformation in a forest soil: a field study with micro suction cups, Soil Sci. Soc. Am. J., 63, 1915–1923, 1999.
Hooper, R. P., Christophersen, N., and Peters, N. E.: Modelling streamwater chemistry as a mixture of soilwater end-members–an application to the Panola Mountain Catchment, Georgia, USA, J. Hydrol., 116, 321–343, 1990.
5
Hope, D., Billett, M. F., and Cresser, M. S.: A review of the export of carbon in river water: fluxes and processes, Environ. Pollut., 84, 301–324, 1994.
Jardine, P. M., Wilson, G. V., Luxmoore, R. J., and McCarthy, J. F.: Transport of inorganic and natural organic tracers through an isolated pedon in a forest watershed, Soil Sci. Soc. Am. J., 53, 317–323, 1989.
10
Kalbitz, K., Solinger, S., Park, J.-H., Michalzik, B., and Matzner, E.: Controls on the dynamics of dissolved organic matter in soils: a review, Soil Sci., 165, 277–304, 2000.
Katsuyama, M., Ohte, N., and Kobashi, S.: A three-component end-member analysis of streamwater hydrochemistry in a small Japanese forested headwater catchment, Hydrol. Process., 15, 249–260, 2001.
15
Katsuyama, M. and Ohte, N.: Determining the sources of stormflow from the fluorescence properties of dissolved organic carbon in a forested headwater catchment, J. Hydrol., 268, 192–202, 2002.
Kawasaki, M., Ohte, N., and Katsuyama, M.: Biogeochemical and hydrological controls on carbon export from a forested catchment in central Japan, Ecol. Res., 20, 347–358, 2005.
20
Kawasaki, M.: Hydrological and biogeochemical controls on dissolved organic carbon dynam-ics in forested headwater catchments, Unpublished PhD thesis, Kyoto University, Kyoto, 40– 42, 2005.
Kim, S.-J., Lee, D., and Kim, S.: Use of isotope data to determine mean residence time (MRT) of water in a forest catchment: 35S and3H-based estimates, Asia-Pac. J. Atmos. Sci., 45,
25
165–173, 2009.
Kwon, H., Kim, J., and Hong, J.: Influence of the Asian monsoon on interannual variability of net ecosystem carbon exchange in two major plant functional types in Korea, Biogeosciences, submitted, 2009.
Lim, J. H., Shin, J. H., Jin, G. Z., Chun, J. H., and Oh, J. S.: Forest stand structure, site
30
characteristics and carbon budget of the Gwangneung natural forest in Korea, Kor. J. Agr. Forest Meteorol., 5, 101–109, 2003.
BGD
6, 10089–10120, 2009
Organic carbon sequestration and
discharge
S. J. Kim et al.
Title Page
Abstract Introduction
Conclusions References
Tables Figures
◭ ◮
◭ ◮
Back Close
Full Screen / Esc
Printer-friendly Version
Interactive Discussion
solution, and stream water at the Guandaushi subtropical forest in Taiwan, For. Ecol. Manag., 172, 315–325, 2003.
Ludwig, W., Probst, J. L., and Kempe, S.: Predicting the oceanic input of organic carbon by continental erosion, Global Biogeochem. Cy., 10, 23–41, 1996.
McDonnell, J. J.: A rationale for old water discharge through macropores in a steep, humid
5
catchment, Water Resour. Res., 26, 1821–2832, 1990.
McDowell, W. H. and Likens, G. E.: Origin, composition, and flux of dissolved organic carbon in the Hubbard Brook valley, Ecol. Monogr., 58, 177–195, 1988.
McDowell, W. H. and Wood, T.: Soil processes control dissolved organic carbon concentration in stream water, Soil Sci., 137, 23–32, 1984.
10
McGlynn, B. L., McDonnell, J. J., Shanley, J. B., and Kendall, C.: Riparian zone flow path dynamics during snowmelt in a small headwater catchment, J. Hydrol., 222, 75–92, 1999. McGlynn, B. L. and McDonnell, J. J.: Role of discrete landscape units in
control-ling catchment dissolved organic carbon dynamics, Water Resour. Res., 39(4), 1090, doi:10.1029/2002WR001525, 2003.
15
Meybeck, M.: Carbon, nitrogen, and phosphorus transport by the world rivers, Am. J. Sci., 282, 401–450, 1982.
Michalzik, B., Tipping, E., Mulder, J., Gallardo Lancho, J. F., Matzner, E., Bryant, C. L., Clarke, N., Lofts, S., and Vicente Esteban, M. A.: Modelling the production and transport of dissolved organic carbon in forest soils, Biogeochemistry, 66, 241–264, 2003.
20
Moon, S.-K., Woo, N. C., and Lee, K. S.: Statistical analysis of hydrographs and water-table fluctuation to estimate groundwater recharge, J. Hydrol., 292, 198–209, 2004.
Neff, J. C. and Asner, G. P.: Dissolved organic carbon in terrestrial ecosystems: synthesis and a model, Ecosystems, 4, 29–48, 2001.
Pinder, G. F. and Jones, J. F.: Determination of the groundwater component of peak discharge
25
from the chemistry of total runoffwater, Water Resour. Res., 5, 438–445, 1969.
Prentice, I. C., Farquhar, G. D., Fasham, M. J. R., Goulden, M. L., Heimann, M., Jaramillo, V. J., Kheshgi, H. S., Le Qu ´er ´e, C., Scholes, R. J., and Wallace, D. W. R.: The carbon cycle and atmospheric carbon dioxide, in: Climate Change 2001: The Scientific Basis. Contribution of Working Group I to the Third Assessment Report of the Intergovernmental Panel on Climate
30
BGD
6, 10089–10120, 2009
Organic carbon sequestration and
discharge
S. J. Kim et al.
Title Page
Abstract Introduction
Conclusions References
Tables Figures
◭ ◮
◭ ◮
Back Close
Full Screen / Esc
Printer-friendly Version
Interactive Discussion
Richter, D. D., Markewitz, D., Wells, C. E., Allen, H. L., April, R., Heine, P. R., and Urrego, B.: Soil chemical change during three decades in an old-field loblolly pine (Pinus taedaL.) ecosys-tem, Ecology, 75, 1463–1473, 1994.
Stewart, A. J. and Wetzel, R. G.: Influence of dissolved humic materials on carbon assimilation and alkaline phosphatase activity in natural algal-bacterial assemblages, Freshwater Biol.,
5
12, 369–380, 1982.
Stull, R. B.: An Introduction to Boundary Layer Meteorology, Kluwer Academic Publishers, Dordrecht, 666 pp., 1988.
Tao, S.: Spatial and temporal variation in DOC in the Yichun River, China, Water Resour. Res., 32, 2205–2210, 1998.
10
Tipping, E., Woof, C., and Clarke, K.: Deposition and resuspension of fine particles in a riverine “dead zone”, Hydrol. Process., 7, 263–277, 1993.
Tipping, E., Marker, A. F. H., Butterwick, C, Collett, G. D., Cranwell, P. A., Ingram, J. K. G., Leach, D. V., Lishman, J. P., Pinder, A. C., Rigg, E., and Simon, B. M.: Organic carbon in the Humber rivers, Sci. Total Environ., 194/195, 345–355, 1997.
15
Tipping, E., Woof, C., Rigg, E., Harrison, A. F., Inneson, P., Taylor, K., Benham, D., Poskitt, J., Rowland, A. P., Bol, R., and Harkness, D. D.: Climatic influences on the leaching of dis-solved organic matter from upland UK moorland soils, investigated by a field manipulation experiment, Environ. Int., 25, 83–95, 1999.
Uchida, T., Kosugi, K., and Mizuyama, T.: Effect of pipeflow and bedrock groundwater on runoff
20
generation at a steep headwater catchment, Ashiu, central Japan, Water Resour. Res., 38, 1119, doi:10.1029/2001WR000261, 2002.
Warnken, K. W. and Santschi, P. H.: Biogeochemical behavior of organic carbon in the Trinity River downstream of a large reservoir lake in Texas, USA, Sci. Total Environ., 329, 131–144, 2004.
25
Zhang, S., Lu, X. X., Sun, H., Han, J., and Higgitt. D. L.: Geochemical characteristics and fluxes of organic carbon in a human-disturbed mountainous river (the Luodingjiang River) of the Zhujiang (Pearl River), China, Sci. Total Environ., 407, 815–825, 2009.
Ziemer, R. R. and Albright, J. S.: Subsurface pipeflow dynamics of north-costal California swale systems, in Proceedings of the Corvallis Symposium, Oregon, USA, 3–7 August, 1987,
30
BGD
6, 10089–10120, 2009
Organic carbon sequestration and
discharge
S. J. Kim et al.
Title Page
Abstract Introduction
Conclusions References
Tables Figures
◭ ◮
◭ ◮
Back Close
Full Screen / Esc
Printer-friendly Version
Interactive Discussion
Table 1.The Hydrological characteristics and observation at the observation wells.
BGD
6, 10089–10120, 2009
Organic carbon sequestration and
discharge
S. J. Kim et al.
Title Page
Abstract Introduction
Conclusions References
Tables Figures
◭ ◮
◭ ◮
Back Close
Full Screen / Esc
Printer-friendly Version
Interactive Discussion
Table 2.Hydrological characteristics of the six storm events from June to October 2005.
E050626 E050701 E050709 E050824 E050913 E050930
Observed period 26–28 Jun 1–3 Jul 9–10 Jul 24–26 Aug 13–15 Sep 30 Sep–2 Oct Total precipitation (mm) 160.5 104.0 40.5 83.5 85.5 87.0 Max. precipitation intensity (mm 10 min−1) 11.1 17.7 2.5 4.5 7.5 2.5
Total discharge (mm) 23.6 61.5 11.5 22.8 18.1 29.1
BGD
6, 10089–10120, 2009
Organic carbon sequestration and
discharge
S. J. Kim et al.
Title Page
Abstract Introduction
Conclusions References
Tables Figures
◭ ◮
◭ ◮
Back Close
Full Screen / Esc
Printer-friendly Version
Interactive Discussion
Table 3.Estimated time lags among stream discharge (SD), precipitation (P), and water-filled porosity (WFP). The numbers in the parentheses indicate cross correlation coefficients.
E050626 E050701 E050709 E050824 E050913 E050930
BGD
6, 10089–10120, 2009
Organic carbon sequestration and
discharge
S. J. Kim et al.
Title Page
Abstract Introduction
Conclusions References
Tables Figures
◭ ◮
◭ ◮
Back Close
Full Screen / Esc
Printer-friendly Version
Interactive Discussion
Table 4.The relative contribution and uncertainty (%) of hillslope runoff(HR), hillslope ground-water (HGW), and riparian groundground-water (RGW) for the six storm events from June to October 2005.
BGD
6, 10089–10120, 2009
Organic carbon sequestration and
discharge
S. J. Kim et al.
Title Page
Abstract Introduction
Conclusions References
Tables Figures
◭ ◮
◭ ◮
Back Close
Full Screen / Esc
Printer-friendly Version
Interactive Discussion
Table 5. The precipitation, water infiltration rate, amount of infiltrated water, soil water DOC concentration, and amount of in filtrated DOC for the each precipitation at R1.
Observed period 26–28 Jun 1–3 Jul 3 Jul 9–10 Jul 13 Jul 25 Jul 1 Aug 2–3 Aug 7 Aug 24–26 Aug 28 Aug 13–15 Sep 17 Sep 21 Sep 30 Sep – 2 Oct
(E050626) (E050701) (E050709) (E050824) (E050913) (E050930)
Precipitation (mm) 160.5 104.0 32.6 40.5 58.5 51.6 30.0 93.5 33.0 83.5 20.0 85.5 64.0 39.0 87.0
Water infiltration rate (%) R1-G1 15.4 12.5 17.0 25.1 17.0 36.8 18.4 6.9 30.9 30.6 91.5 16.0 16.5 29.3 13.2
R1-G4 25.0 29.7 35.0 39.4 34.4 67.8 59.8 18.5 30.2 26.0 25.9 18.2 27.6 41.0 19.8
Average 20.2 21.1 26.0 32.2 25.7 52.3 39.1 12.7 30.6 28.3 58.7 17.1 22.1 35.1 16.5
Amount of infiltrated 32.4 21.9 8.5 13.1 15.0 27.0 11.7 11.8 10.1 23.6 11.7 14.6 14.1 13.7 14.3
water (mm)
Soil water DOC 13.4 8.9 2.2 10.9a 10.9a 8.1 7.5a 7.5a 5.8 6.2a 6.2a 6.9 6.0a 6.0a 7.0
concentration (mg L−1)
Amount of infiltrated 95.6 42.9 4.1 31.2 36.0 47.8 19.4 19.6 12.9 32.0 15.9 22.2 18.6 18.0 22.1
DOC (kg C ha−1)
BGD
6, 10089–10120, 2009
Organic carbon sequestration and
discharge
S. J. Kim et al.
Title Page
Abstract Introduction
Conclusions References
Tables Figures
◭ ◮
◭ ◮
Back Close
Full Screen / Esc
Printer-friendly Version
Interactive Discussion ●
●
SP1
R1
● ●
SP2
R2
MODIS Gr id (7 x 7 km)
Gwangneung Supersite
(a)(b) (c)
BGD
6, 10089–10120, 2009
Organic carbon sequestration and
discharge
S. J. Kim et al.
Title Page
Abstract Introduction
Conclusions References
Tables Figures
◭ ◮
◭ ◮
Back Close
Full Screen / Esc
Printer-friendly Version
Interactive Discussion
BGD
6, 10089–10120, 2009
Organic carbon sequestration and
discharge
S. J. Kim et al.
Title Page
Abstract Introduction
Conclusions References
Tables Figures
◭ ◮
◭ ◮
Back Close
Full Screen / Esc
Printer-friendly Version
Interactive Discussion
BGD
6, 10089–10120, 2009
Organic carbon sequestration and
discharge
S. J. Kim et al.
Title Page
Abstract Introduction
Conclusions References
Tables Figures
◭ ◮
◭ ◮
Back Close
Full Screen / Esc
Printer-friendly Version
Interactive Discussion
BGD
6, 10089–10120, 2009
Organic carbon sequestration and
discharge
S. J. Kim et al.
Title Page
Abstract Introduction
Conclusions References
Tables Figures
◭ ◮
◭ ◮
Back Close
Full Screen / Esc
Printer-friendly Version
Interactive Discussion
BGD
6, 10089–10120, 2009
Organic carbon sequestration and
discharge
S. J. Kim et al.
Title Page Abstract Introduction Conclusions References Tables Figures ◭ ◮ ◭ ◮ Back Close
Full Screen / Esc
Printer-friendly Version
Interactive Discussion
Stream discharge (ton 10min.-1)
0 30 60 90 120 150 180
D O C e ff lu x ( kg h a
-1 10m
in . -1) 0.00 0.01 0.02 0.03
y = 0.0002x - 0.001 r2= 0.80
Stream discharge (ton 10min.-1)
0 30 60 90 120 150 180
P O C e ff lu x ( kg h a
-1 10m
in . -1) 0.00 0.05 0.10 0.15 0.20
y = 0.0006x - 0.012 r2 = 0.69
y = 0.0017x - 0.011 r2 = 0.40
Early events Late events
1/1/05 5/1/05 9/1/05 1/1/06
C ror bon e ff lu x (k g h a
-1 2
h -1) 0.001 0.01 0.1 1 10 DOC POC
(a) (b) (c)
BGD
6, 10089–10120, 2009
Organic carbon sequestration and
discharge
S. J. Kim et al.
Title Page
Abstract Introduction
Conclusions References
Tables Figures
◭ ◮
◭ ◮
Back Close
Full Screen / Esc
Printer-friendly Version
Interactive Discussion
GPP* *
1 0 .2 ~ 1 2 .8 t C h a- 1 yr- 1
N PP* ~ 4 .3 t C h a- 1yr- 1
N EE* * - 2 .4 6 ~ 0 .6 6 t C h a- 1yr- 1
Soil C* ( 0 ~ 0 .3 m ) 9 2 .0 t C h a- 1
D OC in filt r a t ion 0 .4 4 t C h a- 1
( Ju l.- Se p.)
D OC disch a r ge 0 .0 4 t C h a- 1 yr- 1
POC disch a r ge 0 .0 5 t C h a- 1 yr- 1
For e st floor * 5 .6 t C h a- 1
Lit t e r pr odu ct ion * 2 .8 t C h a- 1yr- 1
Soil r e spir a t ion * 2 ~ 6 t C h a- 1 yr- 1
Fig. 7.The contribution of DOC and POC to the carbon budget in the Gwangneung deciduous forest catchment. ∗Lim et al. (2003; observation periods 1998 to 1999),∗∗Kwon et al. (2009;
BGD
6, 10089–10120, 2009
Organic carbon sequestration and
discharge
S. J. Kim et al.
Title Page
Abstract Introduction
Conclusions References
Tables Figures
◭ ◮
◭ ◮
Back Close
Full Screen / Esc
Printer-friendly Version
Interactive Discussion