NHESSD
1, 111–141, 2013Simultaneous occurrence of surge
and discharge extremes
S. F. Kew et al.
Title Page
Abstract Introduction
Conclusions References
Tables Figures
◭ ◮
◭ ◮
Back Close
Full Screen / Esc
Printer-friendly Version Interactive Discussion
Discussion
P
a
per
|
Dis
cussion
P
a
per
|
Discussion
P
a
per
|
Discussio
n
P
a
per
|
Nat. Hazards Earth Syst. Sci. Discuss., 1, 111–141, 2013 www.nat-hazards-earth-syst-sci-discuss.net/1/111/2013/ doi:10.5194/nhessd-1-111-2013
© Author(s) 2013. CC Attribution 3.0 License.
Geoscientific Geoscientific
Geoscientific Geoscientific
Natural Hazards and Earth System Sciences
Open Access
Discussions
This discussion paper is/has been under review for the journal Natural Hazards and Earth System Sciences (NHESS). Please refer to the corresponding final paper in NHESS if available.
The simultaneous occurrence of surge
and discharge extremes for the
Rhine delta
S. F. Kew, F. M. Selten, G. Lenderink, and W. Hazeleger
Royal Netherlands Meteorological Institute, De Bilt, The Netherlands
Received: 8 January 2013 – Accepted: 24 January 2013 – Published: 7 February 2013
Correspondence to: S. F. Kew ([email protected])
NHESSD
1, 111–141, 2013Simultaneous occurrence of surge
and discharge extremes
S. F. Kew et al.
Title Page
Abstract Introduction
Conclusions References
Tables Figures
◭ ◮
◭ ◮
Back Close
Full Screen / Esc
Printer-friendly Version Interactive Discussion
Discussion
P
a
per
|
Dis
cussion
P
a
per
|
Discussion
P
a
per
|
Discussio
n
P
a
per
|
Abstract
The low-lying Netherlands is at risk from multiple threats of sea level rise, storm surges and extreme river discharges. Should these threats occur simultaneously, a catastro-phe will be at hand. Knowledge about the likelihood of simultaneous occurance or the
so-called “compound effect” of such threats is essential to provide guidance on
legisla-5
tion for dike heights, flood barrier design and water management in general.
In this study, we explore the simultaneous threats of North Sea storm surges and extreme Rhine river discharge for the current and future climate in a large 17-member global climate model ensemble. We use a simple approach, taking proxies of North-Northwesterly winds over the North Sea and multiple-day precipitation averaged over
10
the Rhine basin for storm surge and discharge respectively, so that a sensitivity analy-sis is straight forward to apply. By investigating soft extremes, we circumvent the need to extrapolate the data and thereby permit the synoptic development of selected events to be inspected.
Our principle finding is that, for the current climate, the probability of extreme surge
15
conditions following extreme 20-day precipitation sums is around 3 times higher than that estimated from treating extreme surge and discharge probabilities as independent, as previously assumed. For the future climate, the assumption of independence cannot be rejected, at least not for precipitation sums exceeding 7 days.
1 Introduction
20
1.1 Storm surge barrier closure
The low-lying Netherlands is at risk from multiple threats of sea level rise, storm surges and extreme river discharges. The Maeslant storm surge barrier near Hoek van Hol-land, built to protect the densely populated Rotterdam area, closes automatically when the water level is predicted to exceed the current mean sea level by more than 3 m (Van
NHESSD
1, 111–141, 2013Simultaneous occurrence of surge
and discharge extremes
S. F. Kew et al.
Title Page
Abstract Introduction
Conclusions References
Tables Figures
◭ ◮
◭ ◮
Back Close
Full Screen / Esc
Printer-friendly Version Interactive Discussion
Discussion
P
a
per
|
Dis
cussion
P
a
per
|
Discussion
P
a
per
|
Discussio
n
P
a
per
|
den Brink et al., 2005) – the 1/10 yr return level. The water level depends on both sea
conditions (tide and surge) and the Rhine river discharge. The decision of if and when to close the barrier might be complicated in the case of a simultaneous extreme surge and extreme discharge event. In the event of an extreme discharge alone, the barrier should remain open to prevent the damming of excess water. In the event of a joint
5
event, the closed barrier would be at risk of failure due to a reversal of the pressure gradient at the barrier’s base.
1.2 Surge-favourable meteorological situation
The Dutch coast is at risk from storm surges when strong North or Northwesterly winds are present over the North Sea, as these wind directions have the largest fetch. The
10
meteorological situation leading to these conditions and present in the highest ob-served (Van den Brink et al., 2004) and modelled (Van den Brink et al., 2004; Sterl et al., 2009) surges is a large-scale depression centred over or near southern Scan-dinavia. The largest modelled surge was accompanied by 3 hourly winds in excess of
45 kn (23 m s−1) over the North Sea (Sterl et al., 2009).
15
1.3 The independence assumption and reported related research
Often the probabilities of the storm surges and high Rhine discharge are treated in-dependently, assuming that the correlation between them is small, but the issue of independence is still under debate. It received renewed attention after a recent simul-taneous surge and extreme discharge event on 5–6 January 2012. Leading up to this
20
event, a westerly flow regime with an anomalously high NAO index (the 3-month run-ning mean reached the highest since spring 1992), had brought a succession of pre-cipitating systems over the Netherlands. In December 2011, twice the normal monthly precipitation sum was recorded in the North of the Netherlands, and during the first week of January, 50–90 mm fell in 5 days – an event with a 1 in 5 to 1 in 20-yr return
pe-25
NHESSD
1, 111–141, 2013Simultaneous occurrence of surge
and discharge extremes
S. F. Kew et al.
Title Page
Abstract Introduction
Conclusions References
Tables Figures
◭ ◮
◭ ◮
Back Close
Full Screen / Esc
Printer-friendly Version Interactive Discussion
Discussion
P
a
per
|
Dis
cussion
P
a
per
|
Discussion
P
a
per
|
Discussio
n
P
a
per
|
in its wake generated a high North Sea surge. Maeslant barrier closure came into discussion (but was not realised) and the surge prevented sluices in Friesland and Groningen from discharging to the sea for 5 consecutive tidal cycles and 8 in total (K.-J. Van Heeringen, Deltares, personal communication, 2012), creating havoc for the waterboards. The uneasiness generated by the assumption of independence stems
5
not only from the risks implied if it is incorrect, but perhaps also a sense that it is counter-intuitive, as both surges and extreme discharge are frequently associated with present or recently present synoptic low pressure systems. We seek to investigate the independence assumption and present the results in a way that can be related to the intuitive expectation.
10
The recent study by Van den Brink et al. (2005), featuring a short assessment on storm surge barrier closure, finds no apparent positive correlation between the am-plitude of North Sea surges and Rhine discharges. Most barrier-closure conditions in their data were caused by a high surge level and were relatively insensitive to extreme river discharge. They concentrated on 20-day precipitation sums accumulated over the
15
Rhine basin and modelled the discharge at Lobith (a station upstream of the Rhine delta, near the Dutch-German border, Fig. 1) using an empirically tuned simple water balance equation, accounting for large-scale and convective precipitation, evaporation and snow accumulation (Van den Brink et al., 2005, Eq. 4). The high tide surge was calculated following Eq. (1) of Van den Brink et al. (2004) using the 12-h averaged wind
20
speed and direction at a central grid box over the North Sea and the sea level pressure
(SLP) (for the barometric pressure effect) at Hoek van Holland.
Van den Brink et al. (2005) took advantage of the large archive of ECMWF seasonal forecast ensemble runs (1987–2004) to obtain 1570 yr of data, which they regarded as independent due to the ensemble’s low seasonal forecasting skill for the
Nether-25
NHESSD
1, 111–141, 2013Simultaneous occurrence of surge
and discharge extremes
S. F. Kew et al.
Title Page
Abstract Introduction
Conclusions References
Tables Figures
◭ ◮
◭ ◮
Back Close
Full Screen / Esc
Printer-friendly Version Interactive Discussion
Discussion
P
a
per
|
Dis
cussion
P
a
per
|
Discussion
P
a
per
|
Discussio
n
P
a
per
|
admit that the initialisation period 1987–2004 might not be entirely representative of the full range of the present climate’s variability.
Their conclusion that there is no positive correlation between the amplitude of North Sea surges and Rhine discharges is drawn from their Fig. 6b (Van den Brink et al., 2005), which displays a scatter plot of the water level at Hoek van Holland versus the
5
Rhine discharge at Lobith. We note from the same figure, however, that the spread of sea levels does show some dependency on discharge. For example, the lowest sea levels are obtained only when the discharge is also low, and high discharges (limited data) occur only with medium-range sea-levels. The relationship between the extreme discharges and surges could be investigated more thoroughly. An examination of the
10
synoptic situation for the extreme events would also give insight beyond correlation statistics into the physical evolution of the scenario and thus if and how a joint extreme event (simultaneous high discharge and storm surge) might occur.
1.4 Effect of a warming climate
Sterl et al. (2009) conducted a study of extreme North Sea surges by forcing a
15
surge model with meteorological input from ESSENCE, a 17-member ensemble of the ECHAM5/MPI global climate model. They calculated 10 000-yr return surge lev-els and found no statistically significant change for the Dutch coast during the 21st century. Some climate modelling studies suggest there will be an increase in the fre-quency of westerly winds but there is no support for a change towards more Northerly
20
(surge-favouring) winds. The contribution from high river discharge is not taken into account. Multiday precipitation extremes, however, are likely to increase in intensity (winter) (Kew et al., 2011). The combined probability of a storm surge and high dis-charge could therefore also change for a warmer climate. In addition, the number of barrier-closures is expected to increase (exponentially) with sea-level rise and the
du-25
NHESSD
1, 111–141, 2013Simultaneous occurrence of surge
and discharge extremes
S. F. Kew et al.
Title Page
Abstract Introduction
Conclusions References
Tables Figures
◭ ◮
◭ ◮
Back Close
Full Screen / Esc
Printer-friendly Version Interactive Discussion
Discussion
P
a
per
|
Dis
cussion
P
a
per
|
Discussion
P
a
per
|
Discussio
n
P
a
per
|
1.5 Idealised approach
There are multiple factors affecting both discharge and sea level, such as land use and
tides. Rather than using discharge and surge models to encompass all complexities, we instead take a more idealised approach, using simple parameters as proxies for high discharge and storm surge, calculated using a large global climate model ensemble
5
which offers a good representation of natural variability. We study the effect of small
changes to these parameters on the probability of a joint-event in order to gain some understanding of the sensitivity of the results to the choices made.
Our results will offer answers to two basic questions:
1. After extreme precipitation over the Rhine basin, what is the probability distribution
10
of North Sea wind direction and strength compared with climatology? (Sects. 3.1– 3.4.)
2. Is there an enhanced probability of a storm surge after a period of extreme pre-cipitation over the Rhine basin? (Sects. 3.5–3.6.)
After comparing the current climate probabilities with those for future climate
projec-15
tions (Sect. 3.7), we will discuss these results in the light of the study by Van den Brink et al. (2005) (Sect. 4).
2 Methodology
2.1 Data set and study regions
All data used are derived from the ESSENCE data set (Sterl et al., 2008) a
17-20
NHESSD
1, 111–141, 2013Simultaneous occurrence of surge
and discharge extremes
S. F. Kew et al.
Title Page
Abstract Introduction
Conclusions References
Tables Figures
◭ ◮
◭ ◮
Back Close
Full Screen / Esc
Printer-friendly Version Interactive Discussion
Discussion
P
a
per
|
Dis
cussion
P
a
per
|
Discussion
P
a
per
|
Discussio
n
P
a
per
|
(Naki´cenovi´c et al., 2000). The different ensemble members are formed by perturbing
the initial state of the atmosphere, with ocean conditions unchanged.
We make use of the first 30-yr period, 1950–1980, to represent the current climate, and the final 30-yr period, 2070–2100, to represent the future climate. In both cases, we explore the winter season DJF alone. All wind variables are derived from daily
5
averages of 10 m zonal and meridional wind components. Other variables extracted are daily precipitation, and mean sea level pressure.
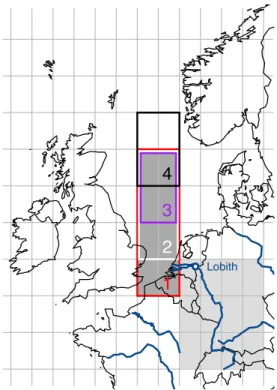
Figure 1 illustrates the regions taken to be relevant for this investigation and the ESSENCE grid. The Rhine basin is represented by a box of 12-grid cells, centred over Germany. Precipitation is averaged over the box with equal weighting for each cell.
10
Wind conditions are assessed within a box over the North Sea with equal weighting for each grid cell. The boundaries of the North Sea box were chosen based on the region of strong winds shown in the synoptic map for the strongest surge in ESSENCE found by Sterl et al. (2009) (their Fig. 2b). The default region is 2-cells wide and 4-cells long. The configuration is varied, as illustrated, as part of a sensitivity study.
15
We assume that the probability of a storm surge is enhanced when the wind is from the NNW direction. For this reason, we calculate the projection of the wind vector onto the NNW axis, as well as the resultant wind strength and direction over the North Sea box.
The NNW axis (unit vector) is denoted sˆ=cosθiˆ+sinθjˆwhere θ=−67.5◦ is the
20
angle measured anticlockwise from the horizontal axis (convention in vector calculus)
andiˆandjˆare unit vectors in the zonal and meridional directions.
The projection,w1, of the wind vector,v =uiˆ+vjˆ, onto the NNW axis,sˆ, is given by
w1=v·sˆ=ucos(67.5
◦
)iˆ−vsin(67.5◦)jˆ.
The magnitude of the wind field is averaged over the North Sea box with equal
25
NHESSD
1, 111–141, 2013Simultaneous occurrence of surge
and discharge extremes
S. F. Kew et al.
Title Page
Abstract Introduction
Conclusions References
Tables Figures
◭ ◮
◭ ◮
Back Close
Full Screen / Esc
Printer-friendly Version Interactive Discussion
Discussion
P
a
per
|
Dis
cussion
P
a
per
|
Discussion
P
a
per
|
Discussio
n
P
a
per
|
The wind direction representative for the North Sea box is given by the unit vector of
the resultant wind vector over theN grid cells, i.e.
ˆ
w=
PN
k=1vˆk
kPNk=1vˆkk
, (1)
where vˆk is the unit vector in the direction of the wind in a single grid cell k. The
compass bearing,φ, (angle from which the wind is coming, measured clockwise from
5
North following nautical convention) is given by the inverse tangent of the ratio of the zonal to meridional component of the resultant wind vector. This can be written as
φ=tan−1
PN
k=1uk/kvkk
PN
k=1vk/kvkk
!
+180◦. (2)
The default lag between the end of then-day precipitation block and the timing of
the wind assessment is set at 0, which is reasonable for multi-day precipitation sums.
10
This is the lag for which correlation between 20-day precipitation sums and stream flow at Lobith is maximised (about 0.75). For 10-day precipitation sums, the correlation is maximised for a lag of 2 days, but is still quite high (about 0.72) for a lag of 0.
2.2 Definitions for extreme discharge and surge conditions
We make the following choices to identify extreme discharges and storm surges in the
15
data set. We assume that a high discharge occurs if the quantileqxr (wherexis fixed at
99 %) ofn-day basin-averaged precipitation sums denoted byrn(wherentakes a value
in the range of 1–20 days), is exceeded. The set ofn-day precipitation sums meeting
the conditionrn> q0.99r is marked with an asterisk,rn∗.
We assume that an imminent storm surge is expected when the North Sea daily
20
average NNW wind component w1 exceeds the distribution’s quantile q
w
x. Here x is
also chosen to be 99 %. The set of wind events meeting the condition w1> q0.99w is
NHESSD
1, 111–141, 2013Simultaneous occurrence of surge
and discharge extremes
S. F. Kew et al.
Title Page
Abstract Introduction
Conclusions References
Tables Figures
◭ ◮
◭ ◮
Back Close
Full Screen / Esc
Printer-friendly Version Interactive Discussion
Discussion
P
a
per
|
Dis
cussion
P
a
per
|
Discussion
P
a
per
|
Discussio
n
P
a
per
|
If extreme discharge events and storm surges occur independently, we can expect
the probability of observing a surgeP(w1∗) to be fixed at 1−x=0.01 regardless of (any
extremes in) the precipitation history, i.e.P(w1∗|rn∗)=P(w1∗)=0.01.
Note that the 99 % quantile is a soft extreme, approximately one event per winter season, equivalent to a return period of 1 yr. We choose soft extremes in order to
5
ensure that a reasonably sized sample of joint events is available in the data set (see next section for the expected sample size). Statistical methods can be used to estimate the return periods of extremes beyond those observed in the data, far into the tails of
the individual event distributions. Modelling extremes of thejoint events would be more
challenging. However, we also wish to examine the synoptic (physical) evolution in the
10
lead up to the extreme joint events, for which we require the events to be observed in the data series, as opposed to being modelled from it. In this study we therefore investigate soft extremes alone.
2.3 Assessing joint-probability and sampling error
For a 30-yr period, a 90-day DJF season and 17 ensemble members, ESSENCE
pro-15
vides 30×90×17=45 900 events. Note that we do not restrict the analysis to
indepen-dent (non-overlapping) events. In total, 459 events will exceed theq0.99r threshold by
construction. If the probability of a storm surge is independent of precipitation history, we can expect on the order of 4–5 joint (high discharge and surge) events to occur by chance. If the events are not independent, we should see a significantly larger number
20
of joint events, or a smaller number in the case of an inhibiting effect. We express the
magnitude of change in the joint probability by a scale factor,S, obtained by
normalis-ing the result by the expected independent probabilityP(w1∗)≡0.01:
Sjoint=
P(w1∗|rn∗)
P(w1∗) . (3)
Naturally there will be some sampling error associated with the number of joint events
25
NHESSD
1, 111–141, 2013Simultaneous occurrence of surge
and discharge extremes
S. F. Kew et al.
Title Page
Abstract Introduction
Conclusions References
Tables Figures
◭ ◮
◭ ◮
Back Close
Full Screen / Esc
Printer-friendly Version Interactive Discussion
Discussion
P
a
per
|
Dis
cussion
P
a
per
|
Discussion
P
a
per
|
Discussio
n
P
a
per
|
estimate of the amplitude of sampling error, we take 1000 random samples of the same size (459) as the precipitation-conditioned sample. From these samples, we obtain a range of PDFs for the wind direction, speed and NNW component. In this case, the
exceedance of the climatologicalq0.99 thresholds is given by
e
Sjoint=
P(w1∗|ren)
P(w1∗) , (4)
5
where the tilde denotes a quantity derived from a random sample.
We present figures for the distribution of exceedances Eq. (4) compared to the precipitation-conditioned sample Eq. (3). We also show the wind PDFs (not restricting to wind extremes) and their anomaly to the climatological PDFs for both the
precipita-tion condiprecipita-tioned sample,P(w1|rn∗), and the random samples,P(w1|ern).
10
2.4 Variable parameters
The number of joint events identified in the data set and, consequently, our estimate of the joint event probability could be sensitive to our choice of parameters defining the surge and discharge proxies. In this document we will look at the sensitivity of the results to the configuration of the North Sea wind assessment box and the precipitation
15
interval,n.
It is also possible in our scheme to set a lag between the wind assessment and the peak of the weighted precipitation maximum (a centre of mass calculation) within a block. In the current study, we simply use the default set-up with zero lag.
There are several other variable parameters which may be varied in the set-up we
20
NHESSD
1, 111–141, 2013Simultaneous occurrence of surge
and discharge extremes
S. F. Kew et al.
Title Page
Abstract Introduction
Conclusions References
Tables Figures
◭ ◮
◭ ◮
Back Close
Full Screen / Esc
Printer-friendly Version Interactive Discussion
Discussion
P
a
per
|
Dis
cussion
P
a
per
|
Discussion
P
a
per
|
Discussio
n
P
a
per
|
3 Results
3.1 Climatology of current North Sea winds
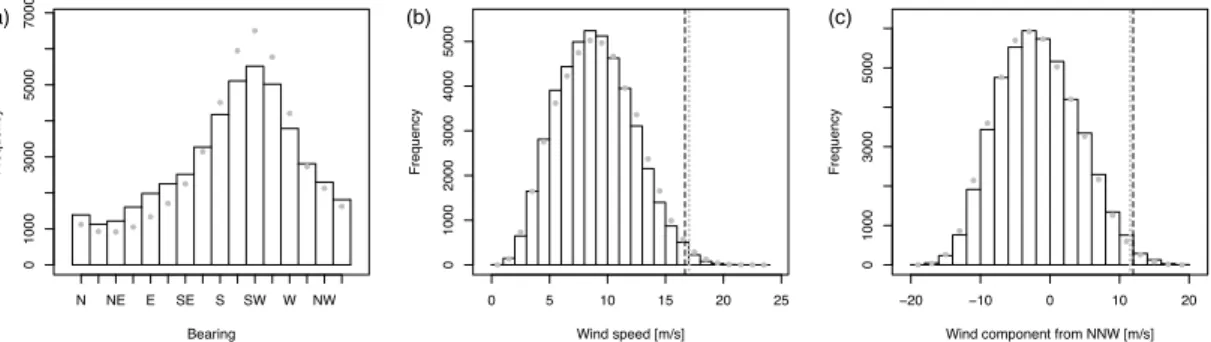
In Fig. 2 the full season DJF wind climatologies (1950–1980) of wind direction (a), wind speed (b) and NNW wind components (c) are presented. Results for the future (2070–2100) are also included in this figure and subsequent figures but these will be
5
commented on in Sect. 3.7. For the current climate, it is seen in Fig. 2a that the most common wind direction is SW, the least common is NNE, and the surge-favourable NNW direction (right-most bin) occurs with just over one third of the peak frequency. The peak frequency in Fig. 2c is for a slightly negative NNW wind component, which is consistent with Fig. 2a as the SW direction vector projects negatively onto the NNW
10
axis. Theq0.99w threshold is 12.0 m s−1in the positive NNW direction. We now examine
how the wind distribution departs from the climatology, after a period of heavy precipi-tation.
3.2 Wind direction conditioned on preceding heavy precipitation
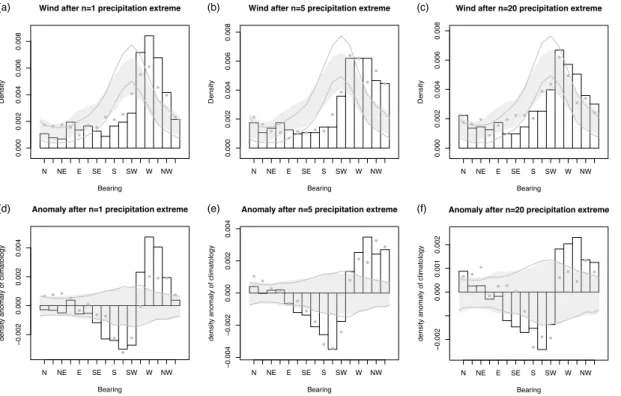
Figure 3 shows the direction of North Sea wind on the day following ann-day period of
15
heavy precipitation over the Rhine basin and the PDF’s anomaly with respect to the full climatology of Fig. 2a. The 95 % range in frequency density obtained from the PDFs of 1000 random samples of the total population (described in Sect. 2.3) is presented as a shaded region to illustrate the magnitude of error due to sample size.
A significant departure from the climatological PDF (climatology effectively
repre-20
sented by the shaded band) is evident. For 1-day precipitation events (left hand col-umn), the peak of the distribution is shifted clockwise with respect to climatology, favouring westerlies, whilst the NNW direction is not favoured more than in the cli-matology. For 2-day extremes (not shown) the peak rotates further towards the North. For 5-day precipitation extremes (middle column), the North-West quarter is favoured
25
NHESSD
1, 111–141, 2013Simultaneous occurrence of surge
and discharge extremes
S. F. Kew et al.
Title Page
Abstract Introduction
Conclusions References
Tables Figures
◭ ◮
◭ ◮
Back Close
Full Screen / Esc
Printer-friendly Version Interactive Discussion
Discussion
P
a
per
|
Dis
cussion
P
a
per
|
Discussion
P
a
per
|
Discussio
n
P
a
per
|
(right hand column), the NNW direction is still favoured more than for the climatology but the distribution of wind directions as a whole is relaxing back towards the climato-logical form.
3.3 Wind speed conditioned on preceding heavy precipitation
Following single-day precipitation extremes, there is also a shift of the wind speed
dis-5
tribution towards higher wind speeds (not shown). The mode, for example, increases
from about 9 m s−1 to 11 m s−1. For largernhowever, the wind speeds are not
signifi-cantly different to the climatological distribution.
The q0.99 exceedance is significant forn=1 (Supplement, Fig. S1a). We can say
that following a 1-day precipitation extreme, the wind speed is nearly 4 times more
10
likely to be extreme than for climatology. For n=5 (Fig. S1b) and n=20 (Fig. S1c),
there is an indication that higher exceedances than normal can be expected, but the departure from climatology is not significant.
3.4 NNW wind component conditioned on preceding heavy precipitation
We now look to see if there is any evidence of an enhanced probability of storm surge
15
wind conditions after a period of extreme precipitation over the Rhine basin. Figure S2 in the Supplement shows the PDFs of the magnitude of the NNW wind component
over the North Sea, following n-day precipitation extremes over the Rhine basin. A
positive shift of the PDF is apparent for alln-day sums considered. The change is also
significant for magnitudes exceedingqw0.99.
20
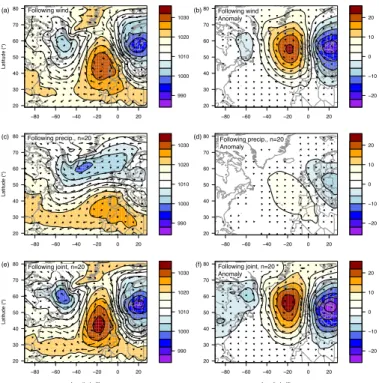
To illustrate the changes to the extreme end of the distribution, we display in Fig. 4
theq0.99w exceedance of the precipitation-conditioned NNW wind components (triangle
marker) as well as the distribution ofq0.99w exceedances obtained from 1000 random
samples of the same size (histogram). The precipitation-conditioned exceedance is
an estimate of the true joint probability, P(w1∗|rn∗) but will be affected by the limited
25
NHESSD
1, 111–141, 2013Simultaneous occurrence of surge
and discharge extremes
S. F. Kew et al.
Title Page
Abstract Introduction
Conclusions References
Tables Figures
◭ ◮
◭ ◮
Back Close
Full Screen / Esc
Printer-friendly Version Interactive Discussion
Discussion
P
a
per
|
Dis
cussion
P
a
per
|
Discussion
P
a
per
|
Discussio
n
P
a
per
|
climatological exceedance, which is 0.01 by construction, with a spread associated with the error due to sample size. When the precipitation-conditioned exceedance lies outside of the 99 % range of random sample exceedances (marked by dashed
verti-cal lines), we assume that the probability of the joint event is significantly different to
climatology.
5
The exceedances of the qw0.99 threshold in Fig. 4 are seen to be significant for all
nconsidered. For example, extreme NNW winds (black triangle) are 3–4 times more
likely than the climatologicalq0.99w exceedance when following 20-day extreme rainfall
events over the Rhine basin (Fig. 4c).
3.5 Sensitivity to the assessment location for wind conditions
10
Figure 5a shows the impact on the estimated scaled joint probability,Sjoint (Eq. 1), of
changing the size and position of the North Sea box (see Fig. 1 for configurations) used to assess the NNW wind component. The joint probabilities are raised up to a factor of 5 above the unconditional probability of a surge, following a 2-day precipitation extreme.
For a 10-day precipitation extreme, Sjoint ranges from about 2 to 4.3, depending on
15
the region used for wind assessment. For a 20-day precipitation extreme,Sjointranges
between about 1.3 to 3.3. Box 1 and Box 2 give similar results for all n-day sums,
and indicate larger joint probabilities at large n than the other boxes. Box 1 and 2
are more elongated than Box 3 and 4. The fact that we look for extreme winds in a direction nearly parallel to the longest side of the box, may cause events featuring larger
20
synoptic systems to be preferentially selected by the elongated boxes. Larger spatial and temporal correlations might then be expected, favouring larger joint probabilities of events over the Rhine Basin and the North Sea.
Van den Brink et al. (2004) use model wind data from a single location over the North Sea to model surges. The location corresponds closest to the North-East most cell of
25
NHESSD
1, 111–141, 2013Simultaneous occurrence of surge
and discharge extremes
S. F. Kew et al.
Title Page
Abstract Introduction
Conclusions References
Tables Figures
◭ ◮
◭ ◮
Back Close
Full Screen / Esc
Printer-friendly Version Interactive Discussion
Discussion
P
a
per
|
Dis
cussion
P
a
per
|
Discussion
P
a
per
|
Discussio
n
P
a
per
|
That the largest joint probabilities attained for all boxes are found following 2-day precipitation events probably signifies that the same synoptic system is responsible for heavy rain and the subsequent surge created by the increase in Northerly winds as the system passes (Fig. 5a). A second peak in joint probability occurs at 10 days for Box 1, 2 and 3. The precipitation is likely to have been generated from more than one synoptic
5
system – the first of which does not necessarily contribute to the surge conditions, as 10 days is an adequate length of time for the full passage of at least 2 depressions. In the next section, the evolution of the systems involved is clarified further.
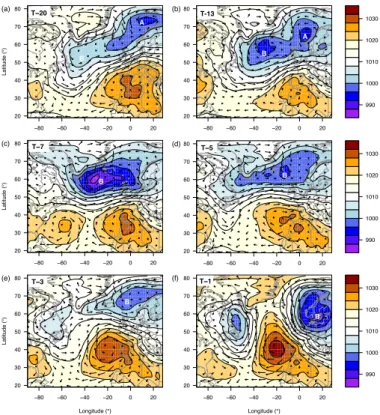
3.6 SLP composites
In Fig. 6 we present the full SLP climatology for the DJF season for ESSENCE (Fig. 6a)
10
alongside similar results from ERA-Interim for reference (Fig. 6b). Both show a region of low pressure extending across the Atlantic between Greenland and the UK – the storm track.
SLP composites and their anomalies of days satisfying the wind and precipitation criteria are shown in Fig. 7. The composite of days satisfying the NNW extreme wind
15
condition (a) shows a low pressure centre over Southern Scandinavia and a ridge North of the Azores and another low between Greenland and Newfoundland. Depicted as an anomaly with respect to the total climatology (b), the composite reveals an East-West SLP dipole centred over the North Sea. The location of the SLP minimum is in good agreement with the surge-favourable conditions reported in the literature.
20
Figure 7c–d shows the SLP composite and anomaly for days satisfying the pre-cipitation criterion for 20-day prepre-cipitation sums. Similar figures for 1-day and 10-day sums are found in the Supplement, Fig. S3a–d. For the 1-day event, the dominant feature is a negative SLP anomaly centred over Denmark. For the multi-day sums, a weaker negative SLP anomaly is featured but is positioned further to the south east,
25
as well as a positive anomaly to the west of France. Note that the reference date used
for these composites is the last date in then-day period, meaning that the rainfall has
NHESSD
1, 111–141, 2013Simultaneous occurrence of surge
and discharge extremes
S. F. Kew et al.
Title Page
Abstract Introduction
Conclusions References
Tables Figures
◭ ◮
◭ ◮
Back Close
Full Screen / Esc
Printer-friendly Version Interactive Discussion
Discussion
P
a
per
|
Dis
cussion
P
a
per
|
Discussion
P
a
per
|
Discussio
n
P
a
per
|
summation periods shown, the SLP anomaly configuration favours Northerly or North-westerly wind flow over the North Sea.
Figure 7e–f displays the SLP composite and anomaly satisfying both the surge and 20-day precipitation criteria. Similar figures for the joint condition for 1-day and 10-day precipitation sums are found in the Supplement, Fig. S4. The anomaly dipole structures
5
are heavily influenced by the requirement to fulfill the NNW wind criterion. The dipole pattern is similar to that for the composite of days satisfying the wind conditions alone (Fig. 7b) but the amplitude is stronger. There is much more ridging evident over the Atlantic, compared to the composites conditioned on precipitation only (Fig. 7c).
Figure 8 shows the composite for the joint event forn=20 as a temporal sequence
10
from 1 day before the reference date to 20 days before the reference date. Over this period, two synoptic regions of low pressure pass central Europe in the composite (see labels A and B in Fig. 8). In the Supplement, a single event contributing to this composite is singled out for comparison (Fig. S5). There are approximately 6 synoptic low pressure systems (labels A to F) and their troughs that contribute to precipitation
15
over the Rhine basin. Clearly a succession of low pressure systems contribute to the precipitation maximum. A notable feature is the strong ridging over the east Atlantic that causes low F to move south over Europe and brings Northerly winds over the UK and the North Sea. This feature – the rotation of a synoptic region of low pressure about a strong ridge, is also present in the composite (Fig. 8).
20
3.7 Joint events in a future climate
The same analysis has been carried out for the future years 2070–2100, using Box 1 to assess the North Sea wind conditions.
The DJF climatology (Fig. 2, grey dots) shows some small changes compared to the current period. The PDF of bearings becomes more peaked, still with a maximum
25
NHESSD
1, 111–141, 2013Simultaneous occurrence of surge
and discharge extremes
S. F. Kew et al.
Title Page
Abstract Introduction
Conclusions References
Tables Figures
◭ ◮
◭ ◮
Back Close
Full Screen / Esc
Printer-friendly Version Interactive Discussion
Discussion
P
a
per
|
Dis
cussion
P
a
per
|
Discussion
P
a
per
|
Discussio
n
P
a
per
|
by a small amount (from 12.0 to 11.8 m s−1). This suggests there will not be a great
deal of change in surge conditions, and if anything, the probability of extreme surges would be reduced.
Following 1-day precipitation extremes, the frequency of wind from the W to NW directions, is less pronounced in the future (Fig. 3a and d, grey dots). However the
5
frequency of winds from the NNW direction remains about the same. Following 5-day precipitation extremes, the current and future wind distributions are very similar (Fig. 3b and e, compare grey dots to histogram) despite the PDF of the total wind climatology becoming more peaked (Fig. 3b, grey lines). Following 20-day precipitation extremes, the future wind distribution is closer to the full climatology than for the current climate
10
(Fig. 3c and f).
Regarding the NNW wind component after a precipitation extreme, a shift away from climatology towards more positive values is still evident in the future PDF (Supplement, Fig. S2, grey dots). The departure from climatology is generally less than for the
cur-rent climate forn=1 andn=20. For n=5, the current and future wind samples are
15
very similar. Forn=20 the joint event probability is, by contrast to the current climate,
not significant (see exceedance of qw0.99 in Fig. 4c) and in the particular sample our
dataset produces, is less (but not significantly less) than the climatological probability.
If we use the current climate quantile definition of an=20 precipitation extreme, the
joint event probability is still insignificant (Sjoint∼0.014, not shown). Following a shorter
20
precipitation extreme ofn=5, the chance of a surge is similar to the current climate,
i.e. raised about 4 times above the independent probability.
4 Summary and discussion
After extreme rain over the Rhine basin, we find that the probability distribution of North Sea wind strength and direction shows significant departures from the 1950–1980
cli-25
NHESSD
1, 111–141, 2013Simultaneous occurrence of surge
and discharge extremes
S. F. Kew et al.
Title Page
Abstract Introduction
Conclusions References
Tables Figures
◭ ◮
◭ ◮
Back Close
Full Screen / Esc
Printer-friendly Version Interactive Discussion
Discussion
P
a
per
|
Dis
cussion
P
a
per
|
Discussion
P
a
per
|
Discussio
n
P
a
per
|
both single and multi-day precipitation events, whilst the climatological mode direction, SW, is less favoured.
Sampled over all directions, wind speeds are significantly larger than climatology only when following extreme precipitation events of short duration. The magnitude of the wind projected in the NNW direction, however, increases over climatological values
5
also for multiday events, including extremes (w1> q
w
0.99). The exceedance of theq
w
0.99
threshold was shown to be outside of the range that can be expected from sampling error. These changes therefore suggest that the probability of a surge conditioned on preceding heavy precipitation is indeed larger than when independence is assumed.
The probability of a NNW wind extreme conditioned on a preceding 20-day rain
ex-10
treme (as seen in Fig. 5) is over 3 times greater than for the unconditioned case (using Box 1 of Fig. 1 for the wind conditions). Although this increase is significant, it is still quite small – approximately 97 % of surge conditions occur without a preceding 20-day precipitation extreme. Figure 9 illustrates the results schematically with Venn diagrams.
The area of overlap between the setw1∗ of wind extremes and the setr20∗ of
precipita-15
tion extremes increases more than 3-fold between panel a and b, but the joint events are still a tiny fraction of the two individual sets.
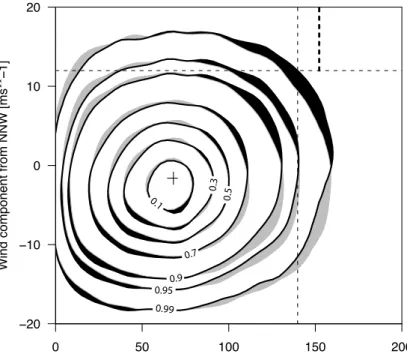
To place these results in context with those of Van den Brink et al. (2005), we pro-duced our own version (Fig. 10) of their Fig. 6b. We plot 20-day precipitation sums instead of Rhine discharge, and North Sea NNW wind component instead of the Sea
20
Level at Hoek van Holland and, for clarity, display density contours rather than a scatter plot. Just as for Fig. 6b of Van den Brink et al. (2005), there is no correlation to be seen between the two variables (black contours, Fig. 10).
In addition, we simulated a distribution for which we know that the wind and precipita-tion variables are independent (grey contours). It is made by replacing the actual wind
25
NHESSD
1, 111–141, 2013Simultaneous occurrence of surge
and discharge extremes
S. F. Kew et al.
Title Page
Abstract Introduction
Conclusions References
Tables Figures
◭ ◮
◭ ◮
Back Close
Full Screen / Esc
Printer-friendly Version Interactive Discussion
Discussion
P
a
per
|
Dis
cussion
P
a
per
|
Discussion
P
a
per
|
Discussio
n
P
a
per
|
density is larger (smaller) than that of the independent probability distribution for a given NNW wind component. Although we have only investigated soft extremes, it is evident that the departures from the independent distribution are greatest in the top right hand segment of the figure, i.e. in the tail of the joint distribution. The shift of the PDF for the conditioned samples with respect to the climatology (Supplement, Fig. S2c)
5
can also be gleaned from this figure, by noting the pattern of grey and black areas in
the regions exceeding theq0.99 thresholds (dashed lines).
Inspection of the SLP composites satisfying the joint conditions for wind and rain ex-tremes shows an intuitive sequence where, for a 20-day extreme precipitation sum, rain is accumulated from at least 2 synoptic systems and the North Sea surge conditions
10
are generated at the rear of the final system as it passes across southern Scandinavia. Projections for the future (2070–2100) suggest that surges following multiple day pre-cipitation extremes will be less likely than at present. The assumption of independence between extreme surge and discharge events was found to valid for the longer multiple
day precipitation sums (n=20) in the ESSENCE data set. It is known that DJF westerly
15
wind components increase in the ESSENCE data set (ECHAM5/MPI-OM) with climate change (Van Ulden and van Oldenborgh, 2006) but that there is insignificant change to the Northerly wind component and the likelihood of storm surges (Sterl et al., 2009). The increased frequency of westerlies appears to negatively impact the probability of
an extremejoint surge-discharge event, when the discharge extreme results from
mul-20
tiple days of precipitation. In multiple-day extremes, the precipitation generally results from the passage of several systems, and the discharge and surge events may be decoupled (not from the same system). The chance that the days subsequent to a pre-cipitation extreme will bring westerlies rather than surge-favourable winds is enhanced in the future climate.
25
NHESSD
1, 111–141, 2013Simultaneous occurrence of surge
and discharge extremes
S. F. Kew et al.
Title Page
Abstract Introduction
Conclusions References
Tables Figures
◭ ◮
◭ ◮
Back Close
Full Screen / Esc
Printer-friendly Version Interactive Discussion
Discussion
P
a
per
|
Dis
cussion
P
a
per
|
Discussion
P
a
per
|
Discussio
n
P
a
per
|
the precipitation reference date and the wind assessment, position of reference date in precipitation block, start date and number of years included in the climatology, season, axis of projection for winds, duration of wind condition, quantiles defining the extreme events.
Whilst this simple set up is useful for preliminary investigations, there are several
im-5
portant factors which introduce further uncertainty and should be taken into account in a more thorough investigation using sophisticated surge and discharge models. These are, for example, the contribution to discharge of rapid snow melt, the possibility of dam breeches upstream, the river basin configuration and tides. Changes to the joint probability of extreme surge and discharge events in the future are likely from sea-level
10
rise, increases in storm frequency or intensity, and earlier and potentially more rapid snow melt.
We particularly recommend a comparison of the present results for the current cli-mate with the output of coupled surge-discharge models when driven by the same global ensemble (containing the same synoptic systems).
15
A major question remaining is how these results extend to more extreme events with multiple-year return periods.
Supplementary material related to this article is available online at: http://www.nat-hazards-earth-syst-sci-discuss.net/1/111/2013/ nhessd-1-111-2013-supplement.pdf.
20
Acknowledgements. This study is part of the project Future Weather and was carried out
in the framework of the Dutch National Research Programme Knowledge for Climate (www. knowledgeforclimate.org). This research programme is co-financed by the Ministry of Infrastruc-ture and the Environment. The results of the project contribute towards the European project ECLISE (Enabling Climate Information Services for Europe).
25
NHESSD
1, 111–141, 2013Simultaneous occurrence of surge
and discharge extremes
S. F. Kew et al.
Title Page
Abstract Introduction
Conclusions References
Tables Figures
◭ ◮
◭ ◮
Back Close
Full Screen / Esc
Printer-friendly Version Interactive Discussion
Discussion
P
a
per
|
Dis
cussion
P
a
per
|
Discussion
P
a
per
|
Discussio
n
P
a
per
|
References
Katsman, C. A., Sterl, A., Beersma, J. J., van den Brink, H. W., Church, J. A., Hazeleger, W., Kopp, R. E., Kroon, D., Kwadijk, J., Lammersen, R., Lowe, J., Oppenheimer, M., Plag, H. P., Ridley, J., von Storch, H., Vaughan, D. G., Vellinga, P., Vermeersen, L. L. A., van de Wal, R. S. W., and Weisse, R.: Exploring high-end scenarios for local sea level rise to develop flood
5
protection strategies for a low-lying delta – the Netherlands as an example, Climatic Change, 109, 617–645, doi:10.1007/s10584-011-0037-5, 2011. 115
Kew, S. F., Selten, F. M., Lenderink, G., and Hazeleger, W.: Robust assessment of future changes in extreme precipitation over the Rhine basin using a GCM, Hydrol. Earth Syst. Sci., 15, 1157–1166, doi:10.5194/hess-15-1157-2011, 2011. 115
10
Naki´cenovi´c, N., Alcamo, J., Davis, G., de Vries, B., Fenhann, J., Gaffin, S., Gregory, K.,
Grubler, A., Jung, T. Y., Kram, T., La Rovere, E. L., Michaelis, L., Mori, S., Morita, T., Pepper, W., Pitcher, H. M., Price, L., Riahi, K., Roehrl, A., Rogner, H.-H., Sankovski, A., Schlesinger, M., Shukla, P., Smith, S. J., Swart, R., van Rooijen, S., Victor, N., and Dadi, Z.: Special Re-port on Emissions Scenarios: A Special ReRe-port of Working Group III of the Intergovernmental
15
Panel on Climate Change, 599 pp., Cambridge Univ. Press, Cambridge, UK, 2000. 117 Sterl, A., Severijns, C., Dijkstra, H., Hazeleger, W., van Oldenborgh, G. J., van den Broeke,
M., Burgers, G., van den Hurk, B., van Leeuwen, P. J., and van Velthoven, P.: When can we expect extremely high surface temperatures? Geophys. Res. Lett., 35, L14703, doi:10.1029/2008GL034071, 2008. 116
20
Sterl, A., van den Brink, H., de Vries, H., Haarsma, R., and van Meijgaard, E.: An ensemble study of extreme storm surge related water levels in the North Sea in a changing climate, Ocean Sci., 5, 369–378, doi:10.5194/os-5-369-2009, 2009. 113, 115, 117, 128
Van den Brink, H. W., K ¨onnen, G. P., Opsteegh, J. D., van Oldenborgh, G. J., and Burgers,
G.: Improving 104-year surge level estimates using data of the ECMWF seasonal prediction
25
system, Geophys. Res. Lett., 31, L17210, doi:10.1029/2004GL020610, 2004. 113, 114, 123 Van den Brink, H. W., K ¨onnen, G. P., Opsteegh, J. D., van Oldenborgh, G. J., and Burgers, G.: Estimating return periods of extreme events from ECMWF seasonal forecast ensembles, Int. J. Climatol., 25, 1345–1354, 2005. 112, 114, 115, 116, 127
Van der Made, J. W.: Design levels in the transition zone between the tidal reach and the river
30
NHESSD
1, 111–141, 2013Simultaneous occurrence of surge
and discharge extremes
S. F. Kew et al.
Title Page
Abstract Introduction
Conclusions References
Tables Figures
◭ ◮
◭ ◮
Back Close
Full Screen / Esc
Printer-friendly Version Interactive Discussion
Discussion
P
a
per
|
Dis
cussion
P
a
per
|
Discussion
P
a
per
|
Discussio
n
P
a
per
|
ԂԂ Lobith
1 2 3
4
NHESSD
1, 111–141, 2013Simultaneous occurrence of surge
and discharge extremes
S. F. Kew et al.
Title Page Abstract Introduction Conclusions References Tables Figures ◭ ◮ ◭ ◮ Back Close
Full Screen / Esc
Printer-friendly Version Interactive Discussion Discussion P a per | Dis cussion P a per | Discussion P a per | Discussio n P a per |
N NE E SE S SW W NW
0 1000 3000 5000 7000 Ԃ Ԃ Ԃ Ԃ Ԃ Ԃ Ԃ Ԃ Ԃ Ԃ Ԃ Ԃ Ԃ Ԃ Ԃ Ԃ Bearing Frequency (a)
0 5 10 15 20 25
0 1000 2000 3000 4000 5000 Ԃ Ԃ Ԃ Ԃ Ԃ Ԃ Ԃ Ԃ ԂԂ Ԃ Ԃ Ԃ Ԃ Ԃ Ԃ Ԃ Ԃ ԂԂԂԂԂԂ
Wind speed [m/s]
Frequency
(b)
−20 −10 0 10 20
0 1000 3000 5000 ԂԂ Ԃ Ԃ Ԃ Ԃ Ԃ Ԃ Ԃ Ԃ Ԃ Ԃ Ԃ Ԃ Ԃ Ԃ Ԃ
ԂԂԂ
Wind component from NNW [m/s]
Frequency
(c)
Fig. 2.DJF Climatologies of wind directions(a), wind speed(b)and NNW wind component(c)
averaged over the North Sea box (shaded dark grey in Fig. 1). Bars show the distribution for the current climate (1950–1980) and dots for the future (2070–2100). The dashed vertical lines
in(b) and(c) mark the location of the 99 % quantiles of the current (black) and future (grey)
NHESSD
1, 111–141, 2013Simultaneous occurrence of surge
and discharge extremes
S. F. Kew et al.
Title Page Abstract Introduction Conclusions References Tables Figures ◭ ◮ ◭ ◮ Back Close
Full Screen / Esc
Printer-friendly Version Interactive Discussion Discussion P a per | Dis cussion P a per | Discussion P a per | Discussio n P a per | Density
Wind after n=5 precipitation extreme
Bearing
N NE E SE S SW W NW
0.000 0.002 0.004 0.006 0.008 Ԃ Ԃ Ԃ Ԃ Ԃ Ԃ Ԃ Ԃ Ԃ Ԃ Ԃ Ԃ Ԃ Ԃ Ԃ Ԃ
N NE E SE S SW W NW
−0.004 −0.002 0.000 0.002 0.004 Bearing
density anomaly of climatology
Ԃ Ԃ Ԃ Ԃ Ԃ Ԃ Ԃ Ԃ Ԃ Ԃ Ԃ Ԃ Ԃ Ԃ Ԃ Ԃ Anomaly after n=5 precipitation extreme
Density
Wind after n=1 precipitation extreme
Bearing
N NE E SE S SW W NW
0.000
0.002
0.004
0.006
0.008
Ԃ Ԃ Ԃ Ԃ Ԃ Ԃ Ԃ Ԃ Ԃ Ԃ Ԃ Ԃ Ԃ Ԃ Ԃ Ԃ
N NE E SE S SW W NW
−0.002
0.000
0.002
0.004
Bearing
density anomaly of climatology
Ԃ Ԃ Ԃ Ԃ Ԃ Ԃ Ԃ Ԃ Ԃ Ԃ Ԃ Ԃ Ԃ Ԃ Ԃ Ԃ Anomaly after n=1 precipitation extreme
Density
Wind after n=20 precipitation extreme
Bearing
N NE E SE S SW W NW
0.000 0.002 0.004 0.006 0.008 Ԃ Ԃ Ԃ Ԃ Ԃ Ԃ Ԃ Ԃ Ԃ Ԃ Ԃ Ԃ Ԃ Ԃ Ԃ Ԃ
N NE E SE S SW W NW
−0.002
0.000
0.001
0.002
Bearing
density anomaly of climatology
Ԃ Ԃ Ԃ Ԃ Ԃ Ԃ Ԃ Ԃ Ԃ Ԃ Ԃ Ԃ Ԃ Ԃ Ԃ Ԃ Anomaly after n=20 precipitation extreme (a) (d) (b) (e) (c) (f)
Fig. 3.Wind directions following extreme (bars for current climate, dots for future) and random
samples (95 % density range, shaded for current climate, outlined for future) ofn-day
NHESSD
1, 111–141, 2013Simultaneous occurrence of surge
and discharge extremes
S. F. Kew et al.
Title Page
Abstract Introduction
Conclusions References
Tables Figures
◭ ◮
◭ ◮
Back Close
Full Screen / Esc
Printer-friendly Version Interactive Discussion
Discussion
P
a
per
|
Dis
cussion
P
a
per
|
Discussion
P
a
per
|
Discussio
n
P
a
per
|
0.000 0.010 0.020 0.030
0
50
100
150
200
Ԃ Ԃ
Ԃ Ԃ
Ԃ
Ԃ
Ԃ
Ԃ
Ԃ Ԃ
Ԃ Ԃ
Ԃ Ԃ
After n=20 precipitation extreme
NNW component exceedance of q99
Frequency
0.00 0.01 0.02 0.03 0.04
0
50
100
150
200
Ԃ Ԃ
Ԃ Ԃ
Ԃ Ԃ
Ԃ
Ԃ
Ԃ Ԃ
Ԃ ԂԂԂԂ
After n=5 precipitation extreme
NNW component exceedance of q99
Frequency
0.000 0.005 0.010 0.015 0.020 0.025 0.030
0
50
100
150
200
Ԃ Ԃ
Ԃ Ԃ
Ԃ
Ԃ
Ԃ
Ԃ
Ԃ
Ԃ Ԃ
Ԃ Ԃ Ԃ Ԃ
After n=1 precipitation extreme
NNW component exceedance of q99
Frequency
(c) (b)
(a)
Fig. 4.Exceedance of the 1950–1980 climatological q0.99w for the NNW wind component
fol-lowing extremen-day precipitation sums (black triangle for current climate, grey for future) and
NHESSD
1, 111–141, 2013Simultaneous occurrence of surge
and discharge extremes
S. F. Kew et al.
Title Page
Abstract Introduction
Conclusions References
Tables Figures
◭ ◮
◭ ◮
Back Close
Full Screen / Esc
Printer-friendly Version Interactive Discussion
Discussion
P
a
per
|
Dis
cussion
P
a
per
|
Discussion
P
a
per
|
Discussio
n
P
a
per
|
box1 box2 box3 box4
5 10 15 20
0
1
2
3
4
5
6
summation interval, n [days]
Normalised joint probability,
S
joint Probability when independent
Fig. 5.Summary of effect of changing North Sea box dimensions on the normalised joint
prob-abilitySjoint (exceedances of the climatologicalq0.99w ) for NNW wind component (1950–1980).
NHESSD
1, 111–141, 2013Simultaneous occurrence of surge
and discharge extremes
S. F. Kew et al.
Title Page
Abstract Introduction
Conclusions References
Tables Figures
◭ ◮
◭ ◮
Back Close
Full Screen / Esc
Printer-friendly Version Interactive Discussion
Discussion
P
a
per
|
Dis
cussion
P
a
per
|
Discussion
P
a
per
|
Discussio
n
P
a
per
|
990 1000 1010 1020 1030
−80 −60 −40 −20 0 20
20 30
40
50
60
70
80
Longitude (°)
Latitude (°)
990 1000 1010 1020 1030
−80 −60 −40 −20 0 20
20 30
40
50
60
70
80
Longitude (°)
(a) (b)
Fig. 6. (a)ESSENCE SLP climatology in hPa (45 900 entries) for DJF 1950–1980,(b)
NHESSD
1, 111–141, 2013Simultaneous occurrence of surge
and discharge extremes
S. F. Kew et al.
Title Page Abstract Introduction Conclusions References Tables Figures ◭ ◮ ◭ ◮ Back Close
Full Screen / Esc
Printer-friendly Version Interactive Discussion Discussion P a per | Dis cussion P a per | Discussion P a per | Discussio n P a per | 990 1000 1010 1020 1030
−80 −60 −40 −20 0 20 20 30 40 50 60 70 80 Latitude (°)
Following precip., n=20
−20 −10
0 10 20
−80 −60 −40 −20 0 20 20 30 40 50 60 70
80 Following precip., n=20
Anomaly 990 1000 1010 1020 1030
−80 −60 −40 −20 0 20 20 30 40 50 60 70 80 Latitude (°) Following wind −20 −10 0 10 20
−80 −60 −40 −20 0 20 20 30 40 50 60 70
80 Following wind Anomaly 990 1000 1010 1020 1030
−80 −60 −40 −20 0 20 20 30 40 50 60 70 80 Longitude (°) Latitude (°)
Following joint, n=20
−20 −10
0 10 20
−80 −60 −40 −20 0 20 20 30 40 50 60 70
80 Following joint, n=20
Anomaly
Longitude (°)
(a) (b)
(c) (d)
(e) (f)
Fig. 7. (a)Composite satisfying North Sea wind criteria (459 entries) and its anomaly(b)with
respect to full climatology (Fig. 6a).(c)Composite satisfying 20-day precipitation criteria (459
entries), for which the precipitation has fallen over the 20-days preceding the synoptic situation
shown, and its anomaly(d)with respect to the full climatology in Fig. 6a.(e)Composite jointly
satisfying the wind and 20-day sum precipitation criteria (15 events) and its anomaly(f) with
NHESSD
1, 111–141, 2013Simultaneous occurrence of surge
and discharge extremes
S. F. Kew et al.
Title Page Abstract Introduction Conclusions References Tables Figures ◭ ◮ ◭ ◮ Back Close
Full Screen / Esc
Printer-friendly Version Interactive Discussion Discussion P a per | Dis cussion P a per | Discussion P a per | Discussio n P a per |
−80 −60 −40 −20 0 20 20 30 40 50 60 70 80 Latitude (°) T−7 B 990 1000 1010 1020 1030
−80 −60 −40 −20 0 20 20 30 40 50 60 70 80 T−5 B −80 −60 −40 −20 0 20
20 30 40 50 60 70 80 Latitude (°) T−20 B A 990 1000 1010 1020 1030
−80 −60 −40 −20 0 20 20 30 40 50 60 70 80 T-13 B A
−80 −60 −40 −20 0 20 20 30 40 50 60 70 80 Longitude (°) Latitude (°) T−3 B 990 1000 1010 1020 1030
−80 −60 −40 −20 0 20 20 30 40 50 60 70 80 Longitude (°) T−1 B (a) (b) (d) (c) (e) (f)
Fig. 8.Evolution of the SLP composite satisfying the joint extreme conditions (n=20 for
NHESSD
1, 111–141, 2013Simultaneous occurrence of surge
and discharge extremes
S. F. Kew et al.
Title Page
Abstract Introduction
Conclusions References
Tables Figures
◭ ◮
◭ ◮
Back Close
Full Screen / Esc
Printer-friendly Version Interactive Discussion
Discussion
P
a
per
|
Dis
cussion
P
a
per
|
Discussion
P
a
per
|
Discussio
n
P
a
per
|
(a)
r*20
all
not to scale w1*
(b)
not to scale r*20
all w*1
Fig. 9.Venn diagrams showing schematically the set of wind extremes (w1∗, yellow) and 20-day
precipitation extremes (r20∗ , blue) as subsets of the total data available (grey) and their overlap
(green). By construction, both thew1∗andr20∗ subsets are 1% of all days. If the wind extremes
are independent of the precipitation extremes, the probability of the joint event (green overlap) is
P(w1∗)P(r20∗ )=0.01 % of the total number of days, or equivalently, 1 % of wind extremes occur
by chance within the subset of precipitation extremes(a). However, ESSENCE data shows
the percentage of joint events (green overlap) to be 2–4 times larger(b), considering 20-day
precipitation events. There are still however a large proportion of wind extremes (b, yellow) that
NHESSD
1, 111–141, 2013Simultaneous occurrence of surge
and discharge extremes
S. F. Kew et al.
Title Page
Abstract Introduction
Conclusions References
Tables Figures
◭ ◮
◭ ◮
Back Close
Full Screen / Esc
Printer-friendly Version Interactive Discussion
Discussion
P
a
per
|
Dis
cussion
P
a
per
|
Discussion
P
a
per
|
Discussio
n
P
a
per
|
0 50 100 150 200
−20 −10 0 10 20
Rhine basin 20−day precipitation sum [mm]
Wind component from NNW [ms**−1]
0.1
0.3 0.5
0.7
0.9
0.95
0.99
Fig. 10.Data density (kernel density estimation) for Rhine basin 20-day precipitation sums (DJF, 1950–1980) against the North Sea NNW wind component evaluated on the last of the 20-days. Labels indicate the proportion of the data cloud enclosed by the contours. Black contours are for the pure results from the ESSENCE data set. Grey contours show how the distribution would look if the two variables were independent. Black (grey) shading is used where the true distribution’s frequency density exceeds (undercuts) that of the independent distribution for the same NNW wind speed. Thin dashed lines show the 99 % quantiles for each variable estimated from the pure data. The thick dashed line shows the 99% precipitation quantile of the sub group