CPD
10, 3931–3964, 2014Northern Hemisphere control of deglacial vegetation changes in the Rufiji uplands
(Tanzania)
I. Bouimetarhan et al.
Title Page
Abstract Introduction
Conclusions References
Tables Figures
◭ ◮
◭ ◮
Back Close
Full Screen / Esc
Printer-friendly Version
Interactive Discussion
Discussion
P
a
per
|
Discus
sion
P
a
per
|
Discussion
P
a
per
|
Discussion
P
a
per
|
Clim. Past Discuss., 10, 3931–3964, 2014 www.clim-past-discuss.net/10/3931/2014/ doi:10.5194/cpd-10-3931-2014
© Author(s) 2014. CC Attribution 3.0 License.
This discussion paper is/has been under review for the journal Climate of the Past (CP). Please refer to the corresponding final paper in CP if available.
Northern Hemisphere control of deglacial
vegetation changes in the Rufiji uplands
(Tanzania)
I. Bouimetarhan, L. Dupont, H. Kuhlmann, J. Pätzold, M. Prange, E. Schefuß, and K. Zonneveld
MARUM – Center for Marine Environmental Sciences and Department of Geosciences, University of Bremen, P.O. Box 330 440, 28334, Bremen, Germany
Received: 19 August 2014 – Accepted: 11 September 2014 – Published: 30 September 2014
Correspondence to: I. Bouimetarhan ([email protected])
CPD
10, 3931–3964, 2014Northern Hemisphere control of deglacial vegetation changes in the Rufiji uplands
(Tanzania)
I. Bouimetarhan et al.
Title Page
Abstract Introduction
Conclusions References
Tables Figures
◭ ◮
◭ ◮
Back Close
Full Screen / Esc
Printer-friendly Version
Interactive Discussion
Discussion
P
a
per
|
Discus
sion
P
a
per
|
Discussion
P
a
per
|
Discussion
P
a
per
|
Abstract
In tropical Eastern Africa, vegetation distribution is largely controlled by regional hydrol-ogy which has varied over the past 20 000 years. Therefore, accurate reconstructions of past vegetation and hydrological changes are crucial to better understand climate variability in the tropical Eastern African region. Through high-resolution pollen records
5
from a marine sediment core recovered offshore the Rufiji River, our data show sig-nificant shifts in pollen assemblages during the last deglaciation identifying, through respective changes in both upland and lowland vegetation, specific responses of plant communities to atmospheric (precipitation) and coastal (coastal dynamics/sea level changes) alterations. Specifically, an interval of maximum pollen representation of dry
10
and open vegetation occurred during the Northern Hemisphere cold Heinrich event 1 (H1) suggesting the expansion of drier upland vegetation under arid conditions. This dry spell is followed by an interval in which forest and humid woodland expanded, in-dicating a hydrologic shift towards more humid conditions. Droughts during H1 and the return to humid conditions around∼14.8 kyr BP in the uplands are primarily attributed
15
to latitudinal shifts of the Intertropical Convergence Zone (ITCZ) driven by high-latitude Northern Hemisphere climatic fluctuations. Additionally, our results show that the low-land vegetation, consisting of a well developed salt marshes and mangroves in a suc-cessional pattern typical for vegetation occurring in intertidal habitats, has responded mainly to local coastal dynamics related to marine inundation frequencies and soil
20
salinity in the Rufiji Delta as well as the local moisture availability. Lowland vegetation shows a substantial expansion of mangrove trees after∼14.8 kyr BP suggesting also
an increased moisture availability and river runoff in the coastal area. The results of this study highlight the de-coupled climatic and environmental processes to which the vegetation in the uplands and the Rufiji Delta has responded during the last
deglacia-25
CPD
10, 3931–3964, 2014Northern Hemisphere control of deglacial vegetation changes in the Rufiji uplands
(Tanzania)
I. Bouimetarhan et al.
Title Page
Abstract Introduction
Conclusions References
Tables Figures
◭ ◮
◭ ◮
Back Close
Full Screen / Esc
Printer-friendly Version
Interactive Discussion
Discussion
P
a
per
|
Discus
sion
P
a
per
|
Discussion
P
a
per
|
Discussion
P
a
per
|
1 Introduction
The African tropics, a region of major importance for the global hydrologic cycle, have experienced large-scale changes in climate and rainfall fluctuations over the last deglaciation and the Holocene (e.g. Street-Perrot and Perrot, 1990; Lézine et al., 1995; Gasse et al., 2000, 2008; Johnson et al., 2002; Vincens et al., 2005; Castañeda et al.,
5
2007; Tierney et al., 2008; Schefuß et al., 2011; Stager et al., 2011; Bouimetarhan et al., 2012, 2013; Ivory et al., 2012). While millennial-scale hydroclimatic variations in Northwest Africa are commonly linked to atmospheric processes involving latitudi-nal migrations of the Intertropical Convergence Zone (ITCZ) associated with changes in the intensity of the northeasterly trade winds and related to North Atlantic climate
10
anomalies (Dahl et al., 2005; Stouffer et al., 2006; Tjallingii et al., 2008; Mulitza et al., 2008; Itambi et al., 2009; Penaud et al., 2010; Bouimetarhan et al., 2012; Kageyama et al., 2013), the mechanisms responsible for southern tropical climatic changes re-main a matter of debate. The Indian Ocean Dipole (IOD) has been shown to influence modern East African rainfall variability at the interannual scale (Saji et al., 1999; Saji
15
and Yamagata, 2003), but on longer timescales, Indian Ocean sea surface tempera-ture (SST) has been suggested to play a dominant role (Tierney et al., 2008, 2013; Tierney and deMenocal, 2013; Stager et al., 2011). The El Niño–Southern Oscilla-tion (ENSO) has also been invoked to explain extreme rainfall reducOscilla-tions over modern East Africa (e.g. Nicholson, 1996; Plisnier et al., 2000; Indeje et al., 2000; Kijazi and
20
Reason, 2005). Other studies suggest that East African rainfall variability was rather, atmospherically linked to North Atlantic climate fluctuations through a southward shift of the ITCZ (Johnson et al., 2002; Broccoli et al., 2006; Brown et al., 2007; Castañeda et al., 2007; Schefuß et al., 2011; Frierson et al., 2013; Mohtadi et al., 2014).
As the distribution of tropical African vegetation is largely controlled by regional
hy-25
CPD
10, 3931–3964, 2014Northern Hemisphere control of deglacial vegetation changes in the Rufiji uplands
(Tanzania)
I. Bouimetarhan et al.
Title Page
Abstract Introduction
Conclusions References
Tables Figures
◭ ◮
◭ ◮
Back Close
Full Screen / Esc
Printer-friendly Version
Interactive Discussion
Discussion
P
a
per
|
Discus
sion
P
a
per
|
Discussion
P
a
per
|
Discussion
P
a
per
|
Today, most evidence of tropical Eastern African vegetation changes during the last 25 000 years derives from pollen records with the majority reconstructed from continen-tal archives (Gasse, 2000; Vincens et al., 2005; Garcin et al., 2006, 2007; Ivory et al., 2012). These archives serve as a useful tool to reconstruct environmental changes as they highlight the vegetation response to the North Atlantic climatic perturbations and
5
allow obtaining information about their impact on local hydrologic changes.
However, it appears that the response to abrupt climate changes varied geograph-ically and no definitive consensus has been reached on defining which climatic pat-tern was causing East African vegetation changes. While terrestrial records are, in most cases, very local, marine pollen records, given they have sufficient temporal
res-10
olution to resolve millennial-scale climate oscillations, provide a regionally integrated signal of continental climate conditions through changes in vegetation cover. The aim of this study is to document, through high-resolution palynological analysis, vegeta-tion changes in the Rufiji catchment (Southern Tanzania, SE Africa) during the last deglaciation to provide more insight into the timing of arid and humid phases and their
15
connection to global climate forcings. We were able to discern specific responses of plant communities to coastal (marine inundations/sea level changes) and atmospheric (rainfall) alterations in the Rufiji Delta and uplands, respectively. Specifically, the low-land (coastal) vegetation is shown to be strongly affected by the intertidal conditions in the Rufiji Delta, such as river runoffand soil salinity, due to marine inundation
frequen-20
cies, sea level changes, and coastal moisture. The upland vegetation reconstructions presented in this study and their comparison with continental and marine records from the region provide explicit evidence that the deglacial history of vegetation and hydro-climate in the Rufiji uplands was associated with latitudinal shifts of the ITCZ causing dry conditions during H1.
CPD
10, 3931–3964, 2014Northern Hemisphere control of deglacial vegetation changes in the Rufiji uplands
(Tanzania)
I. Bouimetarhan et al.
Title Page
Abstract Introduction
Conclusions References
Tables Figures
◭ ◮
◭ ◮
Back Close
Full Screen / Esc
Printer-friendly Version
Interactive Discussion
Discussion
P
a
per
|
Discus
sion
P
a
per
|
Discussion
P
a
per
|
Discussion
P
a
per
|
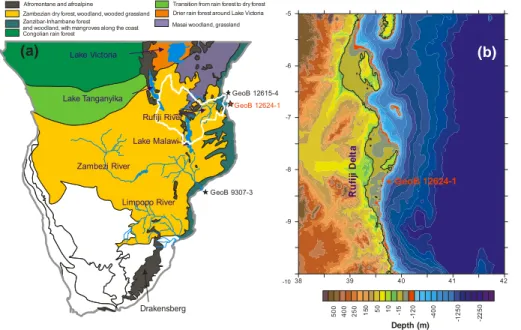
2 Regional setting and background
The Rufiji River, formed by the convergence of three principal tributaries, Kilombero, Luwegu and the Great Ruaha located in the high elevations (750 to 1900 m) of the East African Rift (Temple and Sundborg, 1972; Sokile et al., 2003), lies entirely within Tan-zania. With a mean annual discharge of∼30×109m3and a catchment basin area of
5
∼174 846 km2, the Rufiji forms the second largest delta in eastern Africa after the
Zam-bezi (Temple and Sundborg, 1972). The north-south extent of the Rufiji Delta along the eastern Tanzanian coast is∼65 km and comprises largely undisturbed saline swamps,
tidal marshes and woodland (Temple and Sundborg, 1972). The delta contains the largest estuarine mangrove forest in East Africa with a total area of 53 000 ha (Masalu,
10
2003) found along shorelines and tidal channels that are protected from high-energy wave action and periodically flooded by seawater. Typical mangrove species in the delta includeAvicenna marina,Ceriops tagal andRhizophora mucronata(Masalu, 2003).
The climate of Tanzania is tropical and particularly sensitive to the seasonal mi-gration of the ITCZ. As such, the northern part experiences a bimodal rainfall regime
15
with a long rainy season from March to May and a short rainy season from October to December (e.g. Nicholson, 1996, 2001; Indeje et al., 2000; Agricultural Research Service, 1977). In contrast, the southern regions of Tanzania (8–12◦S), that contain the major part of the Rufiji catchment and the southern uplands, experience tropical summer rainfall with a single well defined rainy season that lasts from November to
20
April (Temple and Sundborg, 1972; Kijazi and Reason, 2005). The dry season occurs during May–October and is dominated by the southeasterly trade winds (Walter and Lieth, 1960–1967; Griffiths, 1972; Nicholson et al., 1988). This seasonality results in strong environmental gradients that have a clear influence on plant distribution.
The vegetation distribution of tropical Africa is controlled mainly by rainfall and its
25
bush-CPD
10, 3931–3964, 2014Northern Hemisphere control of deglacial vegetation changes in the Rufiji uplands
(Tanzania)
I. Bouimetarhan et al.
Title Page
Abstract Introduction
Conclusions References
Tables Figures
◭ ◮
◭ ◮
Back Close
Full Screen / Esc
Printer-friendly Version
Interactive Discussion
Discussion
P
a
per
|
Discus
sion
P
a
per
|
Discussion
P
a
per
|
Discussion
P
a
per
|
land/wooded grassland to Zambezian woodland and includes closed forest, dry scrub-land, alpine open grassland and semi-evergreen lowland forest (Fig. 1) (White, 1983). The Somali–Masai semi-desert grassland and shrubland are dominated by Acacia, Boscia, Asteraceae,Artemisia,Euphorbia,IndigoferaandTamarindus. The Zambezian humid woodland dominated by Uapaca, Brachystegia, and Isoberlina, is mainly well
5
developed in the low to mid-altitudes. These woodlands are replaced by Afromontane communities above 1800–2000 m altitude and vary from montane forests to montane grasslands depending on rainfall. In the lowlands, flooded grasslands host an impor-tant community of Cyperaceae andTypha. Many species of fern and halophytes are common along rivers and streams. Halophytes grow on saline soils in intertidal areas,
10
lagoons and depressions as well as salt-lake shores. They are frequently found in arid and semi-arid regions where rainfall is insufficient to remove salt from soils. Halophytic plant communities in SE Africa are mainly dominated by Amaranthaceae, grasses and some species of Cyperaceae (Kindt et al., 2011).
3 Material and methods
15
3.1 Gravity core GeoB12624-1
We studied the high resolution marine sediment core GeoB12624-1 (8◦14.05′S, 39◦45.16′E), recovered off the Rufiji Delta in the Western Indian Ocean at ∼655 m
water depth during R/VMeteor cruise M75-2 (Savoye et al., 2013). The 600 cm-long core consists of dark olive-gray mud. Generally, the regional wind system is dominated
20
CPD
10, 3931–3964, 2014Northern Hemisphere control of deglacial vegetation changes in the Rufiji uplands
(Tanzania)
I. Bouimetarhan et al.
Title Page
Abstract Introduction
Conclusions References
Tables Figures
◭ ◮
◭ ◮
Back Close
Full Screen / Esc
Printer-friendly Version
Interactive Discussion
Discussion
P
a
per
|
Discus
sion
P
a
per
|
Discussion
P
a
per
|
Discussion
P
a
per
|
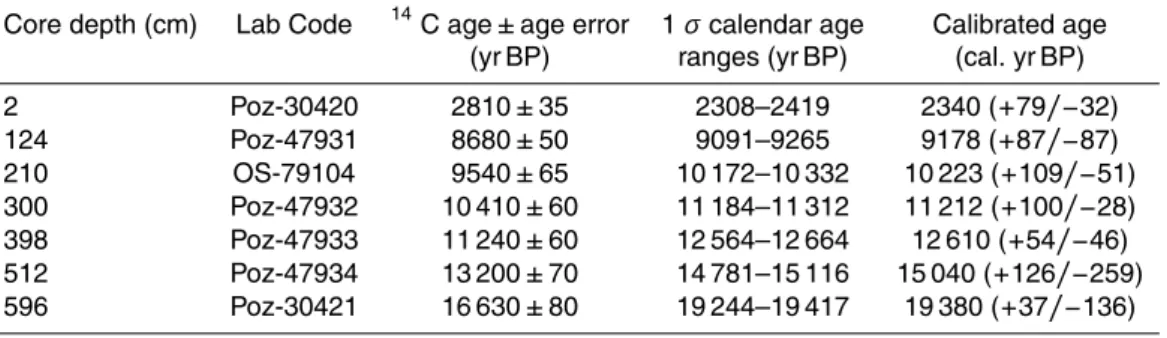
3.2 Radiocarbon dating
The GeoB12624-1 age model is based on 7 accelerator mass spectrometry (AMS) ra-diocarbon ages, measured on mixed samples of planktonic foraminifera at the Poznañ Radiocarbon Laboratory (Poland) and the National Ocean Sciences AMS Facility in Woods Hole (USA) (Table 1). Conventional radiocarbon ages were converted to
calen-5
dar ages with CALIB 6.11 software, using 1σ age ranges (Stuiver and Reimer, 1993) and the marine 09 calibration (Reimer et al., 2009) with a constant reservoir correc-tion of 140 years (±25 yr) (Southon et al., 2002). Sediment ages between dated core
depths were estimated by linear interpolation.
3.3 X-ray fluorescence (XRF) scanning
10
XRF Core Scanner II (AVAATECH Serial No. 2) data were directly collected from the surface of the archive half of core GeoB 12624-1 at the MARUM – University of Bre-men (Germany) every 2 cm down core over a 1.2 cm2area with 10 mm down core slit size, generator settings of 10 kV, a current of 350 µA, and a sampling time of 30 s. The split core surface was covered with a 4 µm SPEXCerti Prep Ultralene1 foil to avoid XRF
15
scanner contamination and desiccation of the sediment. The reported data were ac-quired with a Canberra X-PIPS Detector (SDD; Model SXP 5C-200-1500) with 200 eV X-ray resolution, the Canberra Digital Spectrum Analyzer DAS 1000, and an Oxford Instruments 50W XTF5011 X-Ray tube with rhodium (Rh) target material. Raw data spectra were processed by the analysis of X-ray spectra by Iterative Least square
soft-20
ware (WIN AXIL) package from Canberra Eurisys.
CPD
10, 3931–3964, 2014Northern Hemisphere control of deglacial vegetation changes in the Rufiji uplands
(Tanzania)
I. Bouimetarhan et al.
Title Page
Abstract Introduction
Conclusions References
Tables Figures
◭ ◮
◭ ◮
Back Close
Full Screen / Esc
Printer-friendly Version
Interactive Discussion
Discussion
P
a
per
|
Discus
sion
P
a
per
|
Discussion
P
a
per
|
Discussion
P
a
per
|
3.4 Palynological analysis
In total, 54 sediment samples were prepared for palynological analysis using standard laboratory procedures (Faegri and Iversen, 1989). Sediment (4 cm3) was decalcified with diluted HCl (10 %), and then treated with HF (40 %) to remove silicates. One tablet of exoticLycopodiumspores (18 583±1708 spores/tablet) was added to the samples
5
during the decalcification process in order to calculate palynomorph concentrations per volume of sediment and accumulation rates. After chemical treatment, samples were sieved over an 8 µm nylon mesh screen using an ultrasonic bath (maximum ∼60 s)
to disaggregate organic matter. An aliquot (40–60 µL) was mounted on a permanent glass slide using glycerin. One to four slides per sample were counted under a Zeiss
10
Axioskope light microscope at 400×and 1000×magnification. Pollen grains were
iden-tified following Bonnefille and Riollet (1980), the African Pollen Database (APD) (Vin-cens et al., 2007a) and the reference collection of the Department of Palynology and Climate Dynamics at the University of Göttingen (Germany). 32 pollen taxa were identi-fied and listed in Table 1. Other microfossils such as fern spores and fresh water algae
15
(Botryococcus, Cosmarium, Pediastrum, Scenedesmus and Staurastrum) were also counted.
4 Results
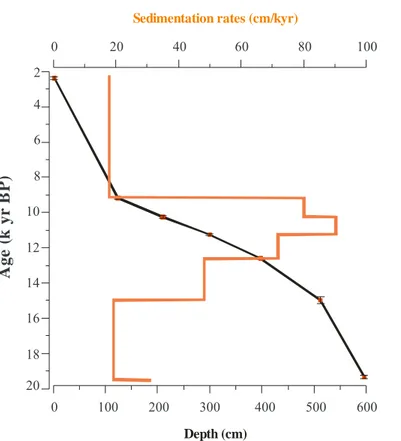
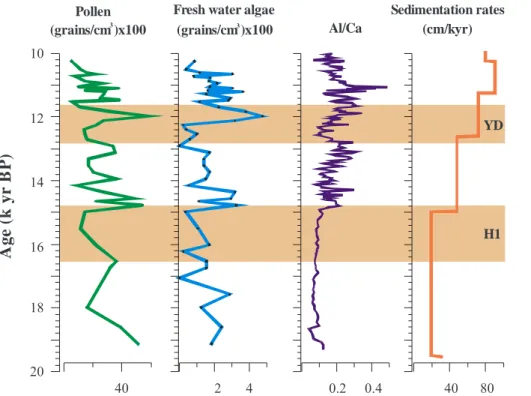
4.1 Age model and sedimentation rates
Radiocarbon dates from 7 samples ranging between 2 and 596 cm core depth are
20
presented in Table 2. The time period represented by core GeoB12624-1 ranges from
∼19.3 to 2.3 kyr BP (Fig. 2). High sedimentation rates are recorded, with maximum
values of 90 cm kyr−1between ∼11.6–10.2 kyr BP. Minimum values (18 cm kyr−1) are
CPD
10, 3931–3964, 2014Northern Hemisphere control of deglacial vegetation changes in the Rufiji uplands
(Tanzania)
I. Bouimetarhan et al.
Title Page
Abstract Introduction
Conclusions References
Tables Figures
◭ ◮
◭ ◮
Back Close
Full Screen / Esc
Printer-friendly Version
Interactive Discussion
Discussion
P
a
per
|
Discus
sion
P
a
per
|
Discussion
P
a
per
|
Discussion
P
a
per
|
counts and were excluded from the interpretation. Thus, this study focuses on the interval∼19–10 kyr BP.
4.2 Palynomorph concentrations and Al/Ca ratios
Plotting the concentrations of pollen and other palynomoprhs shows significant changes of the terrestrial content in the marine sediment (Fig. 3). Pollen
concen-5
trations are relatively high throughout the studied sequence with an average of
∼24×102grains cm−3, varying between∼5×10²and∼58×102grains cm−3(Fig. 3).
High values are recorded after ∼14.8 kyr BP, while low values are recorded mainly
between∼16.8–14.8 kyr BP and in the youngest part after ∼10.6 kyr BP. Parallel to
the increase in pollen concentrations, the Al/Ca ratios increase after ∼14.8 kyr BP
10
with a prominent peak between ∼11.6–10.6 kyr BP (Fig. 3). Maxima in Al/Ca ratios
correspond to higher sedimentation rates and high fresh water algae concentrations.
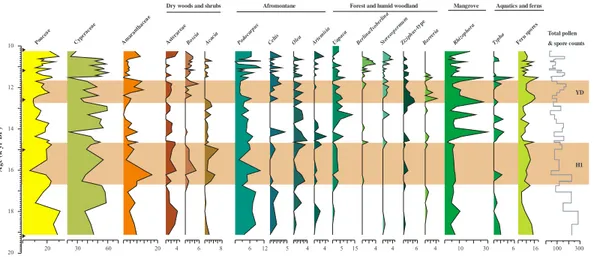
4.3 Pollen assemblages
The interval between∼19–14.8 kyr BP is marked by the presence of afromontane taxa,
such asPodocarpus,Celtis,Olea, andArtemisia, exhibiting higher values at the
begin-15
ning of the interval, but decrease around∼16.6 kyr BP (Fig. 4). This interval is also
characterized by the dominance of Poaceae pollen (up to ∼30 %) at the beginning.
Poaceae pollen maxima are followed by a dominance of Cyperaceae (∼60 %), which,
in turn decline around∼16.6 kyr BP when Amaranthaceae pollen increase rapidly up
to ∼16 % along with Asteraceae, Boscia and Acacia. Around 14.8 kyr BP, values of
20
Rhizophora increase rapidly to their maximum of ∼30 %. This occurs right after the
Amaranthaceae pollen maxima and simultaneously with the increase in Al/Ca ratios. In parallel,Uapacapollen increase remarkably reaching up to∼15 % of the assemblage
along with other taxa from the forest and humid woodland, such asBerlinia/Isoberlina, Sterospermum,Ziziphus andBorreria. Abundances of pollen of the aquatic taxon
Ty-25
CPD
10, 3931–3964, 2014Northern Hemisphere control of deglacial vegetation changes in the Rufiji uplands
(Tanzania)
I. Bouimetarhan et al.
Title Page
Abstract Introduction
Conclusions References
Tables Figures
◭ ◮
◭ ◮
Back Close
Full Screen / Esc
Printer-friendly Version
Interactive Discussion
Discussion
P
a
per
|
Discus
sion
P
a
per
|
Discussion
P
a
per
|
Discussion
P
a
per
|
Poaceae and taxa from dry woods and schrubs decline steadily. Afromontane taxa are still present albeit with lower values than in the older part of the record (Fig. 4).
Between∼12.8–11.6 kyr BP, percentages of Amaranthaceae and Poaceae increase
simultaneously with Astercaeae andBosciarepresentatives of dry woods and shrubs. The decrease in representation of Cyperaceae pollen,Rhizophora,Typha, fern spores,
5
afromontane and taxa from the forest and humid woodland occurs during this time in-terval along with a slight decrease in Al/Ca ratios. Around ∼11.6 kyr BP, the record
is marked by a rapid increase in percentages forRhizophora,Typha and fern spores followed by a dominance of Cyperaceae pollen which are in turn replaced by percent-age maxima of Poaceae and Amaranthaceae by the end of the record (Fig. 4). These
10
changes are concordant with the increase of Al/Ca ratios that peak∼11 kyr BP, only
to decrease again at the end of the record.
5 Reconstruction of the vegetation: lowland (coastal) vs. upland
The terrestrial palynomorph content presented in this study shows that the most abundant pollen are from Poaceae (grasses), Cyperaceae (e.g. sedges),Rhizophora
15
(mangrove tree), and Amaranthaceae (herbs including many species growing in salt marshes and on salty soils) followed by pollen ofPodocarpus(yellow wood). The de-velopment of these plant communities interacts differently with inherent environmental variability such as soils, topography, and climate. Therefore, our site had received an integrated contribution from both the lowland and upland vegetation.
20
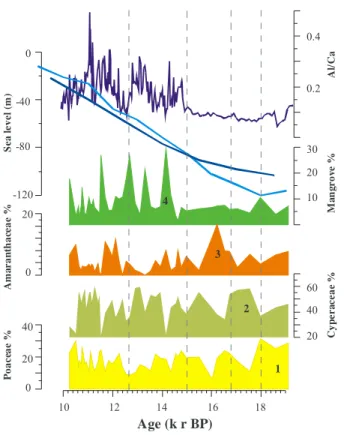
5.1 Lowland vegetation: expansion of the salt marshes and mangrove
The pollen record indicates a directional alternation of three pollen families, between
∼19 to 14.8 kyr BP, in the following order: Poaceae, Cyperaceae and Amaranthaceae,
followed by an increase in mangrove around∼14.8 kyr BP (Fig. 5, steps 1 to 4). The
former pollen taxa belong to plant families that host the most common representatives
CPD
10, 3931–3964, 2014Northern Hemisphere control of deglacial vegetation changes in the Rufiji uplands
(Tanzania)
I. Bouimetarhan et al.
Title Page
Abstract Introduction
Conclusions References
Tables Figures
◭ ◮
◭ ◮
Back Close
Full Screen / Esc
Printer-friendly Version
Interactive Discussion
Discussion
P
a
per
|
Discus
sion
P
a
per
|
Discussion
P
a
per
|
Discussion
P
a
per
|
of halophytic vegetation in tropical SE Africa (White, 1983; Kindt et al., 2011). Although they inhabit a wide range of environments, their development in this sequence in ad-dition to the following expansion of mangrove suggests a gradational pattern typical of salt marshes occurring in intertidal habitats (between mean sea level and high water spring level) in coastal areas. Therefore, they are considered, due to their proximity to
5
the shoreline, to be affected by marine inundation frequencies and sea level changes and thus to reflect the coastal dynamics in the Rufiji Delta (Blasco et al., 1996; Hogarth et al., 1999). The East African coast located in the Southwestern Indian Ocean lies in a “far-field” location (Woodroffe and Horton, 2005) considered to be situated at sig-nificant distances from ice sheet melting. This implies that isostatic effects from large
10
ice sheets are considered to be minimal in this area (Punwong et al., 2012). There-fore, it is trustworthy to compare our high-resolution pollen record with general sea level reconstructions (Waelbroeck et al., 2002; Rohling et al., 2009). This comparison shows that when sea-level was∼80–120 m lower relative to today, the exposed shelf
allowed the grass (Poaceae) and sedges (Cyperaceae) to expand (Fig. 5, Fig. 6e).
15
During the subsequent sea level rise, only pioneer species from the Amaranthaceae tolerating highly saline environments with a permanent tidal influence and having high colonizing abilities could expand under these stressful conditions. The development of mangrove around∼14.8 kyr BP might reflect either the expansion of mangrove
veg-etation along the Rufiji Delta or the erosion of mangrove peat during sea-level rise
20
(Hooghiemstra et al., 1986; Dupont et al., 1989; Dupont and Agwu, 1991; Lézine at al., 1995; Lézine, 1996; Kim et al., 2005; Versteegh et al., 2004; Scourse et al., 2005). Mangroves are most common in wetter habitats and swamps where brackish water ac-cumulates. They are known to be very sensitive to sea level fluctuations and runoff
variability (Hooghiemstra and Agwu, 1986; Dupont and Agwu, 1991; Lézine et al.,
25
CPD
10, 3931–3964, 2014Northern Hemisphere control of deglacial vegetation changes in the Rufiji uplands
(Tanzania)
I. Bouimetarhan et al.
Title Page
Abstract Introduction
Conclusions References
Tables Figures
◭ ◮
◭ ◮
Back Close
Full Screen / Esc
Printer-friendly Version
Interactive Discussion
Discussion
P
a
per
|
Discus
sion
P
a
per
|
Discussion
P
a
per
|
Discussion
P
a
per
|
period of global sea-level rise (Waelbroeck et al., 2002; Rohling et al., 2009) (Fig. 5), would be considered as a positive reaction to changes in local hydrologic conditions through an increased river runoffpromoted by higher moisture availability in the coast after∼14.8 kyr BP. By this means, higher freshwater input and increased
sedimenta-tion rates may dominate over local sea-level rise, suppressing the intrusion of sea water
5
and allowing complex plant communities to develop on the delta and mangroves to ex-pand landward in response to increased rainfall over the Rufiji Delta (Punwong et al., 2012). Increasing both freshwater supply and sediment load would also fit the devel-opment of aquatic taxa such asTypha, which is represented parallel to theRhizophora pollen maxima reflecting wetter coastal conditions and continuous input of freshwater.
10
Therefore, the erosion of mangrove peat during sea-level rise is less likely because this would imply reduced freshwater flow to the coast and dry climatic conditions.
Taken together, the succession of salt marshes and mangrove reflects the response of coastal plant communities to changes in intertidal environments (soil development and salinity gradient) and coastal dynamics in the Rufiji Delta influenced by sea-level
15
changes as suggested by González et al. (2009). Due to their proximity to the shoreline, salt marshes and mangrove dominate the vegetation record with pollen percentages accounting for up to 80 % of the total assemblage overprinting the signal of other taxa. In order to get more insights into the upland environmental signal, they have been excluded from the total pollen sum.
20
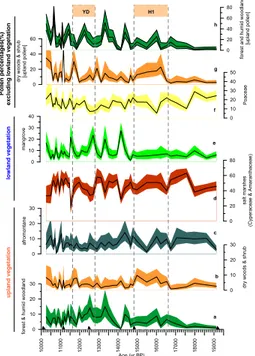
5.2 Upland vegetation: dry woods to humid forest transition
The total pollen assemblage is dominated by afromontane forest taxa in the earliest part of the record until∼16.6 kyr BP (Fig. 6c). Afromontane forest mainly developed in
mountains favoured by cold and humid conditions. Their presence in the pollen record would thus be expected if the afromontane forest had spread to lower altitudes than
cur-25
CPD
10, 3931–3964, 2014Northern Hemisphere control of deglacial vegetation changes in the Rufiji uplands
(Tanzania)
I. Bouimetarhan et al.
Title Page
Abstract Introduction
Conclusions References
Tables Figures
◭ ◮
◭ ◮
Back Close
Full Screen / Esc
Printer-friendly Version
Interactive Discussion
Discussion
P
a
per
|
Discus
sion
P
a
per
|
Discussion
P
a
per
|
Discussion
P
a
per
|
at a lower elevation (Vincens et al., 2007b; Ivory et al., 2012) due to freezing conditions at higher altitudes, cooler conditions at lower altitudes, and lowerpCO2(Street-Perott et al., 1997; Wu et al., 2007). During the gradual decline of the afromontane taxa, the pollen representatives of dry wood and shrub vegetation increase significantly between
∼16.6–14.8 kyr BP (Fig. 6b). This transition suggests a change towards drier
condi-5
tions compared to the previous period and coincides with the timing of the North At-lantic H1 (Hemming, 2004; Stanford et al., 2011 (H1sensu stricto)). Around∼14.8 kyr
BP, the vegetation cover became denser. The decline of elements from dry woods and shrubs and the drastic decrease in afromontane forest is followed by an increase in pollen from forest and humid woodland (Fig. 6a). A similar vegetation trend has been
10
recorded in several pollen records from Lakes Malawi, Tanganyika, Rukwa and Ma-soko, indicating the retreat of the afromontane vegetation to higher altitudes due to progressive warming after H1 and the expansion of moist forest due to enhanced rain-fall (Vincens, 1993; Vincens et al., 2005, 2007b; Ivory et al., 2012).
Between ∼12.8–11.6 kyr BP, the presence of elements from both the forest and
15
humid woodland vegetation and from dry woods and shrubs (Fig. 6a and b) suggests that vegetation was more heterogeneous. In contrast to other records from most of the African tropics (Gasse, 2000; Barker et al., 2007; Mulitza et al., 2008; Tierney et al., 2008; Junginger et al., 2014) where indicators of aridity have been observed during this time interval coincident with the YD (YD, 12.8–11.5 kyr BP) (Alley, 2000; Muscheler
20
et al., 2008), our records do not show a clear climatic trend.
Around∼11.6 kyr BP, sharply rising Al/Ca ratios and high sedimentation rates along
with the presence of pollen from forest and humid woodland would indicate increased precipitation. However, the decline of nearly all the pollen taxa percentages, Al/Ca ratios and sedimentation rates at the end of the record, around∼10.6 kyr BP, reflects
25
CPD
10, 3931–3964, 2014Northern Hemisphere control of deglacial vegetation changes in the Rufiji uplands
(Tanzania)
I. Bouimetarhan et al.
Title Page
Abstract Introduction
Conclusions References
Tables Figures
◭ ◮
◭ ◮
Back Close
Full Screen / Esc
Printer-friendly Version
Interactive Discussion
Discussion
P
a
per
|
Discus
sion
P
a
per
|
Discussion
P
a
per
|
Discussion
P
a
per
|
6 Paleoclimate and controlling mechanisms in the uplands
During H1, upland vegetation changed from afromontane forest to dry woods and shrubs (Fig. 6b and c). Forest and humid woodland developed after∼14.8 kyr BP and
continued to expand through the time interval of the YD (Fig. 6a).
If we exclude the dominant pollen taxa (salt marshes and mangrove) from the total
5
sum, dry woods and shrubs still show a substantial expansion during H1 as we can see in Fig. 6g. This, together with the sharply reduced Al/Ca ratios indicate increased arid-ity in the uplands during H1. The direct comparison of our record and terrestrial stud-ies, shows that the signal of decreased precipitation coincides with lowered lake levels, as demonstrated for Sacred Lake in Kenya (Street-Perrot et al., 1997), Lake Challa,
10
Tanzania (Verschuren et al., 2009), Lake Rukwa, Tanzania (Vincens et al., 2005) and Lake Tanganyika (Burnett et al., 2011). Dry H1 conditions are also suggested by iso-tope records of the Tanganyika basin (Tierney et al., 2008) and Lake Malawi (Johnson et al., 2002; Brown et al., 2007; Castañeda et al., 2007). The expansion of forest and humid woodland (Fig. 6h) along with higher Al/Ca ratios and sedimentation rates after
15
H1 suggests a significant change in the hydrological regime towards enhanced rain-fall and increased terrigeneous discharge. We thus infer a shift towards more humid conditions. Significant increase in moisture after∼14.8 kyr BP has been reported from
vegetation records in continental archives (Vincens, 1993; Vincens et al., 2005, 2007b; Ivory et al., 2012) as well as from lake records (Gasse et al., 2000; Junginger et al.,
20
2014). In sum, upland aridity during H1 and the initiation of humid conditions around
∼14.8 kyr BP as reconstructed from our records correlate (within age model
uncertain-ties) with changes inferred from continental archives from most of the tropical eastern and south-eastern African lakes and are in agreement with northern tropical African records (e.g. Hooghiemstra, 1988; Zhao et al., 2000; Mulitza et al., 2008; Itambi et al.,
25
2009; Niedermeyer et al., 2009; Bouimetarhan et al., 2012, 2013).
CPD
10, 3931–3964, 2014Northern Hemisphere control of deglacial vegetation changes in the Rufiji uplands
(Tanzania)
I. Bouimetarhan et al.
Title Page
Abstract Introduction
Conclusions References
Tables Figures
◭ ◮
◭ ◮
Back Close
Full Screen / Esc
Printer-friendly Version
Interactive Discussion
Discussion
P
a
per
|
Discus
sion
P
a
per
|
Discussion
P
a
per
|
Discussion
P
a
per
|
precipitation at the interannual timescale (Saji and Yamagata, 2003). However, recent hydrological records from the eastern equatorial Indian Ocean (Mohtadi et al., 2014) suggest similarly dry conditions during H1 and YD, ruling out a zonal IOD-like dipole structure between Indonesia and the eastern African lakes as suggested earlier by Tierney et al. (2008). Many studies have proposed ENSO as an important driver of
5
extreme rainfall anomalies over East Africa (e.g. Nicholson, 1996; Plisnier et al., 2000; Indeje et al., 2000). However, evidence for an ENSO-biased mean climate state dur-ing H1 is generally ambiguous (Leduc et al., 2009; Prange et al., 2010). Moreover, it has recently been shown that the impact of the tropical Pacific on East African rainfall disappears on multidecadal and perhaps longer timescales (Tierney et al., 2013).
Re-10
sults from climate model studies suggest a north–south anti-phase relation in African precipitation in response to North Atlantic cooling (“H1 experiments”), consistent with latitudinal migrations of the ITCZ (e.g., Lewis et al., 2010; Kageyama et al., 2013). In line with this hypothesis, the dry spell recorded in our data during H1 has (within age model uncertainties) a pronounced wet counterpart in the Zambezi region (Schefuß
15
et al., 2011). We therefore suggest that the ENSO impact over southern Tanzania and hence the major portion of the Rufiji catchment area was not the main mechanism for the H1 drought. Instead, based on recent model results we suggest that the observed H1 dry conditions in the uplands are part of a north-south dipole rainfall anomaly over East Africa and the Indian Ocean, consistent with a southward ITCZ shift in response
20
to Northern Hemisphere cooling (Mohtadi et al., 2014). In this scenario, an anoma-lous Hadley cell develops over eastern Africa and the Indian Ocean which transports energy across the equator into the Northern Hemisphere (cf. Broccoli et al., 2006; Frierson et al., 2013). The anomalous Hadley cell is associated with a strong north-easterly surface wind anomaly and anomalous subsidence over northern and tropical
25
plau-CPD
10, 3931–3964, 2014Northern Hemisphere control of deglacial vegetation changes in the Rufiji uplands
(Tanzania)
I. Bouimetarhan et al.
Title Page
Abstract Introduction
Conclusions References
Tables Figures
◭ ◮
◭ ◮
Back Close
Full Screen / Esc
Printer-friendly Version
Interactive Discussion
Discussion
P
a
per
|
Discus
sion
P
a
per
|
Discussion
P
a
per
|
Discussion
P
a
per
|
sible and are supported by several studies in the Indian Ocean realm (Johnson et al., 2002; Brown et al., 2007; Castañeda et al., 2007; Schefuß et al., 2011; Mohtadi et al., 2014).
Alternatively, Indian Ocean sea surface temperatures (SSTs) might also play a role in influencing SE African hydrology and vegetation. Cooler SSTs during millennial-scale
5
stadials would have reduced moisture transport from the Indian Ocean implying a re-duction of monsoonal precipitation. Therefore, dry conditions during cold stadials have been suggested to have been related to low Indian Ocean SSTs (Tierney et al., 2008; Stager et al., 2011). Lower SSTs in the Indian Ocean have been proposed as a poten-tial mechanism for “catastrophic droughts” in SE Africa during H1 as they would tend
10
to reduce the evaporative moisture content of the ITCZ (Stager et al., 2011). However, Mg/Ca reconstructed SSTs from the nearby core GeoB12615-4 (7◦08.30′S, 39◦50.45′) in the western Indian Ocean show warming during H1 (Romahn et al., 2014), such that we rule out a dominant effect of Indian Ocean SST forcing on H1 aridity in the southern uplands of Tanzania.
15
The prominent decrease in precipitation that we infer for H1 is however not recorded during YD. The vegetation reconstructions in our record show an alternation between humid and dry taxa during YD (Fig. 6g and h). This pattern reflects no clear climatic trend, while most records from the African tropics suggest drier conditions during YD (Gasse, 2000; Barker et al., 2007; Mulitza et al., 2008; Tierney et al., 2008;
Jungin-20
ger et al., 2014). In addition, marine records from the northern Indian Ocean realm have also shown dry conditions during YD as a response to a southward shift of the ITCZ (Mohtadi et al., 2014). However, two vegetation records from adjacent locations in tropical East Africa highlight different regional responses during the YD. Lake Ma-soko, a small lake within the Lake Malawi watershed, recorded an expansion of tropical
25
environ-CPD
10, 3931–3964, 2014Northern Hemisphere control of deglacial vegetation changes in the Rufiji uplands
(Tanzania)
I. Bouimetarhan et al.
Title Page
Abstract Introduction
Conclusions References
Tables Figures
◭ ◮
◭ ◮
Back Close
Full Screen / Esc
Printer-friendly Version
Interactive Discussion
Discussion
P
a
per
|
Discus
sion
P
a
per
|
Discussion
P
a
per
|
Discussion
P
a
per
|
mental responses to YD are consistent with the heterogeneous vegetation observed in our record suggesting that the YD signal from this area is ambiguous which corrob-orate previous findings in the Indo-Pacific Warm Pool (Denniston et al., 2013; Dubois et al., 2014) where YD is also not well defined. Therefore, our data suggest that H1 had a greater influence on East African hydrologic conditions than the YD, another North
5
Atlantic cold event that likely, due to its short duration compared to H1, did not displace the ITCZ as far south as H1 causing these ambiguous signals.
7 Conclusions
The marine pollen record offthe Rufiji River provides new information on the deglacial vegetation history and hydrologic variability in SE Africa. The upland vs. lowland
vege-10
tation records offered a great opportunity to discern ecosystem responses to different environmental changes related to oceanic (coastal dynamics) and atmospheric (precip-itation) alterations. The upland vegetation shows drier conditions during the Northern Hemisphere cold H1, with a return to more humid conditions around ∼14.8 kyr BP
inferred from the expansion of forest and humid woodland. The lowland (coastal)
veg-15
etation shows a well-established salt marsh vegetation and mangroves along the Rufiji Delta throughout the whole record with a substantial expansion of mangroves around
∼14.8 kyr BP as a positive reaction to higher moisture availability in the coastal area.
The observed H1 aridity in the uplands is consistent with a southward displacement of the ITCZ driven by high-latitude climate changes in the Northern Hemisphere. This
20
finding suggests that the extension and composition of plant assemblages in the upland during H1 is primarily controlled by Northern Hemisphere climatic fluctuations corrob-orating previous studies from SE Africa and the Indian Ocean realm that evidenced the response of the regional hydrologic system to millennial-scale North Atlantic cold spells. By contrast, our data suggest that Indian Ocean SSTs did not correlate with the
25
CPD
10, 3931–3964, 2014Northern Hemisphere control of deglacial vegetation changes in the Rufiji uplands
(Tanzania)
I. Bouimetarhan et al.
Title Page
Abstract Introduction
Conclusions References
Tables Figures
◭ ◮
◭ ◮
Back Close
Full Screen / Esc
Printer-friendly Version
Interactive Discussion
Discussion
P
a
per
|
Discus
sion
P
a
per
|
Discussion
P
a
per
|
Discussion
P
a
per
|
modulating the local coastal plant community by favoring/reducing the expansion of salt marsh vegetation and mangroves. Our results offer an important complement to previ-ously published paleorecords from the region and highlight the contrasting processes to which upland and lowland vegetation have responded.
Acknowledgements. This work was funded through the Deutsche Forschungsgemeinschaft as
5
part of the DFG-Research Center/Excellence cluster “The Ocean in the Earth System”. We
thank the captain, the crew and participants of R/VMeteorcruise M75/2 for recovering the
stud-ied material. Jeroen Groeneveld, Kara Bogus and Martin Kölling are thanked for their valuable suggestions. We thank Mahyar Mohtadi and Monika Segl for help with radiocarbon datings. Laura Dohn and Monika Michaelis are thanked for their help with palynological processing, 10
Oliver Mautner is thanked for his help with the foraminifera picking. This research used data acquired at the XRF Core Scanner Lab at the MARUM – Center for Marine Environmental Sci-ences, University of Bremen, Germany. Data have been submitted to the Publishing Network for Geoscientific & Environmental Data (PANGAEA, www.pangaea.de).
References
15
Barker, P., Leng, M. J., Gasse, F., and Huang, Y.: Century-to-millennial scale climatic variability in Lake Malawi reveales by isotope records, Earth Planet. Sc. Lett., 261, 93–103, 2007. Blasco, F., Saenger, P., and Janodet, E.: Mangrove as indicators of coastal change, Catena,
27, 167–178, 1996.
Bonnefille, R. and Riollet, G.: Pollens des Savanes d’Afrique Orientale, Edition de CNRS, Paris, 20
140 pp., 113pl., 1980.
Bouimetarhan, I., Prange, M., Schefuß, E., Dupont, L., Lippold, J., Mulitza, S., and Zonn-eveld, K.: Sahel megadrought during Heinrich Stadial 1: evidence for a three-phase evolution of the low- and mid-level West African wind system, Quaternary Sci. Rev., 58, 66–76, 2012. Bouimetarhan, I., Groeneveld, J., Dupont, L., and Zonneveld, K.: Low- to high-productivity pat-25
tern within Heinrich stadial 1: inferences from dinoflagellate cyst records offSenegal, Global
Planet. Change, 106, 64–76, 2013.
Broccoli, A. J., Dahl, K. A., and Stouffer, R. J.: Response of the ITCZ to Northern Hemisphere
CPD
10, 3931–3964, 2014Northern Hemisphere control of deglacial vegetation changes in the Rufiji uplands
(Tanzania)
I. Bouimetarhan et al.
Title Page
Abstract Introduction
Conclusions References
Tables Figures
◭ ◮
◭ ◮
Back Close
Full Screen / Esc
Printer-friendly Version
Interactive Discussion
Discussion
P
a
per
|
Discus
sion
P
a
per
|
Discussion
P
a
per
|
Discussion
P
a
per
|
Brown, E. T., Johnson, T. C., Scholz, C. A., Cohen, A. S., and King, J. W.: Abrupt change in tropical African climate linked to the bipolar seesaw over the past 55 000 years, Geophys. Res. Lett., 34, L20702, doi:10.1029/2007GL031240, 2007.
Castañeda, I. S., Werne, J. P., and Hohnson, T. C.: Wet and arid phases in the southeast African tropics since the Last Glacial Maximum, Geology, 35, 823–826, 2007.
5
Dahl, K. A., Broccoli, A. J., and Stouffer, R. J.: Assessing the role of North Atlantic freshwater
forcing in millennial scale climate variability: a tropical Atlantic perspective, Clim. Dynam., 24, 325–346, 2005.
Denniston, R. F., Wyrwoll, K.-H., Asmerom, Y., Polyak, V. J., Humphreys, W. F., Cugley, J., Woods, D., LaPointe, Z., Peota, J., and Greaves, E.: North Atlantic forcing of millennial-scale 10
Indo-Australian monsson dynamics during the Last Glacial Period, Quaternary Sci. Rev., 72, 159–168, 2013.
Dubois, N., Oppo, D. W., Galy, V. V., Mohtadi, M., van der Kaars, S., Tierney, J. E., Rosenthal, Y., Eglinton, T. I., Lückge, A., and Linsley, B. K.: Indonesian vegetation response to changes in rainfall seasonality over the past 25 000 years, Nat. Geosci., 7, 513–517, 2014.
15
Dupont, L.: Orbital scale vegetation change, Quaternary Sci. Rev., 30, 3589–3602, 2011. Dupont, L. M. and Agwu, C. O. C.: Environmental control of pollen grain distribution patterns in
the Gulf of Guinea and offshore NW-Africa, Geol. Rundsch., 80, 567–589, 1991.
Faegri, K. and Iversen, J.: Textbook of Pollen Analysis, IV, edited by: Faegri, K., Kaland, P. E., and Krzywinski, K., Wiley, New York, 1989.
20
Fensome, R. A. and Williams, G. L.: The Lentin and Williams index of fossil dinoflagellate, 2004 edition, American Association of Stratigraphic Palynologist Foundation contributions series, vol. 42, 909 pp., 2004.
Fensome, R. A., MacRae, R. A., and Williams, G. L.: DINOFLAJ, Geological Survey of Canada Open File, 3653, 1988.
25
Frierson, D. M. V., Hwang, Y.-T., Fuèkar, N. S., Seager, R., Kang, S. M., Donohoe, A., Ma-roon, E. A., Liu, X., and Battisti, D. S.: Contribution of ocean overturning circulation to tropical rainfall peak in the Northern Hemisphere, Nat. Geosci., 6, 940–944, doi:10.1038/ngeo1987, 2013.
Garcin, Y., Vincens, A., Williamson, D., Guiot, J., and Buchet, G.: Wet phases in trop-30
CPD
10, 3931–3964, 2014Northern Hemisphere control of deglacial vegetation changes in the Rufiji uplands
(Tanzania)
I. Bouimetarhan et al.
Title Page
Abstract Introduction
Conclusions References
Tables Figures
◭ ◮
◭ ◮
Back Close
Full Screen / Esc
Printer-friendly Version
Interactive Discussion
Discussion
P
a
per
|
Discus
sion
P
a
per
|
Discussion
P
a
per
|
Discussion
P
a
per
|
Garcin, Y., Vincens, A., Williamson, D., Buchet, G., and Guiot, J.: Abrupt resumption of the African Monsoon at the Younger Dryas–Holocene climatic transition, Quaternary Sci. Rev., 26, 690–704, 2007.
Gasse, F.: Hydrological changes in the African tropics since the Last Glacial Maximum, Qua-ternary Sci. Rev., 19, 189–211, 2000.
5
Gasse, F., Chalié, F., Vincenes, A., Williams, A. J., and Williamson, D.: Climatic patterns in equatorial Africa and Southern Africa from 30 000 to 10 000 years ago reconstructed from terrestrial and near-shore proxy data, Quaternary Sci. Rev., 27, 2316–2340, 2008.
González, C. and Dupont, L.: Tropical salt marsh sucesión as sea-level indicator during Heinrich events, Quaternary Sci. Rev., 28, 939–946, 2009.
10
Griffiths, J. F.: Climate of Africa. World Survey of Climatology, volume 10, Elsevier, Amsterdam,
604 pp., 1972.
Hély, C., Bremond, L., Alleaume, S., Smith, B., Sykes, M., and Guiot, J.: Sensitivity of African biomes to changes in the precipitation regime, Global Ecol. Biogeogr., 15, 258–270, 2006. Hemming, S. R.: Heinrich events: massive late Pleistocene detritus layers of the North Atlantic 15
and their global climate imprint, Rev. Geophys., 42, RG1005, doi:10.1029/2003RG000128, 2004.
Hogarth, P. J.: The Biology of Mangroves, Oxford University Press, New York, 228 pp., 1999. Hooghiemstra, H. and Agwu, C. O. C.: Distribution of palynomorphs in marine sediment:
a record for seasonal wind patterns over NW Africa and adjacent Atlantic, Geol. Rundsch., 20
75, 81–95, 1986.
Hooghiemstra, H.: Changes of major wind belts and vegetation zones in NW Africa 20 000– 5000 yr BP, as deduced from a marine pollen record near Cap Blanc, Rev. Palaeobot. Palyno., 55, 101–140, 1988.
Itambi, A. C., von Dobeneck, T., Mulitza, S., Bickert, T., and Heslop, D.: Millennial scale 25
North West African droughts relates to Heinrich event and Dansgaard-Oeschger cycles:
evidence in marine sediments from off-shore Senegal, Paleoceanography, 24, 001570,
doi:10.1029/2007PA001570, 2009.
Ivory, S. J., Lézine, A.-M., Vincens, A., and Cohen, A. S.: Effect of aridity and rainfall
season-ality on vegetation in the southern tropics of east Africa during the Pleistocene/Holocene 30
CPD
10, 3931–3964, 2014Northern Hemisphere control of deglacial vegetation changes in the Rufiji uplands
(Tanzania)
I. Bouimetarhan et al.
Title Page
Abstract Introduction
Conclusions References
Tables Figures
◭ ◮
◭ ◮
Back Close
Full Screen / Esc
Printer-friendly Version
Interactive Discussion
Discussion
P
a
per
|
Discus
sion
P
a
per
|
Discussion
P
a
per
|
Discussion
P
a
per
|
Johnson, T. C., Brown, E. T., McManus, J., Barry, S., Barker, P., and Gasse, F.: A high-resolution paleoclimate record spanning the past 25 000 years in Southern east Africa, Science, 296, 113–132, 2002.
Junginger, A., Roller, S., Olaka, L. A., and Trauth, M. H.: The effects of solar irradiation changes
on the migration of the Congo Air Boundary and water levels of paleo-Lake Suguta, Northern 5
Kenya Rift, during the African humid period (15–5 ka BP), Palaeogeogr. Palaeocl., 396, 1–16, 2014.
Kageyama, M., Merkel, U., Otto-Bliesner, B., Prange, M., Abe-Ouchi, A., Lohmann, G., Ohgaito, R., Roche, D. M., Singarayer, J., Swingedouw, D., and X Zhang: Climatic impacts of fresh water hosing under Last Glacial Maximum conditions: a multi-model study, Clim. Past, 10
9, 935–953, doi:10.5194/cp-9-935-2013, 2013.
Kiefer, T., McCave, N. I., and Elderfield, H.: Antarctic control on tropical Indian Ocean sea surface temperature and hydrography, Geophys. Res. Lett., 33, L24612, doi:10.1029/2006GL027097, 2006.
Kijazi, A. L. and Reason, C. J. C.: Relationships between intraseasonal rainfall variability of 15
coastal Tanzania and ENSO, Theor. Appl. Climatol., 82, 153–176, 2005.
Kindt, R., Lillesø, J.-P. B., van Breugel, P., Bingham, M., Sebsebe, D., Dudley, C., Friis, I., Gachathi, F., Kalema, J., Mbago, F., Minani, V., Moshi, H. N., Mulumba, J., Namaganda, M.,
Ndangalasi, H. J., Ruffo, C. K., Jamnadass, R., and Graudal, L.: Potential Natural Vegetation
of Eastern Africa, volume 5: Description and Tree Species Composition for Other Potential 20
Natural Vegetation Types, Forest and Landscape Working paper 65-2011, 2011.
Leduc, G., Vidal, L., Tachikawa, K., and Bard. E.: ITCZ rather than ENSO signature for abrupt climate changes across the tropical Pacific?, Quaternary Res., 72, 123–131, 2009.
Lewis, S. C., LeGrande, A. N., Kelley, M., and Schmidt, G. A.: Water vapour source impacts on oxygen isotope variability in tropical precipitation during Heinrich events, Clim. Past, 6, 25
325–343, doi:10.5194/cp-6-325-2010, 2010.
Lézine, A. M.: La mangrove ouest africaine, signal des variations du niveau marin et des con-ditions régionales du climat au cours de la dernière déglaciation, B. Soc. Geol. Fr., 167, 743–752, 1996.
Lézine, A. M., Turon, J. L., and Buchet, G.: Pollen analyses offSenegal: evolution of the coastal
30
CPD
10, 3931–3964, 2014Northern Hemisphere control of deglacial vegetation changes in the Rufiji uplands
(Tanzania)
I. Bouimetarhan et al.
Title Page
Abstract Introduction
Conclusions References
Tables Figures
◭ ◮
◭ ◮
Back Close
Full Screen / Esc
Printer-friendly Version
Interactive Discussion
Discussion
P
a
per
|
Discus
sion
P
a
per
|
Discussion
P
a
per
|
Discussion
P
a
per
|
Masalu, D. C. P.: Challenges of coastal area management in coastal developing countries-lessons from the proposed Rufiji Delta prawn farming project, Tanzania, Ocean Coast. Man-age., 46, 175–188, 2003.
Mgaya, Y. D.: The Vulnerability of Mangrove and Adjacent Coral Reefs to Climate Change in Rufiji Delta, literature review submitted to WWF Tanzania (The Eastern African Marine 5
Ecoregion), January 2004, 2004.
Mohtadi, M., Prange, M., Oppo, D. W., De Pol-Holz, R., Merkel, U., Zhang, X., Steinke, S., and Lückge, A.: North Atlantic forcing of tropical Indian Ocean climate, Nature, 509, 76–80, 2014.
Mulitza, S., Prange, M., Stuut, J. B., Zabel, M., von Dobeneck, T., Itambi, C. A., Nizou, J., 10
Schulz, M., and Wefer, G.: Sahel megadroughts triggered by glacial slowdowns of Atlantic meridional overturning, Paleoceanography, 23, PA4206, doi:10.1029/2008PA001637, 2008. Nicholson, S. E.: A review of climate dynamamics and climate variability in Eastern Africa,
in: The Limnology, Climatology and Paleoclimatology of the East African Lakes, edited by: Johnson, T. C. and Odada, E. O., Gordon and Breach, Amsterdam, 25–56, 1996.
15
Nicholson, S. E., Kim, J., and Hoopingarner, J.: Atlas of African rainfall and its interannual variability, Florida State University, 252 pp., 1988.
Niedermeyer, E. M., Prange, M., Mulitza, M., Mollenhauer, G., Schefuß, E., and Schulz, M.: Ex-tratropical forcing of Sahel aridity during Heinrich stadials, Geophys. Res. Lett., 36, L20707, doi:10.1029/2009GL039687, 2009.
20
Penaud, A., Eynaud, E., Turon, J.-L., Blamart, D., Rossignol, L., Marret, F., Lopez Martinez, C.,
Grimalt, J. O., Malaizé, B., and Charlier, K.: Contrasting paleoceanographic conditions off
Morocco during Heinrich events (1 and 2) and the Last Glacial Maximum, Quaternary Sci. Rev., 29, 1923–1939, 2010.
Plisnier, P. D., Serneels, S., and Lambin, E. F.: Impact of ENSO on East African ecosystems: 25
a multivariate analysis based on climate and remote sensing data, Global Ecol. Biogeogr., 9, 481–497, 2000.
Prange, M., Steph, S., Schulz, M., and Keigwin, D.: Inferring moisture transport across Central America: can modern analogs of climate variability help reconcile paleosalinity records?, Quaternary Sci. Rev., 29, 1317–1321, 2010.
30
CPD
10, 3931–3964, 2014Northern Hemisphere control of deglacial vegetation changes in the Rufiji uplands
(Tanzania)
I. Bouimetarhan et al.
Title Page
Abstract Introduction
Conclusions References
Tables Figures
◭ ◮
◭ ◮
Back Close
Full Screen / Esc
Printer-friendly Version
Interactive Discussion
Discussion
P
a
per
|
Discus
sion
P
a
per
|
Discussion
P
a
per
|
Discussion
P
a
per
|
Reimer, P .J., Baillie, M.G. L., Bard, E., Bayliss, A., Beck, J .W., Blackwell, P .G., Bronk Ramsey, C., Buck, C. E., Burr, G. S., Edwards, R. L., Friedrich, M., Grootes, P. M., Guilderson, T. P., Hajdas, I., Heaton, T. J., Hogg, A. G., Hughen, K. A., Kaiser, K. F., Kromer, B., McCormac, F. G., Manning, S. W., Reimer, R. W., Richards, D. A., Southon, J. R., Talamo, S., Turney, C. S. M., van der Plicht, J., and Weyhenmeyer, C. E.: IntCal09 and Marine09 radiocarbon age 5
calibration curves, 0–50 000 years cal BP, Radiocarbon, 51, 1111–1150, 2009.
Rohling, E. J., Grant, K., Bolshaw, M., Roberts, A. P., Siddal, M., Hemleben, C., and Kucera, M.: Antarctic temperature and global sea level closely coupled over the past five glacial cycle, Nat. Geosci., 2, 500–504, 2009.
Romahn, S., Mackensen, A., Groeneveld, J., and Pätzold, J.: Deglacial intermediate water re-10
organization: new evidence from the Indian Ocean, Clim. Past, 10, 293–303, doi:10.5194/cp-10-293-2014, 2014.
Saji, N. H. and Yagamata, T.: Possible impacts of Indian Ocean Dipole mode events on global climate, Clim. Res., 25, 151–169, 2003.
Savoye, B., Ridderinkhof, H., Pätzold, J., and Schneider, R.: Western Indian Ocean climate 15
and sedimentation, cruise No M75, 29 December 2007–8 April 2008, Port Louis (Mauritius)– Cape Town (South Africa), Meteorol. Berichte, 2013.
Schefuß, E., Schouten, S., and Schneider, R. R.: Climatic controls on central African hydrology during the past 20 000 years, Nature, 437, 1003–1006, 2005.
Schefuß, E., Kuhlmann, H., Mollenhauer, G., Prange, M., and Pätzold, J.: Forcing of wet phases 20
in southeast Africa over the past 17 000 years, Nature, 480, 509–512, 2011.
Sokile, C. S., Kashaigili, J. J., and Kadigi, R. M. J.: Towards an integrated water resource management in Tanzania: the role of appropriate institutional framework in Rufiji Basin, Phys. Chem. Earth, 28, 1015–1023, 2003.
Southon, J., Kashgarian, M., Fontugne, M., Metivier, B., and Yim, W. W.-S.: Marine reservoir 25
corrections for the Indian Ocean and Southeast Asia, Radiocarbon, 44, 167–180, 2002. Stager, J. C., Ryves, D. B., Chase, B. M., and Pausata, F. S. R.: Catastrophic drought in the
Afro-Asian Monsoon Region during Heinrich Event 1, Science, 331, 1299–1302, 2011. Stanford, J. D., Rohling, E. J., Bacon, S., Roberts, A. P., Grousset, F. E., and Bolshaw, M.:
A new concept for the paleoceanographic evolution of Heinrich event 1 in the North Atlantic, 30
Quaternary Sci. Rev., 30, 1047–1066, 2011.
Stouffer, R. J., Yin, J., Gregory, J. M., Dixon, K. W., Spelman, M. J., Hurlin, W., Weaver, A. J.,
CPD
10, 3931–3964, 2014Northern Hemisphere control of deglacial vegetation changes in the Rufiji uplands
(Tanzania)
I. Bouimetarhan et al.
Title Page
Abstract Introduction
Conclusions References
Tables Figures
◭ ◮
◭ ◮
Back Close
Full Screen / Esc
Printer-friendly Version
Interactive Discussion
Discussion
P
a
per
|
Discus
sion
P
a
per
|
Discussion
P
a
per
|
Discussion
P
a
per
|
Montoya, M., Murakami, S., Nawrath, S., Oka, A., Peltier, W. R., Robitaille, D. Y., Sokolov, A., Vettoretti, G., and Weber, S. L.: Investigating the cause of the response of the thermohaline circulation to past and future climate change, J. Climate, 19, 1365–1387, 2006.
Street-Perrott, F. A. and Perrott, R. A.: Abrupt climate fluctuations in the tropics: the influence of Atlantic Ocean Circulation, Nature, 343, 607–611, 1990.
5
Street-Perrott, F. A., Huang, Y., Perrot, R. A., Eglinton, G., Barker, P., Khelifa, L. B., Harkness, D.,
and Olago, D.: Impact of lower atmospheric CO2on tropical mountain ecosystems, Science,
278, 1422–1426, 1997.
Stuiver, M. and Reimer, P. J.: Extended14C data base and revised CALIB 3.014C age calibration
program, in: Calibration 1993, edited by: Stuiver, M., Long, A., and Kra, R. S., Radiocarbon, 10
35, 215–230, 1993.
Stuiver, M., Reimer, P. J., and Braziunas, T. F.: High-precision radiocarbon age calibration for terrestrial and marine samples, Radiocarbon, 40, 1127–1151, 1998.
Stuiver, M., Reimer, P. J., and Reimer, R. W.: CALIB 5.0. (WWW program and documentation), 2005.
15
Temple, P. H. and Sundborg, A.: The Rufiji River, Tanzania hydrology and sediment transport, Geografiska Annular, Series A, studies of soil erosion and sedimentation in Tanzania, Phys. Geogr., 54, 345–368, 1972.
Tierney, J. E. and deMenocal, P. B.: Abrupt shifts in Horn of Africa hydroclimate since the Last Glacial Maximum, Science, 342, 843–846, 2013.
20
Tierney, J. E., Russel, J. M., Huang, Y., Sinninghe Damsté, J. S., Hopmans, E. C., and Co-hen, A. S.: Northern Hemisphere controls on tropical southeast African climate during the past 60 000 years, Science, 322, 252–255, 2008.
Tierney, J. E., Smerdon, J. E., Anchukaitis, K. J., and Seager, R.: Multidecadal variability in East African hydroclimate controlled by the Indian Ocean, Nature, 493, 389–392, 2013. 25
Tjallingii, R., Claussen, M., Stuut, J. B., Fohlmeister, J., Jahn, A., Bickert, T., Lamy, F., and Röhl, U.: Coherent high- and low-latitude control of the northwest African hydrological bal-ance, Nat. Geosci., 1, 670–675, 2008.
Verschuren, D., Sinninghe Damsté, J. S., Moernaut, J., Kirsten, I., Blaauw, M., Fagot, M., and Haug, G.: Half-precessional dynamics of monsoon rainfall near the East African Equator, 30
Nature, 462, 637–641, 2009.
CPD
10, 3931–3964, 2014Northern Hemisphere control of deglacial vegetation changes in the Rufiji uplands
(Tanzania)
I. Bouimetarhan et al.
Title Page
Abstract Introduction
Conclusions References
Tables Figures
◭ ◮
◭ ◮
Back Close
Full Screen / Esc
Printer-friendly Version
Interactive Discussion
Discussion
P
a
per
|
Discus
sion
P
a
per
|
Discussion
P
a
per
|
Discussion
P
a
per
|
Vincens, A., Buchet, G., Williamson, D., and Taieb, M.: A 23 000 yr pollen record from Lake
Rukwa (8◦S, SW Tanzania): new data on vegetation dynamics and climate in Central Eastern
Africa, Rev. Palaeobot. Palyno., 137, 147–162, 2005.
Vincens, A., Lézine, A. M., Buchet, G., Lewden, D., Le Thomas, A., Agwu, C. O. C., Azéma, C., Ballouche, A., Baxter, A., Bengo, M. D., Beuning, K., Bolick, M. R., Bonnefille, R., Bous-5
man, C. B., Buchet, N., Burney, D. A., Caratini, C., Carrion, J. S., Cazet, J.-P., Cohen, J., Cooresman, B., Cour, P., Denèfle, M., Dupont, L., Duzer, D., Edorh, T., El Ghazali, G. E. B., El Moslimany, A. P., El Moutaki, S., Elenga, H., Guinet, Ph., Hamilton, A. C., Hedberg, O., Hooghiemstra, H., Irving, S. J. E., Jahns, S., Jolly, D., Kadomura, H., Kendall, R. L., Lamb, H. F., Laseski, R. A., Leroy, S., Livingstone, D. A., Magioncalda, R., Maley, J., Marchant, 10
R., Marret, F., Matsumoto, K., Meadows, M., Mercuri, A. M., Mohammed Umer Mohammed, Morrison, M. E. S., Moscol-Olivera, M. C., Nakimera-Ssemmanda, I., Ntaganda, C., Nyakale, M., Osadtchy, C., Perrott, R. A., Pons, A., Quézel, P., Reynaud-Farrera, I., Riollet, G., Ritchie, J. C., Roche, E., Rucina, S. M., Salzmann, U., Schulz, E., Scott, L., Shi, N., Soulet, G., Sowunmi, M. A., Straka, H., Sugden, J. M., Taylor, D., Tissot, C., Van Campo, E., Van Campo, 15
M., Van Zinderen Bakker, E. M., Vilimumbalo, S., Waller, M. P., Watrin, J., and Ybert, J.-P.: African pollen data base inventory of tree and shrub pollen types, Rev. Palaeobot. Palyno., 145, 135–41, 2007a.
Vincens, A., Garcin, Y., and Buchet, G.: Influence of rainfall seasonality on African lowland vegetation during the late Quaternary: pollen evidence from Lake Masoko, Tanzania, J. Bio-20
geogr., 34, 1274–1288, 2007b.
Waelbroeck, C., Labeyrie, L., Michel, E., Duplessy, J. C., McManus, J. F., Lambeck, K., Bal-bon, E., and Labracherie, M.: Sea-level and deep water temperature changes derived from benthic foraminifera isotopic records, Quaternary Sci. Rev., 21, 295–305, 2002.
Walter, H. and Lieth, H.: Klimadiagramm-Weltatlas, Fisher, Jena, 1960–1967. 25
White, F.: The vegetation of Africa – a descriptive memoir to accompany the UN-ESCO/AETFAT/UNSO vegetation map of Africa, UNESCO, Paris, 384 pp., 1983.
Woodroffe, C. D.: Response of mangrove shorelines to sea-level change, Tropics, 8, 159–177,
1999.
Woodroffe, S. A. and Horton, B. P.: Holocene sea-level changes in the Indo-Pacific, J. Asian
30
CPD
10, 3931–3964, 2014Northern Hemisphere control of deglacial vegetation changes in the Rufiji uplands
(Tanzania)
I. Bouimetarhan et al.
Title Page
Abstract Introduction
Conclusions References
Tables Figures
◭ ◮
◭ ◮
Back Close
Full Screen / Esc
Printer-friendly Version
Interactive Discussion
Discussion
P
a
per
|
Discus
sion
P
a
per
|
Discussion
P
a
per
|
Discussion
P
a
per
|
Wu, H., Guiot, J., Brewer, S., and Guo, Z.: Climatic changes in Eurasia and Africa at the last glacial maximum and mid-Holocene: reconstruction from pollen data using inverse vegetation modeling, Clim. Dynam., 29, 211–229, 2007.
Zhao, M., Eglinton, G., Haslett, R. W., Jordan, R. W., Sarnthein, M., and Zhang, Z.: Marine and
terrestrial biomarker records for the last 35 000 years at ODP site 658C offNW Africa, Org.
5
CPD
10, 3931–3964, 2014Northern Hemisphere control of deglacial vegetation changes in the Rufiji uplands
(Tanzania)
I. Bouimetarhan et al.
Title Page
Abstract Introduction
Conclusions References
Tables Figures
◭ ◮
◭ ◮
Back Close
Full Screen / Esc
Printer-friendly Version
Interactive Discussion
Discussion
P
a
per
|
Discus
sion
P
a
per
|
Discussion
P
a
per
|
Discussion
P
a
per
|
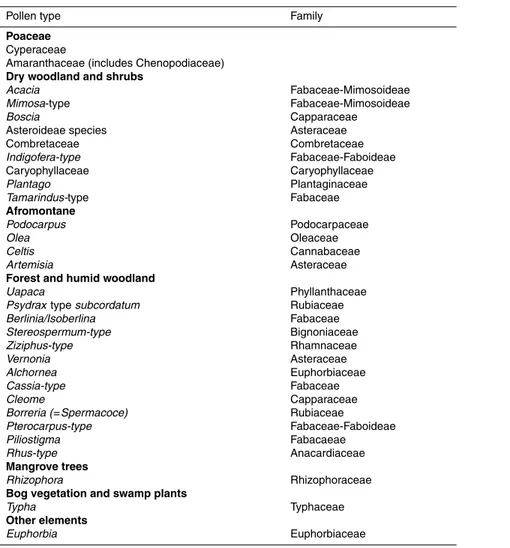
Table 1.List of identified pollen taxa in marine core GeoB 12624-1. Taxa are grouped according
to their phytogeographical assignement.
Pollen type Family
Poaceae
Cyperaceae
Amaranthaceae (includes Chenopodiaceae)
Dry woodland and shrubs
Acacia
Mimosa-type
Boscia
Asteroideae species Combretaceae Indigofera-type Caryophyllaceae Plantago
Tamarindus-type
Fabaceae-Mimosoideae Fabaceae-Mimosoideae Capparaceae
Asteraceae Combretaceae Fabaceae-Faboideae Caryophyllaceae Plantaginaceae Fabaceae
Afromontane
Podocarpus Olea Celtis Artemisia
Podocarpaceae Oleaceae Cannabaceae Asteraceae
Forest and humid woodland
Uapaca
Psydraxtypesubcordatum
Berlinia/Isoberlina Stereospermum-type Ziziphus-type Vernonia Alchornea Cassia-type Cleome
Borreria (=Spermacoce)
Pterocarpus-type Piliostigma Rhus-type
Phyllanthaceae Rubiaceae Fabaceae Bignoniaceae Rhamnaceae Asteraceae Euphorbiaceae Fabaceae Capparaceae Rubiaceae
Fabaceae-Faboideae Fabacaeae Anacardiaceae
Mangrove trees
Rhizophora Rhizophoraceae
Bog vegetation and swamp plants
Typha Typhaceae
Other elements