Abstract— The aim of this paper is to review a published
paper, ‘Using computer software packages to enhance the teaching of Engineering Management Science: Part 1 –Critical path networks’. Excel in Microsoft Office 2007 was discovered to be able to solve critical path network problems with some programming. The capabilities of the two previously evaluated packages, Microsoft Project
2007 and Quantitative Methods – Production and Operations Management (POM-QM) for Windows 3 were
tested together with Excel against each of the objective of the module, critical path networks. A pseudo quantity scoring system was developed to evaluate the capabilities of the software packages in meeting the objectives of the module. It was found that POM-QM scored the highest points. However, Excel can be argued to provide the best learning outcomes as it endeavours students to understand the concepts of critical path networks clearly before they can program and solve the problems.
Index Terms— Critical path networks engineering management science, Microsoft Project 2007, and Quantitative Methods – Production and Operations Management (POM-QM) for Windows 3
I. INTRODUCTION
N the paper, ‘Using computer software packages to enhance the teaching of Engineering Management Science: Part 1 –Critical path networks’, it was concluded that the application of software packages in Engineering
Management Science is a ‘must’. For critical path
networks, more than one package will be required; different
packages will be required on different parts of the problem and no one package can satisfy the needs for beginners [1]. In the previous paper, it was found that both can be used to draw the CPA network diagrams but none of them is perfect as they can only draw them in activity-on-node. Only
POM-QM for Windows 3 can be used to evaluate the earliest
start, earliest finish, latest start and latest finish times, and calculate the total float for all activities and present them in a table form; this still cannot satisfy all the requirements of objectives 3 and 4 of the modules as listed in Table 1 because the package cannot evaluate the free float and independent float [1]. For costing and crashing, POM-QM
for Windows 3 is more suitable for the course as the package
can solve the costing and crashing at activity level. In
Manuscript received April 01, 2011; revised May 27, 2011.
Harry s Ku is with the Faculty of Engineering and Surveying, University of Southern Queensland, Toowoomba, 4350, Australia (corresponding author’s phone: 61-7-4631-2919; fax: 61-7-4631-2526; e-mail: ku@ usq.edu.au).
drawing Gantt chart and showing the critical path in the chart, POM-QM for Windows 3 is more suitable as it is simpler to use. However, only MS Project 2007 can perform resource leveling, which is a very important element in critical path networks in practice. On the other hand, only POM-QM for Windows 3 can be used to evaluate the probabilistic networks. It appears that POM-QM for
Windows 3 is a better software for this module [1].
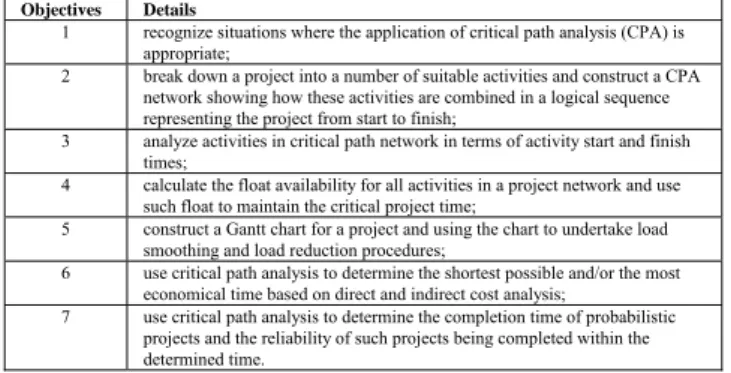
Table 1: Objectives of the module, critical path networks
In the last paper, a pseudo quantity evaluation method was employed, in which scores were allocated to each package when they satisfied a particular objective of the module. Score of 0 to 10 were awarded to each package for satisfying a particular objective, 10 being the highest and the package with highest total scores was considered to be more suitable software for the module. As the total scores
for POM-QM for Windows 3 (49) is higher than MS Project
2007 (27), the former is therefore considered to be the more
suitable package for the module [1].
In this paper, Excel in MS Office 2007 will be tried in all objectives of the module, critical path networks. Each time, when Excel is tested for suitability of a particular objective of the module, the capabilities of the two previously used packages on the same objective will also be cited and discussed. Finally, a pseudo-quantitative score system will again be employed to evaluate the three packages to determine which one is the best for the module.
II. EXCEL IN OBJECTIVE 1
Neither Excel, nor the other two packages can be used to recognize situations where the application of critical path analysis (CPA) is appropriate. Students have to decide the above case by themselves without the help of any package.
III. EXCEL IN OBJECTIVE 2
Figure 1 shows the POM-QM for Windows 3 inputs for a project (used in previous paper) with activities, their duration and precedence, for constructing a critical path network. Excel cannot construct a CPA network showing
Review on Using Packages to Enhance the
Teaching of Critical Path Networks
Harry S Ku
I
Objectives Details
1 recognize situations where the application of critical path analysis (CPA) is appropriate;
2 break down a project into a number of suitable activities and construct a CPA network showing how these activities are combined in a logical sequence representing the project from start to finish;
3 analyze activities in critical path network in terms of activity start and finish times;
4 calculate the float availability for all activities in a project network and use such float to maintain the critical project time;
5 construct a Gantt chart for a project and using the chart to undertake load smoothing and load reduction procedures;
6 use critical path analysis to determine the shortest possible and/or the most economical time based on direct and indirect cost analysis;
Figure 1: A project with activities, their duration and precedence
how these activities are combined in a logical sequence representing the project from start to finish. This has to be done manually from information provided in Figure 1 and this is depicted in Figure 2. On the other hand, POM-QM
for Windows 3 can generate a network diagram as depicted
in Figure 3 from inputs shown in Figure 1; the critical path of the network will also be generated at the same time. With inputs as depicted in the left part of Figure 4, MS
Project will generate a network diagram with critical path
for the project.
Figure 2: The network, its activities and durations
Figure 3: A network diagram with critical path shown using POM-QM for Windows 3
Figure 4: Input for network diagram and Gantt chart drawn by Microsoft Project standard 2007
IV. EXCEL IN OBJECTIVE 3
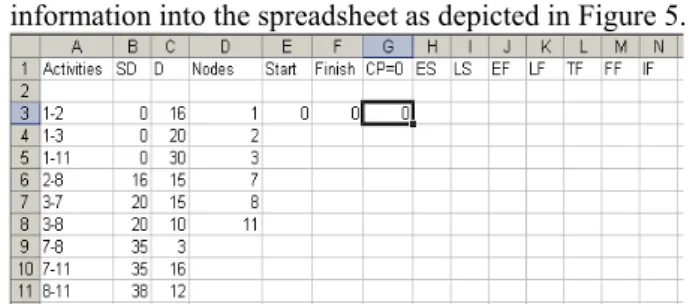
Excel can analyze activities in critical path networks in terms of activity start and finish times by inputting the information into the spreadsheet as depicted in Figure 5.
Figure 5: Inputs to Excel for evaluating node start and finish times
Start time for ‘node 2’ is calculated by referring to the
network diagram of the project and adding the duration of ‘activity 1-2’ to start time of ‘node 1’, i.e. 16 + 0 = 16 or inputting ‘=E3+C3’ into cell E4 as depicted in Figure 5. Similarly, start time for ‘node 3’ is calculated by adding the duration of ‘activity 1-3’ to start time of ‘node 1’, i.e. 20 + 0 = 20 or inputting ‘=E3+C4’ into cell E5. However, start time for ‘node 7’ is calculated by adding the duration of ‘activity 3-7’ to start time of ‘node 3’, i.e. 15 + 20 = 35 or inputting ‘=E5+C7’ into cell E6. The start time of ‘node 8’ is more complicated to evaluate because three activities, ‘2-8’, ‘3-7’ and ‘7-8’ terminate in ‘node 8’. It has to be achieved by entering ‘=MAX(E4+C6,E5+C8,E6+C9)’ into cell E7. This is the equivalent of evaluating it manually using forward pass method. Similarly, start time of ‘node 11’ is evaluated by inputting ‘=MAX(E3+C5,E6+C10,E7+C11)’ into cell E8 [2]. All start and finish times for all nodes are shown in Figure 6; finish times will be worked out in the next paragraph.
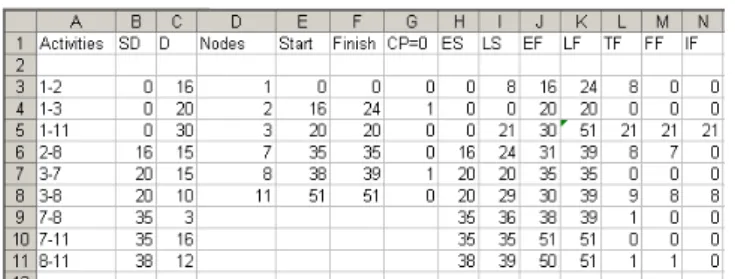
Figure 6: Nodes start and finish times and critical nodes (highlighted)
Finish time for ‘node 11’ is the start time of it, i.e. 51. This is the equivalent of evaluating it manually using backward pass method. Finish time for ‘node 8’, is calculated by taking the duration of ‘activity 8-11’ from finish time of ‘node 11’, i.e. 51 – 12 = 39 or inputting ‘ =F8-C11’ in cell F7. However, finish time of ‘node 7’ is more complicated because two activities, ‘7-11’ and ‘7 – 8’ come out from it. It has to be achieved by entering ‘ =MIN(F8-C10,F7-C9)’ into cell F6. Similarly, finish time of ‘node 3’ is evaluated by inputting ‘=MIN(F6-C7,F7-C8)’ into cell F5. Finish time of ‘node 2’ is calculated by taking the duration of ‘activity 2-8’ from finish time of ‘node 8’, i.e. 39 – 15 = 24 or inputting ‘=F7-C6’ into cell F4 [2].
‘=IF(F3-E3=0,0,1)’ in cell G2 and copy it through cells G3 through G8. Critical nodes are illustrated and highlighted in Figure 6 [2]. The critical path is therefore 1-3-7-11, i.e. lines joining the critical nodes are the critical path.
V. EXCEL IN OBJECTIVE 4
Excel can calculate the float availability for all activities in a project network and use such float to maintain the critical project time. To evaluate earliest start, latest start, earliest finish and latest finish of activities, it is necessary to refer to Figure 7. Earliest start of ‘activity 1- 2’ is achieved by entering ‘=E3’ i.e. start time of ‘node 1’ into cell H3; it is zero. Latest start of ‘activity 1 -2 ‘is achieved by inputting ‘=F4-C3’, i.e. finish time of ‘node 2’ minus duration of ‘activity 1 -2’ into cell I3, i.e. 24 – 16 = 8. The evaluation has to refer to Figure 8. Earliest finish of ‘activity 1 – 2’ is calculated by entering ‘=H3+C3’, i.e. adding earliest start of ‘activity 1 -2’ to its duration, 0 + 8 = 8 into cell J3. Latest finish of ‘activity 1- 2’ is achieved by inputting ‘=F4’, i.e. finish time of ‘node 2’ into cell K3; it is 24. The earliest start, latest start, earliest finish and latest finish of a particular activity can be achieved by manipulating the durations of the activity and the start and finish times of the relevant nodes as demonstrated in the previous sentences. In all cases, it is necessary to refer to Figure 7. The earliest start, latest start, earliest finish and latest finish of all activities are shown in Figure 8 [2].
Figure 7: Network with critical path drawn
Figure 8: Earliest start, latest start, earliest finish and latest finish of all activities
The final step is to evaluate the floats, starting with total
float of ‘activity 1 – 2’. This is achieved by entering ‘ =F4-E3-C3’, i.e. finish time of ‘node 2’ minus start time of ‘node 1’ minus the duration of ‘activity 1 – 2’ or 24 – 0 – 16 = 8 into cell L3. This has to be done by referring to Figure 7. Free float of ‘activity 1 – 2’ is achieved by inputting ‘=E4-E3-C3’, i.e. start time of ‘node 2’ minus start time of ‘node
1’ minus the duration of ‘activity 1 – 2’ or 16 – 0 – 16 = 0 into cell M3. Similarly, this has to be done by referring to Figure 7. The independent float of the same activity is
achieved by inputting ‘=IF(E4-F3-C3<=0,0)’, i.e. start time of ‘node 2’ minus finish time of ‘node 1’ minus the duration of the activity or 16 – 0 – 16 = 0 into cell N3. The ‘IF’ in cell N3 is to ensure that negative value becomes zero. This has also been done by referring to Figure 7. Similarly, the floats of a particular activity can be achieved by manipulating the durations of the activity and the start and finish times of the relevant nodes as demonstrated in the previous sentences. The total float, free float and independent float of all activities are shown in Figure 9.
Figure 9: Total float, free float and independent float of all activities
With the same input in Figure 1, POM-QM for Windows 3
can generate start and finish times of nodes, earliest start, latest start, earliest finish and latest finish of activities and total float, free float and independent float of all activities in one click and is illustrated in Figure 10 [1].
Figure 10: Start and finish times of nodes, earliest start, latest start, earliest finish and latest finish of activities and total float, free float and independent float of all activities
MS Project is also able to evaluate the earliest start, earliest finish, latest start and latest finish times, and total float (slack), free float of the activities of a network and list them in a table. However, the procedures required to do so are tedious and it is not suitable for beginners [1].
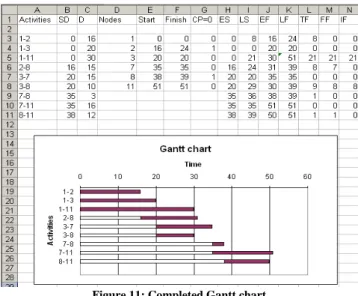
VI. EXCEL IN OBJECTIVE 5
times of each activity. Since, one is not interested in the number of days from day 0 until the start of an activity, one wants to make the first section of each bar invisible. This is achieved by double-clicking on the first part of any bar; this should bring up the Patterns dialog box for the first data series. In the Pattern portions, set the colour to white. Click
O.K. To change the background to white, click the grey background. Click Format Plot Area. When the Patterns dialog box appears, set the colour to white. Click O.K. To reverse the vertical axis, select the vertical axis and choose the Scale command. In the dialog box, select the check box labeled Categories in Reverse Order, and then click O.K. The Gantt chart is complete and is depicted in Figure 11 [2].
Figure 11: Completed Gantt chart
With the same input in Figure 1, POM-QM for Windows 3
can generate overlapping Gant charts with earliest start and finish as well as latest start and finish as depicted in Figure 12. The floats are on the overlapping parts. Users would be able to recognize the possible movement of the activities to level resources either manually or using software packages. With inputs as depicted in the left part of Figure 4, MS
Project will generate a Gantt chart for the project is as
illustrated in right hand side of Figure 4 [1].
Figure 12: Overlapping Gantt charts using POM-QM for Windows 3
VII. EXCEL IN OBJECTIVE 6
Excel can use critical path analysis to determine the
shortest possible and/or the most economical time based on direct and indirect cost analysis. To illustrate crashing a project using Excel, the same crashing data employed in the previous paper will be used [1]. The network of the data is the same one discussed in this paper. Figure 13 shows the inputs required for crashing the network using POM-QM for Windows 3. The same inputs for Excel are depicted in Figure 14. At the top of the
Figure 13: Inputs required for crashing using POM-QM for Windows 3
Figure 14: Inputs required for crashing using Excel
spreadsheet the specified deadline is entered in cell B1 and the total cost of completing the project including both normal cost and crash cost is calculated in cell B2. Below this column, columns A to G contain the information for the calculation. Note that in column G, the crash cost per day is calculated by dividing the incremental cost of crashing the activity as much as possible by the maximum number of days the activity can be shortened [3].
In column H, the maximum amount each activity can be crashed is calculated by subtracting the crash duration from the normal duration. Column I corresponds to how much to crash each activity. Then based on the values input in column I, the cost of crashing each activity is calculated in column J. Finally, in column K, the actual time to complete the activity is calculated by subtracting the amount the activity is crashed (column I) from the activity’s normal duration (column C) [3].
In cells A19:B23, another table was created to keep track of the event times of each node in the network diagram shown in Figure 2. Node 1 is excluded because it is assumed that this node occurs at time zero. This is to ensure that the precedence relationships in the network diagram are not violated. Excel’s Solver can be used to determine which activities to crash so that the entire project is completed within 47 days at the minimum costs. To begin, select
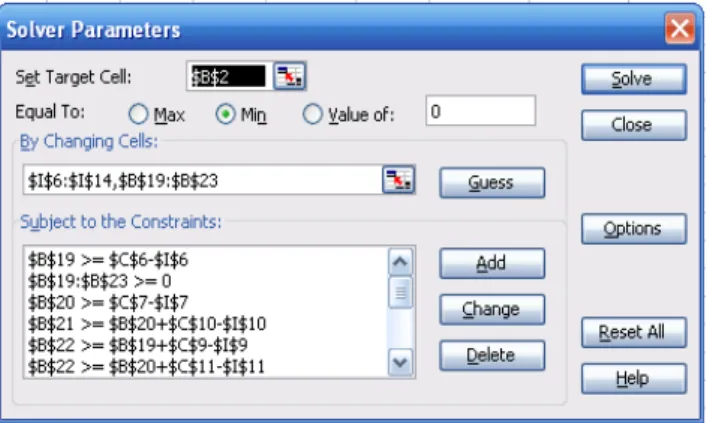
Tools from the menu bar and then Solver from the next menu that appears. The Solver Parameter dialog box is now displayed in Figure 15 [3].
Figure 15: Excel’s Solver loaded with date and constraints from crash problem
To specify this, B2 is entered in the Set Target Cell field and then select the Min ratio button [3].
The next step is to tell Excel what cells it can change in order to find the solution with the minimum total project completion cost. In Figure 14, the values or cells that can be changed are the amount of time each activity is crashed (cells I6:I14) and the time when each event occurs (cells B19:B23). Thus as is shown in Figure 15, these ranges were entered in the By Changing Cells field [3].
The final type of information required is the limitations or constraints associated with the situation. Perhaps, the most obvious constraint is that the project has to be completed in 47 days (cell B1). Since node 11 (cell B 23) corresponds to the event of the project being completed, it is necessary to specify this constraint as follows [3]:
B23 ≤ B1
Another important set of constraints is needed to make sure an activity is not crashed more than the maximum number of days that it can be crashed. Constraints to ensure this could be entered as follows [3]:
I6:I14 ≤ H6:H14
Another set of constraints is needed to ensure that the precedence relationships specified in the network diagram are not violated. This is done by keeping track of the event times of the nodes. For example, the event time of node 2 cannot occur until after activity 1-2 has been completed. The time to complete activity 1-2 is its normal time less the amount of time it is crashed. Sincecell B19 corresponds to the event time of node 2, mathematically the constraint can be entered as follows [3]:
B19 ≥ C6 – I6
Constraints for the other nodes could be created in a similar fashion. For examples the constraints for nodes 3 and 7would respectively be
B20 ≥ C7 – I7 B21 ≥ B20 + C10 – I 10 Moving on to node 8, this node has three arrows pointing to it. A node with more than one arrow pointing to it will need a separate constraint for each arrow. Three constraints are required for node 8 [3]
B22 ≥ B19 + C9 – I9
B22 ≥ B20 + C11 – I11 B22 ≥ B21 + C12 – I12
Node 11 is handled in a similar way to node 8 as follows [3]:
B23 ≥ B21 + C13 - I 13 B23 ≥ B22 + C14 – I 14 B23 ≥ C8 – I8
Finally, since it does not make sense to crash an activity a negative amount of time, nor does it make sense for a node to occur at a time less than time zero, constraints are added
to ensure these outcomes are not generated. The constraints can be specified as follows [3]:
I6:I14 ≥ 0 B19:B23 ≥ 0 After entering these constraints, the Solver Parameters dialog box appears as shown in Figure 15. Before finding the least costly way to crash the project down to 47 days, select the Options ...button and click on the Assume Linear Model check box and then click OK. Now to find the least cost solution, select the Solve button in the Solver Parameters dialog box. Figure 16 shows the solution, deadline 47 days (cell B1) and total cost 6100 (cell B2) [3].
Figure 16: Excel Spreadsheet for crash problem, 47-Day Solution and Cost
With the inputs as in Figure 13, POM-QM for Windows 3
can generate crashing results as depicted in Figure 17. MS
Project 2007 will be able to do this on individual resource
level but not on the activity level. This is regarded as difficult for beginners [1].
Figure 17:Crashing results using POM-QM for Windows 3 VIII. DISCUSSIONS
In order to decide which software package is better for the module, a pseudo quantity evaluation method is employed, in which scores are allocated to each package when it satisfies a particular objective of the topic. Score of 0 to 10 will be awarded to each package for satisfying a particular objective, 10 being the highest and the package with highest total scores is considered to be more suitable software for the module.
For constructing network diagram (objective 2), Excel
meet the desired outcome as learners can draw the CPA network diagram.
Excel can be used to evaluate the earliest start, earliest
finish, latest start and latest finish times (objective 3), and calculate the total, free and independent floats (objective 4) for all activities and present them in a table as depicted in Figure 9. The programming techniques required is not too difficult for engineering students but students must have a very good grasp of the concept of objectives 3 and 4 before they can program the software. This is good in the sense that students have to learn the underlying principles and do not rely on software packages to obtain the results.
POM-QM for Windows 3 can be used to evaluate the earliest start,
earliest finish, latest start and latest finish times, and calculate the total float for all activities and present them in a table. The package, however, was not able to evaluate the free and the independent floats. On the other hand, MS
Project 2007 cannot perform these functions. Only Excel
and POM-QM for Windows 3 can meet the requirements of
objectives 3 and 4 of the topic; this matches the desired outcomes as students can evaluate the earliest start, earliest finish, latest start and latest finish times, and calculate float availability and present them in a table; these are in line with the desired outcomes as learners learn objectives 3 and 4.
In constructing Gantt chart, Excel can perform the work well but some programming technique is required. It can score 5 only because it cannot show critical path in the chart. Both packages, MS Project 2007 and POM-QM for
Windows 3 can create Gantt chart but POM-QM for
Windows 3 can do better because it shows the critical path
in the Gantt chart without requiring further operation. All packages can meet the requirements of objective 5 of the topic; this matches the desired outcomes as students can draw Gantt chart.
In costing and crashing, Excel can do the work very well but the programming technique involved is difficult even for engineering students. Students must have a very good grasp of the concept of objective 6 (crashing) before they can program the package. This is good in the sense that students have to learn the underlying principles and do not rely on software packages to obtain the results. However,
POM-QM for Windows 3 is more suitable for beginners as it will
be able to do crashing on an activity level but may not be so practical for practitioners. MS Project 2007 is more practical as it can compare costs with changing inputs like normal and overtime hourly rates. It can cope with change at resource level and is nearer to a real life situation. Both can meet the requirements of objective 6 of the module; this matches the desired outcome as students can evaluate the most economic and/or the shortest possible time based on the information provided. Both packages, MS Project 2007
and POM-QM for Windows 3, can perform the functions but
POM-QM for Windows 3 is better because it shows the
critical path in the Gantt chart without requiring further operation. Again, both packages can satisfy objective 6 of the module; this matches the desired outcome as students can construct Gantt chart quickly and logically.
The addition of three software packages to the topics in the course will certainly improve the academic standing of the course because its contents are now at par with most of international textbooks. Students will also be able to apply what they have learnt from the course to their workplace
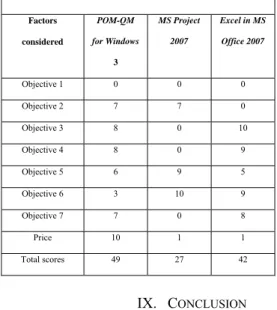
with ease as they will not need to do complicated iterations or calculations. All are done by standard software packages. With reference to Table 3, it can be found that POM-QM
for Windows 3 (49) is still the best package for the module;
Excel (42) comes next but it needs programming. The final
one is MS Project 2007 (27) given that it is relatively expensive and cannot perform some operations required by the seven objectives [1].
Table 3: Scores to the three software packages used
Factors
considered
POM-QM for Windows
3
MS Project 2007
Excel in MS Office 2007
Objective 1 0 0 0
Objective 2 7 7 0
Objective 3 8 0 10
Objective 4 8 0 9
Objective 5 6 9 5
Objective 6 3 10 9
Objective 7 7 0 8
Price 10 1 1
Total scores 49 27 42
IX. CONCLUSION
For critical path networks, more than one package will be
required; different packages will be required on different parts of the problem and no one package can satisfy the needs for beginners. For teaching the objectives of the critical path networks of ENG4004 Engineering Management Science, POM-QM for Windows 3 is the best because it can meet all the objectives of the course except objective one and scores 49 in the comparison table. On the other hand, Excel is a very good package for learning because students cannot use it to meet the objectives of the module unless they have a very good grasp of the concepts of the objectives. MS Project 2007 is an excellent package in practice because of its resource leveling capability, but for teaching it is not as good as the other two packages.
REFERENCES
[1] H. Ku, R. Fulcher, and W. Xiang, “Using computer software packages to enhance the teaching of Engineering Management Science: Part
1critical path networks”, Journal of Computer Applications in Engineering Education, 2010 (published online).
[2] T. Klastorin, Project management: tools and trade-offs, Wiley, 2004, pp. 86 – 103.
[3] S. J. Manter, J. R. Meredith, S. M. Shafer, and M. M. Sutton, Project management in Practice, 3rd ed. John Wiley and Sons, Inc. 2008, pp. 197 – 202.