Abstract—The project management consideration can make the project completed in a short time. To ensure project success, the project management group should identify related issues clearly, decide time needs and expectations, and deal with time needs and expectations. The project management tools that are widely used are Grant chart, milestone, critical path manage-ment (CPM), and project evaluation & review technique (PERT); PERT are regarded as a practical tool to manage large-scale projects. The project networks usually consist of many tasks and corresponding activities, and these tasks have to work in sequence. However, it is very difficult to estimate working hour of each activity precisely in real situation. Hence, this research will aim to develop fuzzy time distribution model for decision-makers in real situation to solve PM decision problems in fuzzy environments. The end of this research used a real case to identify the method for discussing.
Index Terms—Project management, Fuzzy sets, Fuzzy time distribution
I. INTRODUCTION
roject Evaluation and Review Technique is widely used and regarded as a practical tool is managing a large-scale project. In real life, it is very difficult to estimate work-ing hour of each activity precisely. Hence, the traditional PERT model always uses constant or β distribution to esti-mate working time of each activity. We would like to find out a more precise approach to determine the working time of project’s activities.
PERT is an approach to analyze the involved tasks in completing a given project, especially the time needed to complete each task, and to identify the minimum time needed to complete the total project.
Manuscript received Dec 05, 2013.
Ming-Feng Yang is with Department of Transportation Science, National Taiwan Ocean University, No.2, Beining Rd., Jhongjheng District, Keelung City 202, Taiwan, R.O.C. (phone: +886-2-24622192#7011; fax:+886-2-24633745; e-mail: [email protected])
Yan-Ting Chou is with Department of Information Management, Taipei Chengshih University of Science and Technology, No. 2, Xueyuan Rd., Beitou, 112 Taipei, Taiwan, R.O.C. (e-mail: [email protected]) Ming-Cheng Lo (Corresponding Author) is with Department of Business Administration, Chien Hsin University of Science and Technology, No.229, Jianxing Rd., Zhongli City, Taoyuan County 32097, Taiwan, R.O.C. (e-mail: [email protected])
Wei-Chung Tseng is with Department of Transportation Science, National Taiwan Ocean University, No.2, Beining Rd., Jhongjheng District, Keelung City 202, Taiwan, R.O.C. (e-mail: [email protected])
PERT was developed primarily to simplify the planning and scheduling of large and complex projects. It was devel-oped for the U.S. Navy Special Projects Office in 1957 to support the U.S. Navy's Polaris nuclear submarine project. It was able to incorporate uncertainty by making it possible to schedule a project while not knowing precisely the details and durations of all the activities. It is more of an event-oriented technique rather than start- and comple-tion-oriented, and is used more in projects where time is the major factor rather than cost. It is applied to very large-scale, one-time, complex, non-routine infrastructure and Research & Development projects.
E. S. Lee and R.-J. Li [1] presented the order of fuzzy numbers were determined based on the concept of probability measure of fuzzy events. They considered both the mean and dispersion of alternatives and given two groups of indices based on the uniform and the proportional probability dis-tributions. Amir Azaron, Cahit Perkgoz, and Masatoshi Sakawa [2] developed a multi-objective model for the time-cost trade-off problem in PERT networks with gener-alized Erlang distributions of activity durations, using a ge-netic algorithm. They applied a Genetic Algorithm for Numerical Optimizations of Constrained Problems (GENOCOP) to solve multi-objective problem using a goal attainment technique. PERT/cost which is an extension of PERT to include economic considerations brings cost factors into project control decisions. However, PERT/cost is usually developed by project managers without enough experience. Don-Lin Mon, Ching-Hsue Cheng, and Han-Chung Lu [3] proposed a fuzzy PERT/cost that can be applied to a variety of fuzzy distributions of activity durations. Intuitively, the higher the risk level, the more uncertainty in time/cost is involved in the project.
In addition, interactive approaches play an important role in deriving the best preferred compromise solution these years. PM decision-makers such as Arican & Gungor, and Liang [4] have paid attention to modify their mathematical models in membership function of objectives to obtain a set of preferred satisfactory solutions since decision-makers were involved in the solution procedure. Moreover, more and more PM decision problems were considered the total com-pletion time minimized with fuzzy linear membership func-tion.
II. KNOWLEDGE A. Definition and features of PERT.
PERT stands for Program Evaluation and Review nique (also known as Project Evaluation and Review Tech-nique), is an Arrow Diagram Method (ADM), which was developed by the US Navy in 1957. PERT is a statistical tool,
Applying Fuzzy Time Distribution in PERT
Model
M.F. Yang, Y.T. Chou, M.C. Lo, and W.C. Tseng
P
Proceedings of the International MultiConference of Engineers and Computer Scientists 2014 Vol II, IMECS 2014, March 12 - 14, 2014, Hong Kong
ISBN: 978-988-19253-3-6
ISSN: 2078-0958 (Print); ISSN: 2078-0966 (Online)
and these days is widely used in project management for developing the project schedule for very large, complex, and one time projects where usually no historical records are available to be reviewed.
PERT offers a number of advantages to decision-makers. For example, it forces them to organize and quantify project information and provides them with a graphic display of the project. It also helps them to identify which activities are critical to the project completion time and should be in-spected carefully, and which activities involve slack time and can be delayed without affecting the project completion time. But there are also a few limitations of PERT. For example, decision-makers may omit activities when developing the network diagram, they may organize the activities in the wrong order, or they may include a fudge factor in their time estimates for certain activities.
B. Project Network
A project network is a graph depicting the sequence in which a project's terminal elements are to be completed by showing terminal elements and their dependencies. The project network also shows the priority of tasks and corre-sponding activities. The relationships between the various activities will be converted into a network path diagram; it helps the project team members show the project's concrete workflow. The project network diagram, known as a prece-dence diagram, shows the relationships in time and depend-ency of steps needed to complete a project; the project net-work diagram includes precedence diagramming method and arrow diagram method.
C. Network Model
The network model is a database model conceived as a flexible way of representing objects and their relationships. Its distinguishing feature is that the schema, viewed as a graph in which object types are nodes and relationship types are arcs. The steps for build an arbitrary network at any point, first, find one and have not been linked from the nearest point, the two connected. Second, if all nodes have been connected to other nodes, then stop. Final, inspect the priority of objects and their relationships. We also knew that Minimal spanning tree technique can be used to connect each node to determine the minimum total distance.
D. The principles of network draw
Arrow in each node numbers i and j, can not have duplicate and shall meet i> j conditions to facilitate the review on ac-tivities of nuclear and computing. i and j are not limited to the number of the order of consecutive numbers such as 0,1,2,3 ... to be number, can be used, or 2,4,6 ... 1,3,5,7 ... can also be used 0,5,10,15 No. hop label ... and so a better job can be amended at any time convenient for insertion.
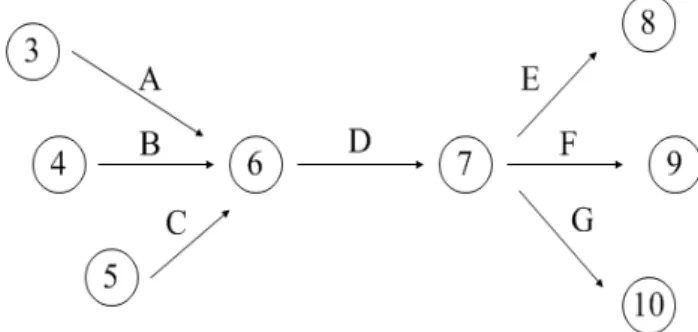
If we would like to draw follow-up activities of a task, we must wait for the task completed and previous activities enter the task. As shown in Figure 1, if we would like to draw activity D, the previous activities A, B and C must enter the task 6, and task 6 must be completed too. In the other hand, when task 7 is completed, that is able to carry out activities E, F and G.
Therefore, unless the entry of a node have completed, oth-erwise the node can not continue further activities or tasks. This is the most important principle of network diagram drawing.
Fig. 1. Principle of performance activities.
III. DEMONSTRATION OF CRASH SUBJECT
According to the property, it is easy to count fuzzy float times in all the activities of network. If float time is zero then activity i will be a critical activity in traditional PERT. This concept implies that the criticality rises as the fuzzy float time decreases. The criticality of this activity is defined as.
, ,
,
(1)
Where CDi is the critical degree of activity i
A, b and c are float time. If b , then CDi is 1
If a b , then CDi is - a /{[(b+c)/2]- a}
If a , then CDi is 0
In a project network, a path, from the initial node to the end node, is consisting of many activities. As determined by the activity criticality, the criticality of an entire path is
πP min CD (2) Where Pk is the k path in the network and π(Pk)is the
criticality of the k path. If path P is critical, then π(P)must satisfy π(P) = maxk{π(Pk)}. An example is presented in this
section to illustrate the proposed method. A project network is given in Figure 2. The activity operation times are ex-pressed as trapezoidal fuzzy numbers as shown in Table I. It was also showed that project network its fuzzy earliest-start time, fuzzy earliest-finish time, fuzzy latest-start time and latest-finish time of each activity in Table I.
Proceedings of the International MultiConference of Engineers and Computer Scientists 2014 Vol II, IMECS 2014, March 12 - 14, 2014, Hong Kong
ISBN: 978-988-19253-3-6
ISSN: 2078-0958 (Print); ISSN: 2078-0966 (Online)
Fig. 2. Project network.
TABLEI
COMPUTATION RESULTS OF PROJECT NETWORK
Tas k Opera-tion time Earli-est-start time (ES) Earli-est-finish time (EF) Lat-est-start time (LS) Lat-est-finish time (LF)
I (0,0,0,0) (0,0,0,0) (0, 0, 0, 0) (-17,0,17, 18)
(-17, 0, 17, 18)
1 (1,4,7,8) (0,0,0,0) (1, 4, 7, 8) (-16,2,20, 21)
(-9, 6, 21, 22)
2 (2,5,8,9) (0,0,0,0) (2, 5, 8, 9) (-17, 0, 17, 18)
(-9, 5, 19, 22)
3 (2,4,6,7) (2,5,8,9) (4, 9, 14, 16) (-9, 6, 21, 22)
(-3, 10, 23, 24)
4 (2,3,5,6) (2,5,8,9) (4, 8, 13, 15) (-8, 6, 20, 21)
(-3, 9, 22, 24)
5 (3,4,6,7) (2,5,8,9) (5, 9, 14, 16) (-9, 5, 19, 22)
(-3, 9, 22, 24)
6 (3,5,8,9) (4,9,14,16) (7, 14, 22, 25)
(-3, 10, 23, 24)
(5, 15, 26, 27)
7 (4,5,7,8) (4,8,13,15) (8, 13, 20, 23)
(-2, 10, 22, 25)
(5, 15, 26, 27)
8 (4,6,8,9) (5,9,14,16) (9, 15, 22, 25) (-3, 9, 22, 24) (5, 15, 26, 27)
9 (3,5,7,9) (9,15,22, 25)
(12, 20, 29, 34)
(5, 15, 26, 27)
(12, 20, 29, 34)
E (0,0,0,0) (12,20,29, 34)
(12, 20, 29, 34)
(12, 20, 29, 34)
(12, 20, 29, 34)
Result demonstration of fixed times and fuzzy times are shown in Table II & III. Figure 3 is the relationship between project time and project cost.
TABLEII
TIME & COST OF PROJECT NETWORK WITH FIXED TIMES
Project path Project
time Additional cost Project cost
34 86000
I-2-5-8-9-E 33 4000 88000
I-2-3-6-9-E 32 2000 89000
I-2-4-7-9-E 31 1000 87000
I-2-4-7-9-E 30 1000 86000
I-2-4-7-9-E 29 2000 86000
I-2-4-7-9-E 28 2000 86000
Project time of project network is reduced to 28 from 34 in Table II. After crash path I-2-5-8-9-E, the project time is reduced to 33 from 34, and the project cost is increased to 88000 from 86000. Decision-makers may obtain the mini-mum project cost 86000 when project path is I-2-4-7-9-E.
TABLEIII
TIME & COST OF PROJECT NETWORK WITH FUZZY TIMES
Project path Project
time Additional cost
Project cost
34 86000
I-2-5-8-9-E 33 1000 85500
I-2-5-8-9-E 32 1000 85000
I-2-3-6-9-E 31 2000 85500
I-2-3-6-9-E 30 2000 86000
I-2-4-7-9-E 29 2000 86500
I-2-4-7-9-E 28 2000 87000
After applying the Fuzzy time distribution, Project time of project network is reduced to 28 from 34 in Table III. After
crash path I-2-5-8-9-E, the project time is reduced to 33 from 34, and the project cost is decrease to 85500 from 86000. Decision-makers may obtain the minimum project cost 85000 when project path is I-2-5-8-9-E.
Fig. 3. The relationship between project time and project cost.
Figure 3 has shown the relationship between project time and project cost. Original project time of project network is 34, and project cost is 86000. After the project network crashed, its project time is reduced to 28 from 34, and min-imum project cost with fixed times and fuzzy times are 86000 and 85000.
IV. CONCLUSIONS
Develop fuzzy time distribution model for decision-maker in actual situation to solve PM decision problems in fuzzy environments. Present a different opinion for decision-maker to make decisions in project management problems. Our proposed approach can really determine the critical value of activity and find out the important path effectively. Compu-tational methodology developed here can easily be extended to any other situations and can handle the realistic PM deci-sions. The main results of this research can be summarized as follows.
Trapezoidal fuzzy numbers were used to represent the ac-tivity durations in a project network. Fuzzy bounds were computed for the start and finish times in each activity. A critical degree index based on the fuzzy float time was de-fined to calculate the critical degree of each activity and path.
Considering the problem of project management in the real life, this research is also devoted on the fuzzy PERT/cost analysis of activity durations. The interval of confidence represent the activity durations, then the critical path of the fuzzy PERT/cost will be obtained.
REFERENCES
[1] E. S. Lee and R.-J. Li, “Comparison of fuzzy numbers based on the probability measure of fuzzy events”, Comput. Math. Applic, vol. 15, no. 10, pp. 887-896, 1988.
[2] Amir Azaron, Cahit Perkgoz, and Masatoshi Sakawa, “A genetic algorithm approach for the time-cost trade-off in PERT networks”, Applied Mathematics and Computation, vol.168, pp. 1317–1339, 2005.
[3] Don-Lin Mon, Ching-Hsue Cheng, and Han-Chung Lu, “Application of fuzzy distributions on project management”, Fuzzy Sets and Sys-tems, vol.73, pp. 227-234, 1995.
[4] Arikan F. and Gungor. Z., An application of fuzzy goal program-ming to a multiobjective project network problem , Fuzzy Sets and Proceedings of the International MultiConference of Engineers and Computer Scientists 2014 Vol II,
IMECS 2014, March 12 - 14, 2014, Hong Kong
ISBN: 978-988-19253-3-6
ISSN: 2078-0958 (Print); ISSN: 2078-0966 (Online)
Systems, 119, 49-58, 2001.
[5] XSS Cheat Sheet, http://ha.ckers.org/xss.html
[6] M.J. Wang and M.F. Yang*,” Application of signed distances method to integrated linear programming for fuzzy multi-objective project management”, International Journal of Innovative Computing In-formation and Control, Vol.6 (2011), No. 11, 5015-5034.
[7] T. F. Liang*, T. S. Huang, and M. F. Yang. Application of fuzzy mathematical programming to imprecise project management deci-sions. Quality and Quantity, Vol. 46, No. 5,P.1451-P.1470. 2012. [8] M.F. Yang* and Y. Lin. ”Applying fuzzy multi-objective linear
programming to project management decisions with the interactive two-phase method” Computers & Industrial Engineering. 66 (4), pp. 1061-1069. 2013.
Proceedings of the International MultiConference of Engineers and Computer Scientists 2014 Vol II, IMECS 2014, March 12 - 14, 2014, Hong Kong
ISBN: 978-988-19253-3-6
ISSN: 2078-0958 (Print); ISSN: 2078-0966 (Online)