determine their suitability in the prediction of urban airflow and pollutant dispersion process. The CFD codes are evaluated against wind tunnel experimental data, and it is observed that LES although more computationally expensive, produces the most accurate and reliable results because it resolves the turbulent mixing process in the flow field. URANS, albeit solving for the transient solution, fails to account for the unsteady fluctuations and hence is not an appropriate replacement for LES.
Index Terms— CFD, air pollution, urban street canyon, RANS, LES
I. INTRODUCTION
IR quality in urban and industrial complexes is of great importance owing to the many implications on human health and environmental concerns. High pedestrian level concentrations are the result of a non-trivial combination of pollutant sources, climate and city layout. The increase of urbanisation puts a strain on urban resources, resulting in increased utilization of transport and a denser and more compact urban fabric. Therefore, it is imperative that new simulation tools are developed and existing techniques are improved in order to assist regulators and urban planners to mitigate air pollution problems in their cities, and to enable emergency authorities to design evacuation plans following natural disasters, accidents or deliberate release of hazardous airborne matter.
At the micro-scale, the Computational Fluid Dynamics (CFD) approach is the preferred way of investigation [1], [2]. Previous CFD investigations on urban airflow and pollution dispersion problems have focused mainly on employing Reynolds-averaged Navier-Stokes (RANS) turbulence closure schemes, which have often been reported to overpredict pollutant levels in comparison to wind tunnel (WT) experimental data. The assumption of steady-state solution in the numerical analyses has been identified as one of the main causes of the discrepancies [3] – [5].
In order to address the short-comings of RANS, Salim et al. [6], [7] compared RANS against Large Eddy Simulation
Manuscript received June 22, 2011.
S. M. Salim is with the School of Engineering, Taylor’s University, Subang Jaya, 47500 Selangor, Malaysia (Phone: 603 – 5629 5263; fax: 603 – 5629 5477; e-mail: [email protected]).
K. C. Ong was a student at the University of Nottingham Malaysia Campus (e-mail: [email protected]).
S. C. Cheah is with the Department of Mechanical, Manufacturing and Materials Engineering, University of Nottingham Malaysia Campus (e-mail: [email protected]).
accounting for the turbulent mixing process that the dispersion of air pollutants depend on. Similar observations were obtained by Tominaga and Stathopoulos in a separate study [8]. A question than arises as to whether unsteady RANS (URANS) would perform equally well, as it solves for the transient solution but at a fraction of the computational cost of LES. This is the objective of the present study, which is to assess the performance between RANS, URANS and LES in the prediction of airflow and pollutant dispersion within urban street canyons.
The simulation of wind and pollutant dispersion within urban street canyons of width to height ratio, W/H=1 are examined using two steady-state RANS models (the standard k-ε and RSM), URANS (based on unsteady RSM) and LES to compare their performance against WT experiments available on the online database CODASC www.codasc.de [9].
The results of the study are not only limited to environmental issues in urban areas, but can be applied to any flow problems where large scale eddies dominate and resolving of transience is paramount to achieve accurate and reliable results.
II. METHODOLOGY
A. Computational Domain and Boundary Conditions
Numerical simulations are performed using FLUENT with the aim of reproducing the experimental works by Gromke and Ruck [10], [11] and available on the online data base www.codasc.de, focusing on the concentration distribution within a street canyon of W/H=1.
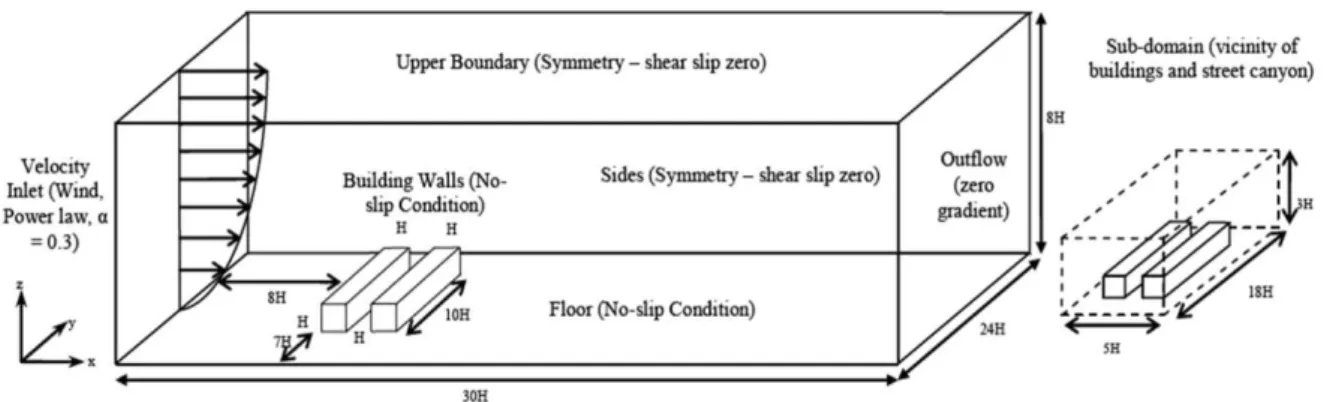
An inlet boundary condition is defined at the entrance. Non-slip conditions are applied for the building walls and floors. Symmetry conditions are specified for the top and lateral sides of the computational domain to enforce a parallel flow. At the face downwind of the obstacles, an outflow boundary condition is imposed to force all the derivatives of the flow variables to vanish. A summary of the computational domain and implemented boundary conditions are illustrated in Fig. 1.
The domain is discretized using hexahedral elements incorporating recommendations based on the wall y+ approach [12]. A mesh with a total cell count of 1.1 million is selected and half of them (i.e. 0.55 million) are placed within the sub-domain as demarcated in Fig. 1, defining the vicinity of the buildings and street canyon where majority of the flow separation, recirculation and reattachment occurs with steep gradients in the flow variables.
Fig. 1. Computational domain and boundary conditions for the CFD simulation setup
In order to replicate the WT experiment, the inlet wind velocity is represented in the power law profile form
(1)
while turbulent kinetic energy and dissipation rate profiles are specified as
√ (2)
and
, (3)
where u is the vertical velocity profile, z the vertical distance, k the kinetic energy profile, the dissipation rate profile, is the boundary layer depth (≈ 0.5 m), u* = 0.54 ms-1 the friction velocity, κthe von Kàrmàn constant (= 0.4) and Cμ = 0.09.
B. Flow Simulation
The steady-state RANS mean solutions are obtained using standard k-ε and RSM turbulence models. 2nd order upwind scheme is selected for the transport equations to minimize numerical diffusion except for pressure, where Standard
interpolation is employed instead. The scaled residual for all flow properties are set at 1 x 10⁻⁵. The RANS equations are ̅̅̅ (4) And ̅ ̅̅̅ ̅ ̅̅̅
̅̅̅̅̅̅̅̅ (5)
For URANS, a non-dimensional time step of 4 x 10⁻² was implemented for the unsteady (i.e. time-advancement) solution. All other settings were maintained as steady-state RANS defined above. The equations are
̅̅̅ (6) And ̅̅̅ ̅ ̅̅̅ ̅ ̅̅̅
̅̅̅̅̅̅̅̅ (7)
In RANS, the flow properties are disintegrated into their mean and fluctuating components and integration over time (i.e. time-averaging) is performed. The difference between RANS and URANS is that an addition unsteady term is present in the URANS momentum equation. Further details of the modeling techniques can be found in the reference texts [13], [14] and FLUENT user manual [15].
In LES, the dynamic Smagorinsky-Lily Sub-grid Scale (SGS) model is chosen. Bounded central differencing scheme for momentum, 2nd order time-advancement and 2nd order upwind for energy and species transport equations are chosen. PRESTO and SIMPLEC are employed for pressure and pressure-velocity coupling, respectively. Convergences at 1 x 10⁻³ for the scaled residual are set. A dimensionless time-step of 2.5 x 10⁻³ was chosen. The LES equations are ̅̅̅ (8) and ̅̅̅ ̅ ̅̅̅ ̅ ̅̅̅ (9) In LES, the over-bar indicates spatial filtering, and not time-averaging as is the case of RANS. It is worth identifying that the filtered (i.e. LES) momentum equation is similar to the RANS equation. The spatial-filtering is an integration just like time-averaging, the difference being that the integration is in space and not over time as in the case of RANS.
All simulations were performed in parallel on an Intel® Xeon® workstation (4 CPU processors).
C. Dispersion Modeling
The advection-diffusion (AD) method present in FLUENT is employed for modeling the dispersion of pollutants species. In turbulent flows it is computed as
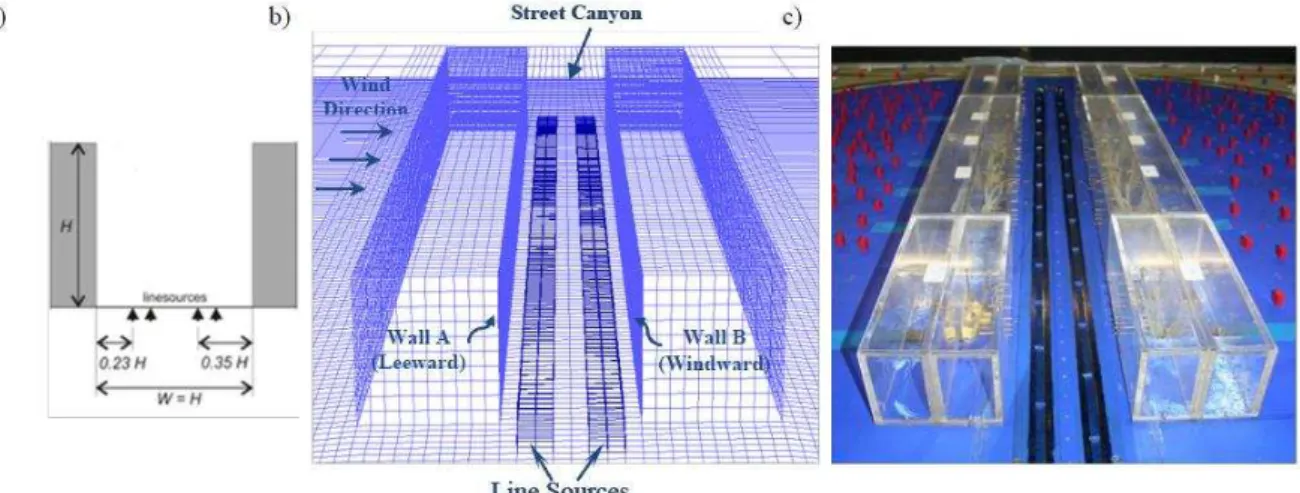
Fig. 2. Position of line sources a) Sketch, b) Computational domain (FLUENT) and c) Wind tunnel (CODASC database)
III. RESULTS AND DISCUSSIONS
A. Steady-state vs. Transient solution (RANS vs. LES)
Numerical results obtained from steady-state RANS and transient LES are first be presented in this section, focusing on the difference between the steady and unsteady solution. This is followed by comparison between URANS and LES in the proceeding section to evaluate the two transient methods. The Reynolds number of the main flow, based on the building height and bulk velocity, is ReH = 50,000. A
time step study was also performed as reported in Salim et al. [6].
Mean normalized concentration contours at the canyons leeward (Wall A) and windward (Wall B) are presented for a street canyon of W/H=1 in Fig. 3. It is observed that LES reproduces the pollutant concentration distribution as predicted by WT experiments better than the two
steady-state RANS turbulence models. This is particularly evident in the vicinity of the centerline (y/H=0) at both walls, where the maximum concentration occurs and is determined to be the most critical zone.
This is further supported in Fig. 4, which demonstrates the quantitative comparison between the two different CFD techniques by presenting the concentration profiles at different vertical locations along both the leeward and windward walls. It is observed that LES not only predicts much better than RANS, but also reproduces much more consistent results. LES predicts well for all locations along the leeward wall and only slightly overpredicts along the windward wall. RANS models (i.e. standard k-ε and RSM), on the other hand have varying degree of accuracies at different locations, overpredicting at some locations and underpredicting at others.
Fig. 4. Mean concentration profiles at different locations along the a) Leeward wall (Wall A) and b) Windward wall (Wall B) comparing the two different numerical approaches against WT
experiments
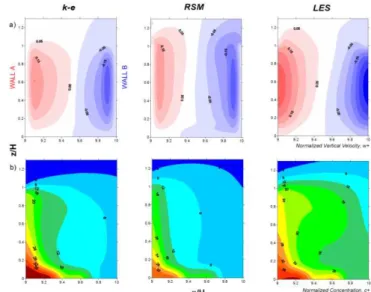
Fig. 5 presents the mean normalized velocities and pollutant concentration contours along the mid-plane (y/H=0) within the street canyon. It can be observed that the RANS models predict an accumulation of SF6 towards the
leeward walls, whereas LES reproduces a better spread. LES achieves this because it resolves the turbulent mixing within the canyon.
Fig. 5. a) Normalized vertical velocity contours and b) Normalized concentration contours comparing ke, RSM and LES
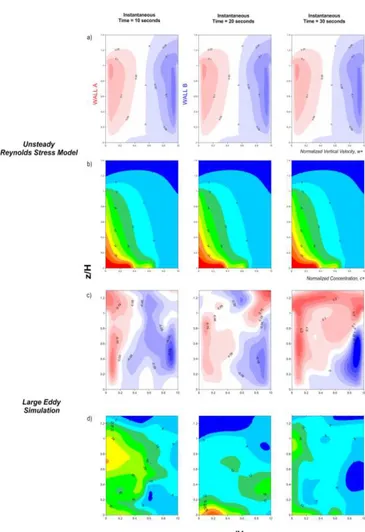
The main reason why transient LES was able to perform better than steady-state RANS in predicting the concentration distribution within the street canyon was its ability to resolve the unsteady fluctuations of the flow field as illustrated in Fig. 6 and Fig. 7 for the wall and mid-plane concentrations and vertical velocity contours, respectively.
The flow variables are shown to vary significantly over time and LES is able to capture pockets of intertwining bubbles of opposing velocities.
Fig. 6. Time-evolution of the normalized concentration along Wall A and Wall B at different times, obtained by LES
account for turbulent mixing.
URANS are only applicable to non-stationary flows such as periodic or quasi-periodic flows involving deterministic structures (for example, they can occasionally predict vortex shedding i.e. largest unsteady scales) and falls most often short of capturing the remaining large scales [15]. This is because they still solve for the mean flow equations but in addition perform ensemble averaging (i.e. realizations of the mean flow over many instances).
LES resolves the fluctuations of the flow variables, which are shown to vary significantly over time thus capturing the transient mixing which is important in order to accurately predict pollutant dispersion.
IV. CONCLUSION
Three different CFD techniques, namely steady-state RANS, unsteady RANS (URANS) and LES were employed for the simulation of airflow and pollutant dispersion within an urban street canyon and validated against wind tunnel experimental data.
It is shown that in order to accurately predict the flow and concentration fields within urban street canyon, it is imperative to account for the transient solution by resolving the internally and externally induced fluctuations.
Steady-state RANS poorly predicted the pollutant concentrations and did not reproduce consistent results. This is because it failed to capture the turbulent mixing of the flow field.
Similarly, URANS was unable to account for the fluctuations of the flow field, although solving for the
Fig. 8. URANS against LES for unsteady simulations at different time instances showing the mid-plane normalized vertical
velocities and corresponding normalized concentrations.
REFERENCES
[1] R. E. Britter and S. R. Hanna, “Flow and Dispersion in Urban Areas,”
Annual Review of Fluid Mechanics, vol. 35, pp. 1817 – 1831, 2003.
[2] R. E. Britter and ε. Schatzmann, “Background and Justification Document to Support the εodel Evaluation Guidance and Protocol”, COST Action 732, 2007.
[3] C. Gromke, R. Buccolieri, S. Di Sabatino, and B. Ruck, “Dispersion Study in a Street Canyon with Tree Planting by Means of Wind Tunnel and Numerical Investigations – Evaluation of CFD Data with Experimental data,” Atmospheric Environment, vol. 42, pp. 8640 – 8650, 2008.
[4] S. Di Sabatino, R. Buccolieri, B. Pulvirenti, and R.E. Britter, “Flow and Pollutant Dispersion in Street Canyons using FLUENT and ADMS-Urban,” Environmental Modeling and Assessment, vol. 13, pp. 369 – 381, 2008.
[5] R. Buccolieri, S. M. Salim, L. S. Leo, S. Di Sabatino, A. Chan, P. Ielpo, G. de Gennaro, C. Gromke, “Analysis of δocal Scale Tree -Atmosphere Interaction on Pollutant Concentration in Idealized Street Canyons and Application to a Real Urban Junction,” Atmospheric
Environment, vol. 45, pp. 1702 – 1713, 2011.
[6] S. ε. Salim, R. Buccolieri, A. Chan, S. Di Sabatino, “Numerical Simulation of Atmospheric Pollutant Dispersion in an Urban Street Canyon: Comparison between RANS and δES,” Journal of Wind
Engineering and Industrial Aerodynamics, vol. 99, pp. 103 – 113,
2011.
[7] S. ε. Salim, A. Chan, S. C. Cheah, “Numerical Simulation of Atmospheric Pollutant Dispersion in Tree-lined Street Canyons: Comparison between RANS and δES,” Building and Environment, vol. 46, pp. 1735 – 1746, 2011.
[8] Y. Tominaga and T. Stathopoulos, “Numerical Simulation of Dispersion Around an Isolated Cubic Building: Model Evaluation of RANS and LES,” Building and Environment, vol. 45, pp. 2231 – 2239, 2010.
[9] CODASC, Concentration Data of Steet Canyons, Laboratory of Building and Environmental Aerodynamics, IfH, Karlsruhe Institue of Technology, 2008.
[10] C. Gromke and B. Ruck, “Influence of Trees on the Dispersion of Pollutants in an Urban Street Canyon – Experimental Investigations of the Flow and Concentration Field,” Atmospheric Environment, vol. 41, pp. 3287 – 3302, 2007.
[11] C. Gromke and B. Ruck, “On the Impact of Trees on Dispersion Processes of Traffic Emissions in Street Canyons,” Boundary-Layer
Meteorology, vol. 131, pp. 19 – 34, 2009.
[12] S. ε. Salim, ε. Ariff, S. C. Cheah, “Wall y+ Approach for Dealing
with Turbulent Flows over a Wall εounted Cube,” Progress in
Computational Fluid Dynamics, vol. 10, pp. 1206 – 1211, 2010.
[13] H. K. Versteeg and W. Malalasekera, An Introduction to
Computational Fluid Dynamics: The Finite Volume Method, Harlow,
Pearson Education Limited, 2007.
[14] J. Y. Tu, G. H. Yeoh and C. Q. Liu, Computational Fluid Dynamics:
A Practical Approach, Oxford, Butterworth-Heinemann, 2008.