A Novel Rabbit Immunospot Array Assay on a Chip
Allows for the Rapid Generation of Rabbit Monoclonal
Antibodies with High Affinity
Tatsuhiko Ozawa1., Xiuhong Piao1., Eiji Kobayashi1
, Yue Zhou2, Hiroaki Sakurai2, Tsugunobu Andoh3, Aishun Jin1,4, Hiroyuki Kishi1*, Atsushi Muraguchi1
1Department of Immunology, Graduate School of Medicine and Pharmaceutical Sciences, University of Toyama, Toyama, Japan,2Department of Cancer Cell Biology, Graduate School of Medicine and Pharmaceutical Sciences, University of Toyama, Toyama, Japan,3Department of Applied Pharmacology, Graduate School of Medicine and Pharmaceutical Sciences, University of Toyama, Toyama, Japan,4Department of Immunology, College of Basic Medical Sciences, Harbin Medical University, Nangang District, Harbin, China
Abstract
Antigen-specific rabbit monoclonal antibodies (RaMoAbs) are useful due to their high specificity and high affinity, and the establishment of a comprehensive and rapid RaMoAb generation system has been highly anticipated. Here, we present a novel system using immunospot array assay on a chip (ISAAC) technology in which we detect and retrieve antigen-specific antibody-secreting cells from the peripheral blood lymphocytes of antigen-immunized rabbits and produce antigen-specific RaMoAbs with 10–12M affinity within a time period of only 7 days. We have used this system to efficiently generate RaMoAbs that are specific to a phosphorylated signal-transducing molecule. Our system provides a new method for the comprehensive and rapid production of RaMoAbs, which may contribute to laboratory research and clinical applications.
Citation:Ozawa T, Piao X, Kobayashi E, Zhou Y, Sakurai H, et al. (2012) A Novel Rabbit Immunospot Array Assay on a Chip Allows for the Rapid Generation of Rabbit Monoclonal Antibodies with High Affinity. PLoS ONE 7(12): e52383. doi:10.1371/journal.pone.0052383
Editor:Srinivas Kaveri, Cordelier Research Center, INSERMU872-Team16, France
ReceivedJuly 31, 2012;AcceptedNovember 12, 2012;PublishedDecember 26, 2012
Copyright:ß2012 Ozawa et al. This is an open-access article distributed under the terms of the Creative Commons Attribution License, which permits unrestricted use, distribution, and reproduction in any medium, provided the original author and source are credited.
Funding:Vivalis; The funders had no role in study design, data collection and analysis, decision to publish, or preparation of the manuscript.
Competing Interests:AM was supported by a research fund from Vivalis (Nantes, France.) The ISAAC method is covered by patents that have been exclusively licensed to Vivalis (Nantes, France.) Patent details: Pub.No.: WO/2009/017226, International Application No.: PCT/JP2008/063874, Title: CELL SCREENING METHOD; HK is one of Scientific Advisory Board Members of Vivalis. Microwell array chips are now provided to us by Vivalis. There are no further patents, products in development or marketed products to declare. This does not alter the authors9adherence to all the PLOS ONE policies on sharing data and materials, as detailed online in the guide for authors.
* E-mail: [email protected]
.These authors contributed equally to this work.
Introduction
Monoclonal antibodies are widely used in laboratory research as well as clinical applications due to their high specificity and high affinity. Notably, compared to conventional rodent antibodies, rabbit monoclonal antibodies (RaMoAbs) are ideal for investiga-tion and diagnosis for two reasons. First, rabbit antibodies generally exhibit a high affinity and high specificity [1–6]. Second, rabbits are known to produce antibodies to many antigens that are not immunogenic in mice or other animals [1,4,7–11].
Mouse-rabbit hetero-hybridomas were initially used to produce RaMoAbs [10,12–14]. However, these hetero-hybridomas were highly unstable, difficult to clone, and unable to secrete antibodies for prolonged periods [2]. In 1995, Knight and colleagues established a plasmacytoma cell line over-expressing v-abland
c-myc, which they used as a hybridoma partner cell line [6,15]. Nevertheless, the hybridoma method is not widely used at the laboratory level.
We have established a rapid, efficient, and high-throughput system for identifying and recovering objective antibody-secreting cells (ASCs) using microwell array chips and immunospot array assay on a chip (ISAAC) technology [16,17]. Microwell array chip has an array of up to 234,000 wells, and each well has a size and shape that are optimized for the accommodation of a single
lymphocyte; this feature has enabled us to analyze live cells on a single-cell basis. The ISAAC system can detect antigen-specific ASCs in human peripheral blood lymphocytes (PBLs) and can produce antigen-specific human monoclonal antibodies within 7 days.
In this study, we used the ISAAC system to detect antigen-specific antibody-secreting single primary B-cells from rabbits. We demonstrated that the rabbit-ISAAC system allows for the comprehensive and rapid production of RaMoAbs with high affinity. Moreover, the system can produce RaMoAbs that are specific to a phosphorylated signal-transducing molecule. This innovative technology may contribute to the high-throughput production of RaMoAbs for laboratory research and clinical applications.
Results
The Rabbit-ISAAC System
To establish the rabbit-ISAAC system, we first tested the feasibility of the ISAAC system for detecting rabbit ASCs on a single-cell basis. We immunized a rabbit with hen egg lysozyme (HEL) and prepared IgG+
lymphocytes from PBLs (Figure 1A). We then arrayed IgG+
HEL-specific ASCs using a Cy3-conjugated antibody that was specific to rabbit IgG. The secreted antibodies produced very strong immunospots on the HEL-coated chip that were not observed on the BSA-coated chip (Figure 1B).
We then retrieved 189 single cells that produced HEL-specific IgG immunospots and transferred the individual cells into separate micro-tubes for the amplification of cDNAs encoding the immunoglobulin heavy (H) and light (L) chain variable regions (VHand VL). We amplified VHand VLcDNAs using a single-cell
59-RACE method [17–19] with primers for thecchain and thek
chain (Figure 1C). We amplified 56 pairs of VHand VLcDNAs
and inserted these into expression vectors that contained the
cDNA of the rabbit immunoglobulin constant region (c or k
chain). Thereafter, we co-transfected both the c and k chain expression vectors together in CHO-S cells, which then produced 55 RaMoAbs. An ELISA showed that 24 of 55 antibodies were specific to HEL (Figure 1D, Table 1, and Table S1).
We then analyzed the cDNA sequences of 24 HEL-specific monoclonal antibodies and obtained 21 distinct sequences (Table 1). In agreement with the previous study [4,20–22], all of these sequences contained a single IGVH1 gene, and a majority of the sequences contained JH4. Our results indicate that the
antibody repertoire obtained from the analysis of primary rabbit
Figure 1. The rabbit-ISAAC system. (A) A scheme depicting the rabbit-ISAAC procedure. Briefly, rabbits were immunized and later sacrificed 1 week after the final boost. Rabbit IgG+
cells were sorted, and single antigen-specific ASCs were detected using a microwell array chip. Next, rabbit immunoglobulin cDNAs were amplified from single cells, cloned into expression vectors and co-transduced into CHO-S cells. The antigen specificity of the produced antibodies can be determined 7 days after the detection of antigen-specific ASCs on the microwell array chip. (B) Detection of single HEL-specific ASCs in PBLs from HEL-immunized rabbits by the rabbit-ISAAC technique. Antibody secretion was detected with HEL (top left) or BSA (negative control, top right). The cells were then stained with Oregon Green (middle), and the antibody immunospots and cell signals were merged (bottom). Arrowheads indicate HEL-specific ASCs. (C) Amplification of rabbit VH(top) and VL(bottom) with a single-cell 59-RACE procedure. The PCR
ASCs using the rabbit-ISAAC system is similar to that obtained with the conventional hybridoma method.
We next measured the affinity of these antibodies by ELISA (Figure S1). The affinity (KD) for HEL ranged from 1610–7 to 1610–12M (Table 1). Interestingly, theKD of 14 out of 24 (56%) antibodies for HEL was estimated to be 10–10 to 10–12M. The RaMoAbs with extremely high affinity may detect very small amount of antigen. To examine this possibility, we determined the limit of detection (LOD) in ELISA for a RaMoAb with 10–12M affinity (Ra_HEL21) and a mouse HEL-specific antibody (Mo_HEL10) that showed the highest affinity (3.71610–10M) among mouse HEL-specific antibodies obtained with ISAAC [17]. The calculated LOD of the RaMoAb was approximately 0.4 pM, and that of the mouse antibody was approximately 10 pM (Figure S2). The results demonstrated that the LOD of the RaMoAb of 10–12M affinity was 25-fold lower than that of the mouse antibody.
Relationship between Rabbit-ISAAC Immunospots and Affinities
The selection of antigen-specific antibodies with high affinity is one of the goals for the screening monoclonal antibodies. Adams
et al. reported that antibodies with high affinity do not diffuse distantly in tumors [23]. Taking this into account, we predicted that rabbit-ISAAC immunospots of antibodies with high affinity might be smaller in diameter compared to immunospots of antibodies with low affinity. Thus, we measured the distance at which the fluorescence intensities of rabbit-ISAAC immunospots were 50% (D1/2) (Figure 2A and 2B). Next, we plotted theD1/2
and affinities of individual immunospots (Figure 2C). As expected, antibodies with higher affinities had smaller D1/2 values; the
average KD of antibodies with immunospots of D1/2,60 was
2.56610–11M, while the KD of antibodies with D1/2.60 was
7.34610–10M (Student’s t-test,p,0.05) (Figure 2C). TheKD of 12 out of 15 (80%) antibodies withD1/2,60 was between 10–10
and 10–12M, while 2 out of 9 (22%) antibodies withD1/2.60 had
KDs of less than 10–10M (Fisher’s test,p,0.01) (Figure 2D). These results indicate that antibodies with high affinities do not diffuse far, which is in agreement with Adamset al. [23]. Taken together, these findings demonstrate that we can obtain HEL-specific ASCs with high affinities by retrieving cells withD1/2,60; however, the
D1/2 value may differ depending on the antigen as well as the
antibody.
An Efficient Screening System for Phosphorylated Peptide-specific RaMoAbs Using Rabbit-ISAAC
We next utilized the rabbit-ISAAC system to screen for ASCs producing antibodies that specifically recognize a phosphorylated peptide. We immunized rabbits with a phosphorylated peptide of human transforming growth factor-b-activated kinase 1 (TAK1), a key kinase regulating pro-inflammatory and innate/acquired immune signaling pathways [24]. Next, we prepared IgG+
cells from the PBLs of immunized rabbits and arrayed IgG+cells on
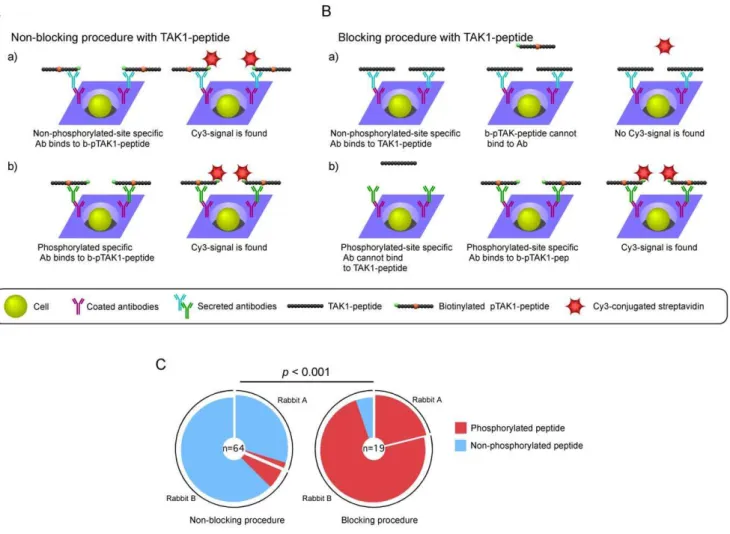
chips that were coated with rabbit IgG-specific antibodies. We attempted to detect Thr-187-phosphorylated TAK1, a critical site for TAK1 activation, (pTAK1)-peptide-specific ASCs using biotinylated pTAK1-peptide and Cy3-conjugated streptavidin (Figure 3). We obtained 64 monoclonal antibodies that bound to pTAK1-peptide. However, 59 of 64 monoclonal antibodies specifically bound not only to pTAK1-peptide but also to TAK1-peptide (Figure 3 and Table S1).
To efficiently screen for ASCs producing antibodies that specifically bind to pTAK1-peptide but not to TAK1-peptide, we first blocked the rabbit-ISAAC immunospots with TAK1-peptide. We then applied biotinylated pTAK1-peptide and Cy3-conjugated streptavidin to detect ASCs that were specific to pTAK1-peptide (Figure 3B). We obtained 19 monoclonal antibodies that bound to pTAK1-peptide. More than 90% (18 of 19) of the monoclonal antibodies specifically bound to pTAK1-peptide and not to TAK1-pTAK1-peptide (Figure 3C and Table S1). The acquisition efficiency of phosphorylated peptide-specific RaMoAbs was significantly improved compared to the non-blocking proce-dure (Fisher’s test,p,0.001) (Figure 3C). These results show that the use of the blocking procedure in the rabbit-ISAAC system is very useful for the isolation of monoclonal antibodies that specifically bind to pTAK1-peptide but not to TAK1-peptide.
We determined the affinity of these antibodies by ELISA (Figure S3). The affinity (KD) for pTAK1-peptide ranged from 1610–6to
1610–9M (Table 2). Sequencing analysis of the cDNA of 23
pTAK1-peptide-specific antibodies revealed eight distinct se-quences (Table 2). All of these sese-quences contained a single IGVH1 gene, as previously reported [20–22]. Regarding JH, the
frequency of JH4 usage was not so high as that of HEL antibodies. Functional Characterization of pTAK1-peptide-specific RaMoAbs
Finally, we characterized pTAK1-peptide-specific RaMoAbs using western blot analysis. It is known that over-expression of TAK1 with TAK1 binding protein 1 (TAB1) results in the phosphorylation of TAK1 at Thr-187 [25–27]. To examine whether pTAK1-peptide-specific RaMoAbs specifically detect Thr-187-phosphorylated TAK1, FLAG-tagged TAK1 and
HA-Table 1.Characterization of HEL-specific RaMoAbs.
ID IGHV IGHD IGHJ IGKV IGKJ Frequencya KD (M)b
Ra_HEL01 1S44 2 4 1S47 1–2 3 2.63610–12
Ra_HEL04 1S44 6 4 1S37 1–2 2 7.00610–12
Ra_HEL06 1S44 6 4 1S36 1–2 1 1.45610–12
Ra_HEL07 1S44 6 4 1S36 1–2 1 3.14610–9
Ra_HEL08 1S44 2 4 1S36 1–2 1 6.09610–10
Ra_HEL09 1S21 1 4 1S36 1–2 1 4.15610–11
Ra_HEL10 1S44 2 4 1S36 1–2 1 3.77610–12
Ra_HEL11 1S44 2 4 1S36 1–2 1 3.93610–12
Ra_HEL12 1S44 2 2 1S37 1–2 1 2.09610–7
Ra_HEL13 1S44 2 4 1S64 1–2 1 5.77610–8
Ra_HEL14 1S43 8 4 1S44 1–2 1 5.06610–11
Ra_HEL15 1S44 1 4 1S12 1–2 1 8.07610–10
Ra_HEL16 1S44 6 2 1S36 1–2 1 3.25610–10
Ra_HEL17 1S44 1 2 1S4 1–2 1 7.12610–7
Ra_HEL18 1S44 6 4 1S47 1–2 1 1.47610–12
Ra_HEL19 1S44 2 4 1S42 1–2 1 1.69610–9
Ra_HEL20 1S44 6 4 1S36 1–2 1 9.60610–11
Ra_HEL21 1S44 2 4 1S36 1–2 1 1.35610–12
Ra_HEL22 1S44 6 4 1S10 1–2 1 1.43610–11
Ra_HEL23 1S44 4 4 1S4 1–2 1 1.72610–9
Ra_HEL24 1S44 4 6 1S10 1–2 1 2.11610–9
aFrequency indicates numbers of clones showing identical amino acid
sequences.
bThe data are presented as average of at least two experiments.
doi:10.1371/journal.pone.0052383.t001
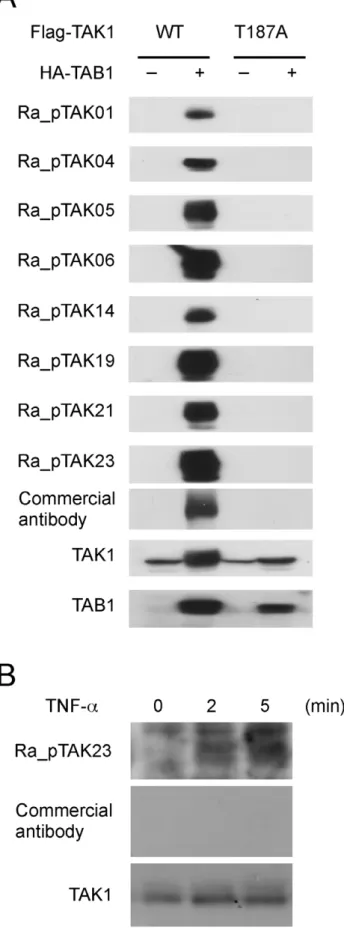
tagged TAB1 were co-expressed in HeLa cells, and the cell lysates were immunoblotted with pTAK1-peptide-specific antibodies. The phosphorylation-specific band of TAK1 was clearly detected by co-expression with TAB1 (Figure 4A). In contrast, no phosphorylation was detected in the FLAG-tagged alanine-substituted mutant TAK1 (T187A) upon co-expression with TAB1 (Figure 4A).
We next examined whether our pTAK1-peptide-specific RaMoAb detects TNF-a-induced phosphorylation of endogenous TAK1. To this end, HeLa cells were stimulated with TNF-a; subsequently, the cell lysates were immunoblotted with pTAK1-peptide-specific antibodies. Immunoblotting with our Ra_p-TAK23 antibody demonstrated that the bands could be detected in whole cell lysates from TNF-a-treated HeLa cells. Consistent with a previous study [25], the faster migrating bands correspond-ing to phosphorylated TAK1 were detected 2–5 min after the stimulation (Figure 4B). In contrast, a commercially available antibody could not detect the phosphorylation of endogenous TAK1 (Figure 4B). These results demonstrate that our RaMoAb recognizes Thr-187 phosphorylation of whole TAK1 molecules.
Discussion
In this study, we have demonstrated a novel screening procedure for the production of RaMoAbs using the rabbit-ISAAC system (Figure 1). We demonstrated that the system efficiently produced RaMoAbs with high affinity (10–10 to 10– 12M) (Figure 2 and Table 1). We also demonstrated that the
system could efficiently produce RaMoAbs that specifically recognize a phosphorylation-site-specific epitope (Figure 3 and Table 2).
In Table S1, we summarized the efficiency in each experimental step of rabbit ISAAC system. In the absence of blocking, from approximately 20 ml of blood, we obtained approximately 46107PBL, and obtained 26106IgG+
B cells. In the case of HEL, we analyzed a total of approximately 5.56105IgG+
cells using 14 microwell array chips (62,500 wells, 15mm in diameter). As a result, approximately 340 HEL-specific immunospots were detected, and 189 single cells were retrieved. From them, 56 pairs of VH and VL cDNAs were amplified and 55 RaMoAbs were
produced. Finally, 24 of them specifically bound to HEL. In the
Figure 2. Relationship between rabbit-ISAAC immunospots and affinities.(A) Representative ISAAC immunospots of secreted HEL-binding RaMoAbs with high (KD: 10212
M) and low (KD: 1029
M) affinity. (B) A decay curve of fluorescence intensities in individual ISAAC immunospots. The fluorescence intensity of individual ISAAC immunospots (y-axis) is plotted against the distance (x-axis).I1/2is the value at which the immunospot
fluorescence intensity reaches 50%, andD1/2indicates the distance at whichI1/2is achieved. TheD1/2value is shown in each individual plot. (C)
Relationship between theD1/2of individual immunospots (x-axis) andKD (y-axis). The dotted line indicatesD1/2= 60. The bar indicates the averageKD
for antibodies withD1/2,60 and those withD1/2.60. Thep-value was determined using Student’s t-test. (D) Frequency of antibodies with the
indicated order ofKD values for antibodies withD1/2,60 andD1/2.60. The colored pie segment indicates the frequency of antibodies with the
indicated order ofKD. The number in the center of the pie chart denotes the number of antibodies analyzed. Thep-value was determined using Fisher’s test.
Figure 3. Efficient screening for phosphorylated peptide-specific RaMoAbs with rabbit-ISAAC.(A) Non-blocking procedure using the TAK1-peptide. Antibodies recognizing the non-phosphorylated peptide (a) and the phosphorylated peptide (b) can bind to biotinylated pTAK1-peptide, and a signal can be detected. (B) Blocking procedure using the TAK1-peptide. Microwell array chips were pre-treated with TAK1-peptide before the addition of biotinylated pTAK1-peptide. a) The TAK1-peptide binds to antibodies that recognize the non-phosphorylated site of the pTAK1-peptide. As a result, the biotinylated pTAK1-peptide cannot bind to the antibodies, and no signal is detected. b) The TAK1-peptide does not bind to antibodies that recognize the phosphorylated site of the pTAK1-peptide. As a result, the biotinylated pTAK1-peptide binds to antibodies, and a signal can be detected. (C) Acquisition efficiency of phosphorylated peptide-specific antibodies in the non-blocking and blocking procedures. The colored pie segment indicates the frequency of RaMoAbs that are specific to a phosphorylated peptide (red) and non-phosphorylated peptide (blue) in the non-blocking procedure (left) and the blocking procedure (right). The number in the center of the pie chart denotes the number of antibodies analyzed. Thep-value was determined using Fisher’s test.
doi:10.1371/journal.pone.0052383.g003
Table 2.Characterization of pTAK1-peptide-specific RaMoAbs.
Rabbit ID IGHV IGHD IGHJ IGKV IGKJ Frequencya KD (M)b
A Ra_pTAK01 1S44 1 3 1S19 1–2 3 6.13610–6
A Ra_pTAK04 1S44 7 2 1S56 1–2 1 2.76610–9
A Ra_pTAK05 1S44 4 3 1S2 1–2 1 3.26610–9
B Ra_pTAK06 1S44 7 4 1S2 1–2 8 1.15610–9
B Ra_pTAK14 1S44 8 4 1S46 or 60 1–2 5 2.30610–6
B Ra_pTAK19 1S44 1 2 1S12 1–2 2 2.06610–9
B Ra_pTAK21 1S44 1 2 1S52 1–2 2 5.64610–9
B Ra_pTAK23 1S44 7 4 1S2 1–2 1 1.23610–9
aFrequency indicates numbers of clones showing the identical amino acid sequences. bThe data are presented as average of at least two experiments.
doi:10.1371/journal.pone.0052383.t002
case of pTAK1-peptide, a total of approximately 7.86105IgG+
cells were analyzed using 24 microwell array chips. In all, approximately 590 TAK1/pTAK1-specific immunospots were detected, and 272 single cells were retrieved. From them, 128 pairs of VH and VL cDNAs were amplified and 118 RaMoAbs were
produced. Finally, 64 of them specifically bound to TAK1/ pTAK1 (Table S1). These results demonstrated the feasibility of ISAAC system for the analysis of antigen-specific ASC in rabbits and the comprehensive production of antigen-specific RaMoAbs. A high affinity is one of the critical parameters for the selection of potent and efficacious therapeutic antibodies [28–31]. In this study, we analyzed the relationship between the sizes of the immunospots elicited by RaMoAbs produced by ASCs and their affinities. We found that the immunospots of antibodies with high affinity had smaller D1/2 values compared to immunospots of
antibodies with low affinity (Figure 2C and 2D); this is likely because high affinity antibodies quickly bind to antigen near the well and do not diffuse distantly. This result is accordance with the study of Adamset al.[23], which showed that antibodies with high affinity do not diffuse distantly in tumors. These results illustrate that we can efficiently screen for ASCs that produce high affinity RaMoAbs by selecting ASCs that produce immunospots with smaller D1/2values. This screening procedure allows us to
efficiently obtain antibodies with high affinities.
RaMoAbs with high affinities are useful for laboratory investigations and have many attractive features, including the ability to directly use reagents developed for western blot analysis that are substantially more sensitive. In this study, we showed that the RaMoAbs against HEL with 10–12M affinity could detect 25-fold lower amount of the antigen compared to the mouse MoAbs that were obtained by mouse ISSAC (Figure S2). We also demonstrated that RaMoAb to pTAK1-peptide obtained by rabbit ISSAC detected endogenous phosphorylated TAK1 in TNFa-stimulated cells (Figure 4B). These data indicate that use of rabbit ISSAC system may contribute to the development of antibodies for not only laboratory use for clinical diagnosis but also researches in the field of signal transduction in cancer and inflammatory diseases, as well as Toll-like receptor signaling pathway.
We have demonstrated an efficient screening system for the procurement of phosphorylated peptide-specific ASCs using a blocking procedure (Figure 3). The acquisition efficiency was less than 10% using a non-blocking procedure; however, using a blocking procedure, the acquisition efficiency was extremely high (greater than 90%) (Figure 3). Thus, the rabbit-ISAAC system can be used to efficiently obtain a large panel of phosphorylation site-specific RaMoAbs, which may contribute to phosphoproteomic analyses in cell physiology [32,33] and in tumorigenesis [34]. Furthermore, the blocking procedure used in the rabbit-ISAAC system may assist in obtaining antibodies that recognize subtle changes in epitopes or modified epitopes such as amino acid substitution, acetylation, or glycosylation.
Figure 4. Western blot analysis of pTAK1-peptide-specific RaMoAbs.(A) Examination of the specificity of pTAK1-peptide-specific RaMoAbs. Whole-cell lysates obtained from HeLa cells that were
transfected with plasmids containing FLAG-tagged wild type (WT) TAK1 or a phosphorylation site-substituted mutant (T187A) together with HA-tagged TAB1 were separated by SDS-PAGE and immunoblotted with Ra_pTAK01, 04, 05, 06, 14, 19, 21, and 23 antibodies, a commercial antibody specific to phosphorylated TAK1, a TAK1-specific antibody or a TAB1-specific antibody. (B) TNF-a-induced phosphorylation of endog-enous TAK1 at Thr187. Whole cell lysates from HeLa cells that had been stimulated with 20 ng ml21
TNF-afor the indicated time periods were separated by SDS-PAGE and immunoblotted with the Ra_pTAK23 antibody, a commercial pTAK1-pep-specific antibody, or a TAK1-specific antibody.
In conclusion, the rabbit-ISAAC system is a groundbreaking technological advancement that produces RaMoAbs with high affinity and specificity within a time period of only 7 days. This system may greatly promote the high-throughput production of RaMoAbs for laboratory research and clinical applications.
Materials and Methods
Antigens and Peptides
We used hen egg lysozyme (HEL; Sigma), bovine serum albumin (BSA; Wako), human transforming growth factor-b -activated kinase 1 (TAK1)-peptide (TAK1-peptide, DIQTHMNNKGSAA; Operon Biotechnologies), TAK1-peptide phosphorylated at Thr-187 (pTAK1-peptide, DIQTHM(pT)NNKGSAA; Operon Biotechnologies), biotiny-lated pTAK1-peptide (DIQTHM(pT)NNKGSAAK-biotin; Oper-on Biotechnologies), and KLH cOper-onjugates of pTAK1-peptide (Operon Biotechnologies).
Immunization of Rabbits and Cell Preparation
Experiments using rabbits were approved by the Committee on Animal Experiments at the University of Toyama. We immunized 12- to 13-week-old New Zealand White rabbits (Sankyo Lab) subcutaneously with 500mg of HEL or KLH conjugates of pTAK1-peptide in complete Freund’s adjuvant (Millipore). Two, four, and six weeks after primary immunization, we boosted the rabbits subcutaneously with 500mg of the same material used in the primary immunization in incomplete Freund’s adjuvant (Millipore). One week after the final boost, we isolated PBLs by centrifugation on a Ficoll–Hypaque gradient and isolated rabbit IgG+
cells with rabbit IgG-specific antibody-conjugated microbe-ads (Miltenyi Biotec) using an autoMACS Pro separator (Miltenyi Biotec) according to the manufacturer’s instructions.
Detection of Rabbit ASCs with a Microwell Array Chip (ISAAC)
The ISAAC method is covered by patents that have been exclusively licensed to Vivalis (Nantes, France). Details and instructions regarding the microwell array chip and the ISAAC method have been previously described [16,17,35–38]. Briefly, to detect HEL-specific IgG secretion, we coated the surface of the chip with 10mg ml–1HEL in phosphate-buffered saline (PBS) and incubated it overnight at 4uC. After removing the antigen solution, we blocked the chip with 0.01% Biolipidure (NOF Corporation, Japan) for 15 min at room temperature and subsequently washed it with the culture medium. We then arrayed cells in culture medium to the chip and removed residual cells outside the wells with gentle washing. We cultured the cells on the chip for 3 h at 37uC. After gentle washing, we applied 1.5mg ml–1 of
Cy3-conjugated rabbit IgG-specific goat polyclonal antibody (Millipore) to the chip and incubated for 30 min at room temperature to detect antigen-specific IgG secretion. To detect pTAK1-peptide-specific IgG secretion, we coated the surface of the chip with 1mg
ml–1 of rabbit IgG-specific antibody (MP Biomedicals) to trap secreted IgG. After the cells were cultured on the chip for 3 h, we added 10mg ml–1biotinylated pTAK1-peptide and incubated for
30 min; this was followed by the addition of Cy3-conjugated streptavidin (Sigma) for 30 min. Where indicated, we added 10mg ml–1TAK1-peptide to the chip and incubated for 30 min before adding biotinylated pTAK1-peptide. Finally, we stained the cells with 1mM Oregon Green (Molecular Probes) for 5 min at room temperature. Antigen-specific antibodies that were released from single cells were observed under a fluorescence microscope (BX51WI, Olympus).
Production of RaMoAbs
We retrieved single antigen-specific ASCs from individual wells using a micromanipulator (TransferMan NK2, Eppendorf) fitted with capillaries (Primetech, Japan) under a fluorescence micro-scope and expelled them into micro-tubes containing a cell lysis solution composed of 30mg of Dynabead Oligo(dT)25(Invitrogen),
3ml of Lysis/Binding Buffer (Invitrogen), and 0.25 pmol of each
specific primer for the constant regions of rabbit cand k. The sequences of the primers were as follows: Igc (59 -GCGAGTA-GAGGCCTGAGGAC-39) and Igk (59 -GATGC-CAGTTGTTTGGGTGGT-39). The Dynabeads were then transferred into a solution containing 15 U of SuperScriptIII (Invitrogen), 1 U of murine RNase inhibitor (New England Biolabs), 0.5 mM of each dNTP, 5 mM DTT, 0.2% Triton X-100, and 16First Strand Buffer (Invitrogen). A reverse transcrip-tion (RT) reactranscrip-tion was performed for 40 min at 50uC. After the RT reaction, the Dynabeads were transferred into another solution containing 20 U of terminal deoxynucleotidyl transferase (Roche), 0.5 mM dGTP, 1 U of murine RNase inhibitor, 4 mM MgCl2, 0.2% Triton-X 100, and 50 mM potassium buffer
(25 mM K2HPO4and 25 mM KH2PO4, pH 7.0), and incubated
for 40 min at 37uC to add a poly-dG tail to the 39 end of the cDNA. The Dynabeads were then transferred into a new PCR tube containing the first PCR reaction mix. The first PCR was performed using primeSTAR DNA polymerase (TaKaRa) according to the manufacturer’s instructions with a dC adaptor primer (59 -AGCAGTAGCAGCAGTTCGATAACTTC- GAATTCTGCAGTCGACGGTACCGCGGGCCCGG-GATCCCCCCCCCCCCCDN-39) and a specific primer for the constant region of rabbit c (Igc-1st: 59 -CGAGTTCCAAGT-CACGGTCA-39) and rabbit k (Igk-1st: 59 -CTCCCAGGT-GACGGTGACAT-39). The PCR cycles were as follows: 5 min at 95uC followed by 30 cycles of 15 sec at 95uC, 5 sec at 55uC, and 1 min 30 sec at 72uC. The resultant PCR mixtures were diluted 4-fold with water, and 2ml of the dilution was added to 23ml of the nested PCR mix to serve as template DNA. The nested PCR was performed in a reaction mix similar to the first PCR mix using an adaptor primer (59-AGCAGTAGCAGCAGTTCGATAA-39) and a specific primer for the constant region of rabbitc(Igc-nest: 59 -GCCTTTGACCAAGCAGCCCAA-39) or rabbitk(Igk-nest: 59 -CGGGAAAGTATTTATTCGCCACA-39). The PCR cycles were as follows: 5 min at 95uC followed by 35 cycles of 15 sec at 95uC, 5 sec at 55uC, and 1 min 30 sec at 72uC. We inserted the PCR products into expression vectors that contained cDNAs for the whole constant region of rabbitcorkchains. Thereafter, we co-transfected CHO-S cells (Invitrogen) with both the c and
kchain expression vectors encoding whole antibody molecules using the FreeStyle MAX CHO Expression System (Invitrogen), and we collected the supernatants of cultured cells after 3 days. We examined the antigen specificity of the recombinant antibodies by ELISA and confirmed the results with competitive ELISA by adding soluble antigen to the antibodies [17,36]. In this study, we screened only IgG-secreting cells with ISAAC. The immunoglob-ulin gene repertoire was analyzed with the IMGT/V-Quest tool (http://www.imgt.org/) [39]. For the determination of antibody affinity and western blotting, we collected the supernatants of cultured cells after 7 days and purified the RaMoAbs using a protein G column (GE Healthcare).
Determination of Antibody Affinity
We determined antibody affinities (KD) at antibody-antigen equilibrium (Ab+Ag « AbAg) in solution [40,41]. Briefly, we incubated various concentrations (0.2, 1, or 10 nM) of HEL-specific monoclonal antibodies with 0.3 to 1,000 nM of HEL or 1
to 2,500 nM pTAK1-peptide overnight at 4uC until equilibrium was reached. We then measured the concentrations of free antibody that remained unsaturated with antigens at equilibrium by ELISA and calculatedKD using Scatchard plot analysis. To this end, we coated 96-well MaxiSorpTMplates (Nunc) with 50ml per well of 5mg ml21HEL or 2.5mg ml21pTAK1-peptide in PBS and subsequently blocked with 3% BSA in PBS. After washing, we added the mixture of antigen and antibodies at equilibrium to the plates and incubated for 1 h at room temperature. We detected antibodies that were unsaturated with antigens using IgG-specific antibodies conjugated to alkaline phosphatase andp -nitrophenyl-phosphate, and we measured the optical absorbance at 405 nm with an ELISA reader. From the optical absorbance, we calculated the concentration of antibody that was unsaturated with antigen [Abf] and the concentration of antigen that was not bound to antibody [Agf].
Determination of LOD in ELISA
Ninety-six-well Maxisorp plates were coated with 50ml per well
of 1mg ml21 of IgG-specific antibody in PBS and then blocked
with 3% BSA in PBS. After washing, 30 pM of the rabbit HEL-specific antibody was added to the plate and incubated for 1 hr at room temperature. The plate was washed with PBS-T three times, and various concentrations (100 to 0.1 pM) of biotinylated HEL were added to the plates and then incubated for 1 hr at room temperature. The binding of HEL was detected using 0.5mg ml21
of alkaline phosphatase labeled-streptavidin (Sigma) and p -nitrophenylphosphate. The optical absorbance was measured at 405 nm with an ELISA reader, according to the manufacturer’s instructions. LOD were determined by extrapolating the concen-tration from the signal equal to background signal plus 3 s.d.
Western Blotting
We used a TAK1 antibody (M-579; Santa Cruz Biotechnology), a TAB1 antibody (C-20; Santa Cruz Biotechnology), and a phospho-TAK1 (Thr187) antibody (#4536; Cell Signaling Tech-nology). We transfected HeLa cells with FLAG-tagged TAK1 and HA-tagged TAB1 expression plasmids [25] using Lipofectamine reagents (Invitrogen). We stimulated HeLa cells with 20 ng ml21TNF-a (R&D Systems) for 2 and 5 min. After the
stimulation, we prepared whole cell lysates with lysis buffer (25 mM HEPES pH 7.7, 0.3 M NaCl, 1.5 mM MgCl2, 0.2 mM
EDTA, 0.1% Triton X-100, 20 mM b-glycerophosphate, 1 mM sodium orthovanadate, 1 mM phenylmethylsulfonyl fluoride, 1 mM DTT, 10mg ml21 aprotinin, and 10mg ml21 leupeptin).
We resolved the cell lysates by SDS-PAGE and transferred them to an Immobilon-P nylon membrane (Millipore). We treated the membrane with BlockAce (Dainippon Pharmaceutical Co.) and probed it with approximately 100 ng ml21of primary antibody as described above followed by horseradish peroxidase-conjugated anti rabbit or goat IgG-specific antibody (DAKO). Visualization was performed using the ECL system (GE Healthcare).
Supporting Information
Figure S1 Determination of affinity for HEL-specific RaMoAbs.Various concentrations (0.2, 1, or 10 nM) of HEL-specific RaMoAbs were incubated with 0.3 to 1,000 nM HEL overnight at 4uC until equilibrium was reached. The concentra-tion of free antibody that remained unsaturated at equilibrium was then measured by ELISA using HEL-coated 96-well plates. The concentration (nM) of HEL is indicated on the x-axis, and the absorbance at 405 nm is indicated on the y-axis. Data are representative of at least two independent experiments with similar results. The data were used for determination of KD using Scatchard plots.
(TIF)
Figure S2 Determination of limit of detection of HEL in ELISA using rabbit and mouse HEL-specific antibodies.
Biotinylated HEL ranged from 100 pM to 0.1 pM were used to examine the limit of detection (LOD) of HEL using rabbit or mouse HEL-specific antibodies that showed the highest affinity among the obtained antibodies. LOD of the rabbit (Ra_HEL01;
KD 2.63610212M) (left) and mouse (KD 3.71610210M) (right) HEL-specific antibodies were 0.4 pM and 10 pM, respectively. LOD was determined by extrapolating the concentration from the signal equal to background signal plus 3 s.d. of the background signal. Blue and red dotted lines indicate LODs of rabbit and mouse, respectively. Data are a representative of three indepen-dent experiments with similar results.
(TIF)
Figure S3 Determination of affinity for pTAK1-peptide-specific RaMoAbs. Various concentrations (0.2 or 6 nM) of pTAK1-peptide-specific RaMoAbs were incubated with 1 to 2,500 nM pTAK1-peptide overnight at 4uC until the equilibrium was reached. The concentration of free antibody that remains unsaturated at equilibrium was measured by ELISA using pTAK1-peptide-coated 96-well plate. The concentration (nM) of pTAK1-peptide is indicated on thex-axis, and the absorbance at 405 nm is indicated on they-axis. Data are representative of at least two independent experiments with similar results. The data were used for determination ofKD using Scatchard plots. (TIF)
Table S1 Efficiency of rabbit ISAAC for producing RaMoAbs.
(XLS)
Acknowledgments
We thank Sanae Hirota for technical assistance and Kaoru Hata for secretarial work.
Author Contributions
Conceived and designed the experiments: TO EK HS AJ HK AM. Performed the experiments: TO XP YZ TA. Analyzed the data: TO XP HS HK AM. Wrote the paper: TO HK AM.
References
1. Weller A, Meek J, Adamson ED (1987) Preparation and properties of monoclonal and polyclonal antibodies to mouse epidermal growth factor (EGF) receptors: evidence for cryptic EGF receptors in embryonal carcinoma cells. Development 100: 351–363.
2. Rossi S, Laurino L, Furlanetto A, Chinellato S, Orvieto E, et al. (2005) Rabbit monoclonal antibodies: a comparative study between a novel category of immunoreagents and the corresponding mouse monoclonal antibodies. Am J Clin Pathol 124: 295–302.
3. Huang Z, Zhu W, Meng Y, Xia H (2006) Development of new rabbit monoclonal antibody to progesterone receptor (Clone SP2): no heat
pretreat-ment but effective for paraffin section immunohistochemistry. Appl Immuno-histochem Mol Morphol 14: 229–233.
4. Mage RG, Lanning D, Knight KL (2006) B cell and antibody repertoire development in rabbits: the requirement of gut-associated lymphoid tissues. Dev Comp Immunol 30: 137–153.
6. Zhu W, Yu G-L (2009) Rabbit hybridoma. Therapeutic Monoclonal Antibodies: From Bench to Clinic (Zhiqiang An (Editor)) Hoboken, New Jersey: John Wiley & Sons.
7. Krause RM (1970) The search for antibodies with molecular uniformity. Adv Immunol 12: 1–56.
8. Bystryn JC, Jacobsen JS, Liu P, Heaney-Kieras J (1982) Comparison of cell-surface human melanoma-associated antigens identified by rabbit and murine antibodies. Hybridoma 1: 465–472.
9. Norrby E, Mufson MA, Alexander H, Houghten RA, Lerner RA (1987) Site-directed serology with synthetic peptides representing the large glycoprotein G of respiratory syncytial virus. Proc Natl Acad Sci U S A 84: 6572–6576. 10. Raybould TJ, Takahashi M (1988) Production of stable rabbit-mouse
hybridomas that secrete rabbit mAb of defined specificity. Science 240: 1788– 1790.
11. Feng L, Wang X, Jin H (2011) Rabbit monoclonal antibody: potential application in cancer therapy. Am J Transl Res 3: 269–274.
12. Kuo MC, Sogn JA, Max EE, Kindt TJ (1985) Rabbit-mouse hybridomas secreting intact rabbit immunoglobulin. Mol Immunol 22: 351–359. 13. Verbanac KM, Gross U, Rebellato LM, Thomas JM (1993) Generation of
rabbit anti-lymphocyte monoclonal antibodies. Transplant Proc 25: 837–838. 14. Verbanac KM, Gross UM, Rebellato LM, Thomas JM (1993) Production of
stable rabbit-mouse heterohybridomas: characterization of a rabbit monoclonal antibody recognizing a 180 kDa human lymphocyte membrane antigen. Hybridoma 12: 285–295.
15. Spieker-Polet H, Sethupathi P, Yam PC, Knight KL (1995) Rabbit monoclonal antibodies: generating a fusion partner to produce rabbit-rabbit hybridomas. Proc Natl Acad Sci U S A 92: 9348–9352.
16. Jin A, Ozawa T, Tajiri K, Obata T, Kishi H, et al. (2011) Rapid isolation of antigen-specific antibody-secreting cells using a chip-based immunospot array. Nat Protoc 6: 668–676.
17. Jin A, Ozawa T, Tajiri K, Obata T, Kondo S, et al. (2009) A rapid and efficient single-cell manipulation method for screening antigen-specific antibody-secreting cells from human peripheral blood. Nat Med 15: 1088–1092. 18. Ozawa T, Kishi H, Muraguchi A (2006) Amplification and analysis of cDNA
generated from a single cell by 59-RACE: application to isolation of antibody heavy and light chain variable gene sequences from single B cells. Biotechniques 40: 469–470, 472, 474 passim.
19. Ozawa T, Tajiri K, Kishi H, Muraguchi A (2008) Comprehensive analysis of the functional TCR repertoire at the single-cell level. Biochem Biophys Res Commun 367: 820–825.
20. Popkov M, Mage RG, Alexander CB, Thundivalappil S, Barbas CF, 3rd, et al. (2003) Rabbit immune repertoires as sources for therapeutic monoclonal antibodies: the impact of kappa allotype-correlated variation in cysteine content on antibody libraries selected by phage display. J Mol Biol 325: 325–335. 21. Raman C, Spieker-Polet H, Yam PC, Knight KL (1994) Preferential VH gene
usage in rabbit Ig-secreting heterohybridomas. J Immunol 152: 3935–3945. 22. Winstead CR, Zhai SK, Sethupathi P, Knight KL (1999) Antigen-induced
somatic diversification of rabbit IgH genes: gene conversion and point mutation. J Immunol 162: 6602–6612.
23. Adams GP, Schier R, McCall AM, Simmons HH, Horak EM, et al. (2001) High affinity restricts the localization and tumor penetration of single-chain fv antibody molecules. Cancer Res 61: 4750–4755.
24. Sakurai H (2012) Targeting of TAK1 in inflammatory disorders and cancer. Trends Pharmacol Sci. in press.
25. Singhirunnusorn P, Suzuki S, Kawasaki N, Saiki I, Sakurai H (2005) Critical roles of threonine 187 phosphorylation in cellular stress-induced rapid and
transient activation of transforming growth factor-beta-activated kinase 1 (TAK1) in a signaling complex containing TAK1-binding protein TAB1 and TAB2. J Biol Chem 280: 7359–7368.
26. Sakurai H, Miyoshi H, Mizukami J, Sugita T (2000) Phosphorylation-dependent activation of TAK1 mitogen-activated protein kinase kinase kinase by TAB1. FEBS Lett 474: 141–145.
27. Shibuya H, Yamaguchi K, Shirakabe K, Tonegawa A, Gotoh Y, et al. (1996) TAB1: an activator of the TAK1 MAPKKK in TGF-beta signal transduction. Science 272: 1179–1182.
28. Lu D, Shen J, Vil MD, Zhang H, Jimenez X, et al. (2003) Tailoring in vitro selection for a picomolar affinity human antibody directed against vascular endothelial growth factor receptor 2 for enhanced neutralizing activity. J Biol Chem 278: 43496–43507.
29. Velders MP, van Rhijn CM, Oskam E, Fleuren GJ, Warnaar SO, et al. (1998) The impact of antigen density and antibody affinity on antibody-dependent cellular cytotoxicity: relevance for immunotherapy of carcinomas. Br J Cancer 78: 478–483.
30. Yu Y, Lee P, Ke Y, Zhang Y, Yu Q, et al. (2010) A humanized anti-VEGF rabbit monoclonal antibody inhibits angiogenesis and blocks tumor growth in xenograft models. PLoS One 5: e9072.
31. Zhu Z, Hattori K, Zhang H, Jimenez X, Ludwig DL, et al. (2003) Inhibition of human leukemia in an animal model with human antibodies directed against vascular endothelial growth factor receptor 2. Correlation between antibody affinity and biological activity. Leukemia 17: 604–611.
32. Giljohann DA, Mirkin CA (2009) Drivers of biodiagnostic development. Nature 462: 461–464.
33. Cui Y, Wei Q, Park H, Lieber CM (2001) Nanowire nanosensors for highly sensitive and selective detection of biological and chemical species. Science 293: 1289–1292.
34. Bao YP, Wei TF, Lefebvre PA, An H, He L, et al. (2006) Detection of protein analytes via nanoparticle-based bio bar code technology. Anal Chem 78: 2055– 2059.
35. Tajiri K, Kishi H, Tokimitsu Y, Kondo S, Ozawa T, et al. (2007) Cell-microarray analysis of antigen-specific B-cells: single cell analysis of antigen receptor expression and specificity. Cytometry A 71: 961–967.
36. Tokimitsu Y, Kishi H, Kondo S, Honda R, Tajiri K, et al. (2007) Single lymphocyte analysis with a microwell array chip. Cytometry A 71: 1003–1010. 37. Kinoshita K, Ozawa T, Tajiri K, Kadowaki S, Kishi H, et al. (2009) Identification of antigen-specific B cells by concurrent monitoring of intracellular Ca2+ mobilization and antigen binding with microwell array chip system equipped with a CCD imager. Cytometry A 75: 682–687.
38. Ozawa T, Kinoshita K, Kadowaki S, Tajiri K, Kondo S, et al. (2009) MAC-CCD system: a novel lymphocyte microwell-array chip system equipped with CCD scanner to generate human monoclonal antibodies against influenza virus. Lab Chip 9: 158–163.
39. Giudicelli V, Chaume D, Lefranc MP (2004) IMGT/V-QUEST, an integrated software program for immunoglobulin and T cell receptor V-J and V-D-J rearrangement analysis. Nucleic Acids Res 32: W435–440.
40. Friguet B, Chaffotte AF, Djavadi-Ohaniance L, Goldberg ME (1985) Measurements of the true affinity constant in solution of antigen-antibody complexes by enzyme-linked immunosorbent assay. J Immunol Methods 77: 305–319.
41. Djavadi-Ohaniance L, Goldberg ME, Friguet B (1996) Antibody engineering (Eds : McCafferty J, et al) IRL Press, Oxford: 77–96.