JULIANE LAUREANO
APPLICATION OF OZONE IN THE MICROVINIFICATION IN REPLACEMENT OF SULPHITE
Tese apresentada à Universidade Federal de Viçosa, como parte das exigências do Programa de Pós-graduação em Engenharia Agrícola, para obtenção do título de Doctor Scientiae.
VIÇOSA
Ficha catalográfica preparada pela Biblioteca Central da Universidade Federal de Viçosa - Câmpus Viçosa
T
Laureano, Juliane, 1985-L379a
2015
Application of ozone in the microvinification in
replacement of sulphite / Juliane Laureano. – Viçosa, MG, 2015. xiii, 106f. : il. ; 29 cm.
Orientador: Lêda Rita D'Antonino Faroni.
Tese (doutorado) - Universidade Federal de Viçosa. Inclui bibliografia.
1. Vinho tinto - Produção. 2. Vinho tinto - Efeito do ozônio. 3. Bactérias lácticas. 4. Antocianina. I. Universidade Federal de Viçosa. Departamento de Engenharia Agrícola. Programa de Pós-graduação em Engenharia Agrícola. II. Título.
JULIANE LAUREANO
APPLICATION OF OZONE IN THE MICROVINIFICATION IN REPLACEMENT OF SULPHITE
Tese apresentada à Universidade Federal de Viçosa, como parte das exigências do Programa de Pós-graduação em Engenharia Agrícola, para obtenção do título de Doctor Scientiae.
APROVADA: 22 de setembro de 2015.
______________________________ ______________________________ Luca Giorgio Carlo Rolle Monique Renon Eller
________________________________ ________________________________ Maria Cristina Dantas Vanetti Paulo Henrique Alves da Silva
(Coorientadora) (Coorientador)
__________________________ Lêda Rita D’Antonino Faroni
ii “La più grande soddisfazione nella vita è fare quello
che la gente crede che tu non sia in grado di fare”
“Il successo non è definitivo, il fallimento non è fatale: ciò che conta è il coraggio di andare avanti.”
iii Dedico
iv AGRADECIMENTOS
À Deus, que antes mesmo de eu nascer já havia me dado tudo que eu precisava para concluir esse projeto.
À Universidade Federal de Viçosa e ao Departamento de Engenharia Agrícola pela oportunidade de adquirir mais esse título.
Ao CNPQ pela bolsa de estudos e à FAPEMIG pelo suporte financeiro.
À profª Lêda Rita D’Antonino Faroni pela oportunidade de realizar o doutorado no seu grupo de pesquisa.
Aos professores Paulo Henrique Alves da Silva e Maria Cristina Dantas Vanetti pela colaboração e ensinamentos compartilhados no decorrer do trabalho.
Aos professores Luca Rolle e Vicenzo Gerbi pela confiança e orientação durante o Doutorado Sanduiche.
À profª Monique Renon Eller, que com muita gentileza e confiança permitiu o uso do seu laboratório para a execução desse projeto.
À Fazenda do Guarará na pessoa do Eng. Aloisio Rodrigues Pereira pelo fornecimento das uvas.
Ao prof. Paulo Roberto Cecon pelo auxílio com as análises estatísticas. Ao Ariel, Michelle e Jussara pela ajuda com a metodologia.
Aos estagiários Tamara, Vinícius, Gustavo e Larissa pelo tempo e dedicação que despuseram, auxiliando na realização dos experimentos.
À Raquel e à Patrícia pelo tempo (incluindo sábados e madrugadas) em que me auxiliaram no laboratório, numa demonstração de amizade da qual eu não me esquecerei.
Ao Helvécio, que muito me ajudou me emprestando gentilmente o seu carro para o transporte das uvas.
Ao meu pai que me levou para buscar as uvas onde e quando eu precisei, e à minha mãe pelas horas que passou comigo no laboratório, me dando a ajuda e o apoio dos quais eu precisava naqueles momentos.
À prof.ª Edimar Aparecida Filomeno Fontes por permitir o uso da centrífuga. Ao Lucas, técnico do laboratório de grãos, pela ajuda com os reagentes e ozonização.
v À Adriana e Analice (DMB) pelas informações compartilhadas e disposição em ajudar com a microbiologia.
Aos funcionários do DTA, Perereca e ao seu filho, pela presteza em realizar todas as manutenções necessárias ao longo dos trabalhos, e ao Carlinhos pela esterilização das placas de Petri.
À todos que me auxiliaram com a preparação das uvas (Raquel, Patrícia, Handina, Daniel, Amanda, Bruno, Tamara, mãe e Jovens Talentos: Luis Flavio, Cassiano, Aline e Gabriela).
Aos integrantes do laboratório de grãos pela amizade nesses quatro anos.
Aos colegas do Dipartimento di Viticoltura ed Enologia da Università di Torino, que contribuíram grandemente com o trabalho durante o Doutorado Sanduiche.
Ao Isaia que tanto me motivou na finalização desse trabalho.
vi BIOGRAFIA
JULIANE LAUREANO, filha de Geraldo Eloi Laureano e Sirlene de Fátima Macedo Laureano, nasceu em 23 de abril de 1985, na cidade de Viçosa – MG.
Estudou grande parte do ensino fundamental na E.E. Cônego José Ermelindo de Souza, em Araponga - MG, concluindo-o na E.M. Ministro Edmundo Lins, em Viçosa - MG, no ano de 1999.
De 2000 a 2002 realizou o ensino médio pelo Colégio Equipe de Viçosa.
Em março de 2004 iniciou no curso de Engenharia de Alimentos pela Universidade Federal de Viçosa, concluindo-o em julho de 2009.
Em agosto de 2009 ingressou no programa de Mestrado em Engenharia Agrícola pela Universidade Federal de Viçosa, concluindo-o em julho de 2011.
vii INDICE
RESUMO ... x
ABSTRACT ... xii
INTRODUÇÃO GERAL ... 1
REFERÊNCIAS BIBLIOGRÁFICAS ... 4
ARTIGOS... 7
EFFECT OF OZONATION ON YEAST, LACTIC ACID BACTERIA AND ACETIC ACID BACTERIA VIABILITY, IN VITRO, UNDER WINEMAKING CONDITIONS ... 8
Abstract ... 9
1. Introduction ... 9
2. Results and discussion ... 11
3. Materials and methods ... 19
3.1. Preparation of grape juice ... 19
3.2. Preparation of inoculum ... 19
3.3. Ozone treatment ... 20
3.4. Microbiological analyses ... 21
3.5. Statistical analyses ... 22
Acknowledgments ... 22
Conflict of interest ... 22
References ... 23
ANTIMICROBIAL ACTIVITY OF OZONE TREATMENT DURING ALCOHOLIC FERMENTATION AND ITS EFFECT ON THE ANTHOCYANINS AND COLOR OF RED WINE ... 28
Abstract ... 29
1. Introduction ... 30
2. Materials and Methods ... 32
2.1. Grapes ... 32
2.2. Winemaking procedure ... 32
2.3. Ozonation ... 33
2.4. Microbiological analyses ... 34
viii
2.6. Anthocyanins determination ... 35
2.7. Polymeric color analysis ... 35
2.8. Chromatic characteristics ... 36
2.9. Statistical analyses ... 37
3. Results and Discussion ... 38
3.1. Ozone effects on the microorganisms during fermentation ... 38
3.2. Enological parameters ... 40
3.3. Ozone effects on the anthocyanin content of wine ... 42
3.4. Ozone effects on the polymeric color of wine ... 45
3.5. Ozone effects on the chromatic characteristics of wine ... 48
4. Conclusions ... 51
Acknowledgments ... 52
Conflict of interest ... 52
References ... 52
THE EFFECT OF OZONE ON THE POLYPHENOL CONTENT, ANTIOXIDANT ACTIVITY AND VOLATILE COMPOUND CONTENT OF RED WINE ... 58
Abstract ... 59
Chemical compounds studied in this article ... 59
1. Introduction ... 60
2. Materials and methods ... 63
2.1. Wine producing ... 63
2.2. Ozone treatment ... 64
2.3. Total phenolic content ... 64
2.4. Antioxidant activity - ABTS assay ... 65
2.5. Volatile compounds ... 66
2.6. Statistical analyses ... 67
3. Results and discussion ... 67
4. Conclusion ... 75
Acknowledgements ... 75
References ... 76
EFFECTS OF CONTINUOUS EXPOSURE TO OZONE GAS AND ELECTROLYZED WATER ON THE SKIN HARDNESS OF TABLE AND WINE GRAPE VARIETIES ... 81
ix
Practical Applications ... 82
Introduction ... 83
Materials and Methods ... 85
Grape samples ... 85
Technological ripeness parameters ... 86
Ozone gas, electrolyzed water production and berry treatment ... 87
Berry skin mechanical parameters ... 88
Statistical analyses ... 89
Results and Discussion ... 89
Technological ripeness parameters ... 89
Berry skin mechanical parameters ... 90
Conclusion ... 97
Acknowledgments ... 98
References ... 98
x RESUMO
LAUREANO, Juliane, D.Sc., Universidade Federal de Viçosa, setembro de 2015. Application of ozone in the microvinification in replacement of sulphite. Orientador: Lêda Rita D'Antonino Faroni. Coorientadores: Paulo Henrique Alves da Silva, Maria Cristina Dantas Vanetti e Paulo Roberto Cecon.
O dióxido de enxofre (SO2) é o aditivo mais frequentemente utilizado para evitar a deterioração de vinhos. No entanto, ele pode causar alterações sensoriais no produto final e apresentar riscos à saúde humana. O ozônio, por sua vez, tem sido proposto em diferentes fases da produção de vinho, porém ainda não diretamente no mosto para o controle de micro-organismos. O objetivo desta pesquisa foi investigar a viabilidade do ozônio como substituto ao SO2 em algumas etapas da linha de produção de vinhos. Para isso, os trabalhos foram realizados em duas etapas. Na primeira etapa, analisou-se o efeito do ozônio (0 a 7,5 mg.L-1, durante 10 min) sobre micro-organismos de importância enológica (Saccharomyces cerevisiae, Lactobacillus casei, Leuconostoc mesenteroides, Pediococcus acidilactici e
xii ABSTRACT
LAUREANO, Juliane, D.Sc., Universidade Federal de Viçosa, September, 2015. Application of ozone in the microvinification in replacement of sulphite. Adviser: Lêda Rita D’Antonino Faroni. Co-advisers: Paulo Henrique Alves da Silva, Maria Cristina Dantas Vanetti and Paulo Roberto Cecon.
Sulfur dioxide (SO2) is the additive that is most frequently used to avoid wine spoilage. However, it can cause sensorial alterations in the final product and presents risks to human health. Ozone has been proposed at different stages of wine production. However, it has not yet been used directly in the must to control microorganism growth. Therefore, the purpose of this research was to investigate the viability of ozone as substitute for SO2 in some stages of wine production. For this, experiments were carried out in two parts. First, the ozone effect (0 to 7.5 mg.L-1 for 10 min) on microorganisms with enological importance (Saccharomyces cerevisiae, Lactobacillus casei, Leuconostoc mesenteroides, Pediococcus acidilactici, and
1 INTRODUÇÃO GERAL
O vinho é uma bebida alcoólica amplamente consumida em todo o mundo e de grande valor comercial, e o seu consumo moderado é cada vez mais recomendado devido às suas propriedades funcionais (Garaguso e Nardini, 2015). É definido pelo Office International de la Vigne et du Vin como a bebida resultante da fermentação
alcoólica total ou parcial de uvas frescas, esmagadas ou não, ou de mostos de uvas (OIV, 2015).
Na transformação do mosto em vinho ocorrem complexos processos bioquímicos, envolvendo interações entre leveduras, bactérias láticas e acéticas (Andorrà et al., 2010). As leveduras, essenciais à produção do vinho, são responsáveis pela conversão do açúcar em álcool por meio da fermentação alcoólica (Manfroi, 2002). As bactérias láticas participam da fermentação malolática do vinho, mas podem também causar danos sensoriais ao mesmo (Montersino et al., 2008). As bactérias acéticas, por sua vez, são capazes de contaminar uvas, mostos e vinhos, oxidando o etanol em ácido acético (Barata et al., 2012). Estas últimas são aeróbias estritas e, portanto, necessitam de oxigênio para realizarem a fermentação acética. Multiplicam-se em maior quantidade na parte superior do vinho, formando um “véu” conhecido como "mãe do vinagre". O crescimento excessivo de bactérias acéticas pode provocar modificações na composição do mosto, alterando o crescimento das leveduras durante a fermentação alcoólica e causando alterações sensoriais no produto final (Flanzy, 2003).
2 Na tentativa de conciliar a adição de sulfito no processo de produção de vinho com o consumo seguro dessa bebida, órgãos nacionais e internacionais estabeleceram limites máximos de sulfito considerados adequados. A este respeito, a Resolução RDC nº 34 da ANVISA (Agência Nacional de Vigilância Sanitária), de 9 de março de 2001, estabelece que o limite máximo permitido de sulfito total em vinhos (expresso em SO2) é 350 mg.L-1. Já a Organização Mundial de Saúde (OMS) recomenda um consumo máximo diário de SO2 equivalente a 0,7 mg kg-1 de peso corpóreo (Machado et al., 2009). Assim, uma pessoa de 70 kg terá um limite diário de 49 mg de ingestão de anidrido sulfuroso. No entanto, ao ingerir meia garrafa de vinho com 150 mg.L-1, poderá estar ingerindo 56 mg de SO2, o que está acima do limite recomendado pela OMS.
Hoje há uma tendência de restrição ao uso de sulfitos como aditivos, tanto em vinho como em outros produtos alimentícios, devido à sua ingestão estar associada a inúmeros efeitos adversos à saúde dos consumidores (Machado e Toledo, 2006; García-Ruiz et al., 2011, Artés-Hernández et al., 2007). Além disso, os sulfitos apresentam alta corrosividade sobre metais (Cayuela et al., 2009) e em altas doses podem causar alterações sensoriais no produto final (Guzzon et al., 2013). Tais desvantagens impelem pesquisadores à busca por métodos alternativos para a conservação do vinho.
3 Cada micro-organismo possui sensibilidade intrínseca em relação à ozonização e sua suscetibilidade varia de acordo com o pH do meio, temperatura, umidade e presença de ácidos, surfactantes e açúcares (Kim et al., 1999). Além disso, se utilizado em doses inadequadas, o ozônio pode oxidar compostos orgânicos, resultando em descoloração e deterioração de componentes de sabor dos produtos (Kim et al., 1999). A este respeito foi relatada a degradação de antocianinas e cor em sucos de uva, morango e amora preta por Tiwari et al. (2009a, 2009b, 2009c).
Nesse contexto, se fazem importantes os estudos para avaliar a viabilidade do uso do ozônio diretamente na produção de vinho, como substituto ao SO2, no controle de micro-organismos e seus possíveis efeitos sobre a qualidade do produto final. O objetivo deste trabalho foi avaliar o uso do ozônio gasoso em substituição ao sulfito em algumas etapas da linha de produção de vinho.
4 REFERÊNCIAS BIBLIOGRÁFICAS
Andorrà, I., Landi, S., Mas, A., Esteve-Zarzoso, B., Guillamón, J. M., 2010. Effect of fermentation temperature on microbial population evolution using culture-independent and dependent techniques. Food Research International. 43, 773– 779.
Araújo, J. M., 2006. Química de Alimentos: teoria e prática. Editora UFV. Viçosa, pp. 87.
Artés-Hernández, F.; Aguayo, E.; Artés, F.; Tomás-Barberán, F. A., 2007. Enriched ozone atmosphere enhances bioactive phenolics in seedless table grapes after prolonged shelf life. Journal of the Science of Food and Agriculture. 87, 824– 831.
Barata, A., Malfeito-Ferreira, M., Loureiro, V., 2012. The microbial ecology of wine grape berries. International Journal of Food Microbiology. 153, 243-259.
Brasil. ANVISA. Resolução RDC nº 34, de 16 de agosto de 2010. Dispõe sobre o Regulamento Técnico para produtos saneantes desinfestantes. Diário Oficial da União, Brasília, DF, 2010.
Cayuela, J. A., Vázquez, A., Pérez, A. G., García, J. M., 2009. Control of table grapes postharvest decay by ozone treatment and resveratrol induction. Food Science and Technology International, 15 (5), 495-502.
Flanzy, C. Enologia: fundamentos científicos y tecnológicos. 2 ed. Madrid: Mundi-Prensa, 2003. 797 p.
Garaguso, I., Nardini, M., 2015. Polyphenols content, phenolics profile and antioxidant activity of organic red wines produced without sulfur dioxide/sulphites addition in comparison to conventional red wines. Food Chemistry, 179, 336–342.
García-Ruiz, A., Moreno-Arribas, M. V., Martín-Álvarez, P. J., Bartolomé, B., 2011. Comparative study of the inhibitory effects of wine polyphenols on the growth of enological lactic acid bacteria. International Journal of Food Microbiology. 145, 426–431.
5 Kim, J. G.; Yousef, A. E.; Dave, S., 1999. Application of ozone for enhancing the microbiological safety and quality of foods: A review. Journal of Food Protection, 1071-1087.
Machado, R. M. D., Toledo, M. C. F., 2006. Sulfitos em alimentos. Brazilian Journal of Food Technology, 9(4), 265-275.
Machado, R. M. D., Toledo, M. C. F., Vicente, E., 2009. Sulphite content in some Brazilian wines: analytical determination and estimate of dietary exposure. European Food Research and Technology, 229, 383–389.
Manfroi, L., 2002. Avaliação do processo fermentativo e da composição de vinho merlot elaborado com diferentes espécies de Saccharomyces, Oenococcus e Lactobacillus. Tese (doutorado). Viçosa, MG: UFV, 119p.
Mohammad, H. N., Haddad, K. M. H., 2009. Efficacy of ozone to reduce microbial populations in date fruits. Food Control, 20(1), 27-30.
Montersino, S., Prieto, A., Munoz, R., De Las Rivas, B., 2008. Evaluation of exopolysaccharide production by Leuconostoc mesenteroides strains isolated from wine. Journal of Food Science. 73 (4), 196-199.
OIV, 2015. Definizione dei prodotti.
http://www.oiv.int/oiv/info/itdefinitionproduit#vini Acessed in 24 setember
2015.
Palou, L., Smilanick, J. L., Crisosto, C. H., Mansour, M., Plaza, P., 2003. Ozone gas penetration and control of the sporulation of Penicillium digitatum and Penicillium italicum within commercial packages of oranges during cold storage.
Crop Protection, 22, 1131-1134.
Palou, L., Smilanick, J. L., Crisosto, C.H., Mansour, M., 2001. Effect of gaseous ozone exposure on the development of green and blue molds on cold stored citrus fruit. Plant Disease, 85, 632–638.
Pascual, A., Llorca, I., Canut, A., 2007. Use of ozone in food industries for reducing the environmental impact of cleaning and disinfection activities. Trends in Food Science & Technology, 18, 29-35.
6 Pirani, S.,2011. Application of O3 in food industries. These (PhD). Milan, MI:
Universita degli Studi di Milano, 136 p.
Rizzon, L. A., Zanuz, M. C., Manfredini, S., 1996. Como elaborar vinho de qualidade na pequena propriedade, 2ª ed., Embrapa: Bento Gonçalves, 54 p.
Simões, R. de O., 2012. Processo de ozonização como tecnologia pós-colheita na conservação de goiabas ‘pedro sato’. Tese (doutorado). Viçosa, MG: UFV, 156 p.
Tiwari, B. K., O’donnell, C.P., Patras, A., Brunton, N., Cullen, P.J., 2009a. Anthocyanins and color degradation in ozonated grape juice. Food and Chemical Toxicology, 47, 2824–2829.
Tiwari, B. K., O’donnell, C.P., Patras, A., Brunton, N., Cullen, P.J., 2009b. Effects of ozone processing on anthocyanins and ascorbic acid degradation of strawberry juice. Food Chemistry, 113, 1119–1126.
Tiwari, B. K.; O’Donnell, C. P.; Muthukumarappan, K..; Cullen, P. J. 2009c. Anthocyanin and color degradation in ozone treated blackberry juice. Innovative Food Science and Emergy Technologies, 10, 70-75.
7 LISTA DE ARTIGOS
Artigo 1: Effect of ozonation on yeast, lactic acid bacteria and acetic acid bacteria viability, in vitro, under winemaking conditions
Artigo nas normas da revista Letters in applied microbiology
Artigo 2: Antimicrobial activity of ozone treatment during alcoholic fermentation and its effect on anthocyanins and color of red wine
Artigo submetido à revista Food Chemistry
Artigo 3: Ozone effect on polyphenols content, antioxidant activity and volatile compounds of red wine
Artigo submetido à revista Food Chemistry
Artigo 4: Effects of continuous exposure to ozone gas and electrolyzed water on the skin hardness of table and wine grape varieties
8 ARTIGO 1
EFFECT OF OZONATION ON YEAST, LACTIC ACID BACTERIA AND
ACETIC ACID BACTERIA VIABILITY, IN VITRO, UNDER WINEMAKING
CONDITIONS
J. LAUREANO¹, L.R.A. FARONI¹*, M.C.D. VANETTI², M.R. ELLER³, P.H.A. SILVA³, P.R. CECON4, V.G. SOARES¹, R.R. SANTOS¹, G.L. MILIÃO³
¹Depto de Engenharia Agrícola, Universidade Federal de Viçosa, Viçosa-MG, 36570-000, Brazil
²Depto de Microbiologia, Universidade Federal de Viçosa, Viçosa-MG, 36570-000, Brazil
³Depto de Tecnologia de Alimentos, Universidade Federal de Viçosa, Viçosa -MG, 36570-000, Brazil
4Depto de Estatítica, Universidade Federal de Viçosa, Viçosa-MG, 36570-000, Brazil
*Corresponding author: [email protected]
9 Abstract
The purpose of this research was to investigate the effect of ozone in vitro on yeast, lactic bacteria and acetic bacteria viability, under winemaking conditions. The microorganisms were inoculated in sterile grape juice (pH 3.5 and 20 ºBrix), and the juice was subjected to ozonation at 0 to 7.5 mg L-1, for 10 min. A control treatment was conducted with SO2 (potassium metabisulfite 80 mg L-1). Cell quantification was performed before and after treatments. Ozone was more effective in reducing the population of lactic acid bacteria compared to SO2 treatment, even in the presence of grape nutrients under winemaking conditions. The higher ozone concentration (7.5 mg L-1) was the most efficient in reducing lactic acid bacteria; the bacteria were reduced by more than four log cycles. All of the ozone concentrations tested allowed the maintenance of the fermenting yeast. Ozone caused a reduction of acetic bacteria; however, the production of a biofilm may have affected the results.
Keywords: ozone, lactic bacteria, spoilage bacteria, sulfite, wine
1. Introduction
Winemaking can be understood as a complex biochemical process involving interactions between yeasts, lactic acid bacteria (LAB) and acetic acid bacteria (AAB) in grape juice (Pérez-Martín et al. 2015; Andorrà et al. 2010). Yeasts are most important because of their role in alcoholic fermentation (Bartowsky 2009).
Only a few genera of LAB commonly grow in grape must and wine, mainly Oenococcus spp., Lactobacillus spp., Leuconostoc spp. and Pediococcus spp. (Barata
10 controlled, LAB reduce wine acidity and contribute to aroma and flavor (Kántor et al. 2014). Oenococcus oeni is the most desirable species for malolactic fermentation development, and no important sensorial defect has been attributed to it (Lonvaud-Funel 1999). However, some LAB from other genera may be responsible for many wine spoilage problems that compromise quality and value (Kántor et al. 2014).
AAB are considered spoilage bacteria in wines (Bartowsky 2009), but their population is typically low on healthy grapes (102–103 colony forming units per gram (CFU g-1)). In grapes with gray rot, AAB populations can reach up to 105-106 CFU g-1, comprising mainly Acetobacter spp. and Gluconobacter spp. (Barata et al. 2012; Kántor et al. 2015), and Gluconobacter oxydans is the most representative species (Bartowsky and Henschke 2008). AAB are able to spoil the wine by ethanol acidification, and their growth on grapes and must could modify the must composition and, by consequence, the ecological equilibrium of yeast and LAB growth during alcoholic and malolactic fermentation (González-Arenzana et al. 2015). Wines contaminated by AAB have characteristic volatility, sourness like vinegar on the palate, a range of acetic, nutty, sherry-like, solvent or bruised apple aromas and frequently reduced fruity characteristics, which have negative effects on wine quality (Bartowsky et al. 2003; Andorrà et al. 2008).
11 Ozone is a powerful antimicrobial agent, and it has been approved by the FDA as a direct additive to food since 2001 (Öztekin et al. 2006; Patil et al. 2011; Segat et al. 2014; Feliziani et al. 2014). Ozone has a non-specific action and has been shown to be active against all microbiological forms: fungi, bacteria, virus and spores (Khadre et al. 2001; Mylona et al. 2014; Petry et al. 2014; Torlak 2014; Dev Kumar et al. 2016). Its high reactivity ensures the complete disappearance of its residues in the environment after just a few minutes of treatment (Khadre et al. 2001; Botondi et al. 2015).
Ozonation has been proposed at different stages of wine production to reduce the spoilage microbiota in grapes and to provide sanitation of barrels, tanks, hoses and bottles (Coggan 2003; Hester 2006; Guillen et al. 2010; Guzzon et al. 2013), but no information is available about the use of ozone directly in the must. Moreover, relatively little information is available about its effects on microorganisms when applied in the presence of grape nutrients. It is known that organic substances present in the food matrix can compete for ozone and provide protective effects to microorganisms (Guzel-Seydim et al. 2004; Joshi et al. 2013).
The purpose of this research was to investigate the in vitro the effect of ozonation on yeast, LAB and AAB viability in the presence of grape nutrients and under conditions usually found in the early stages of wine production.
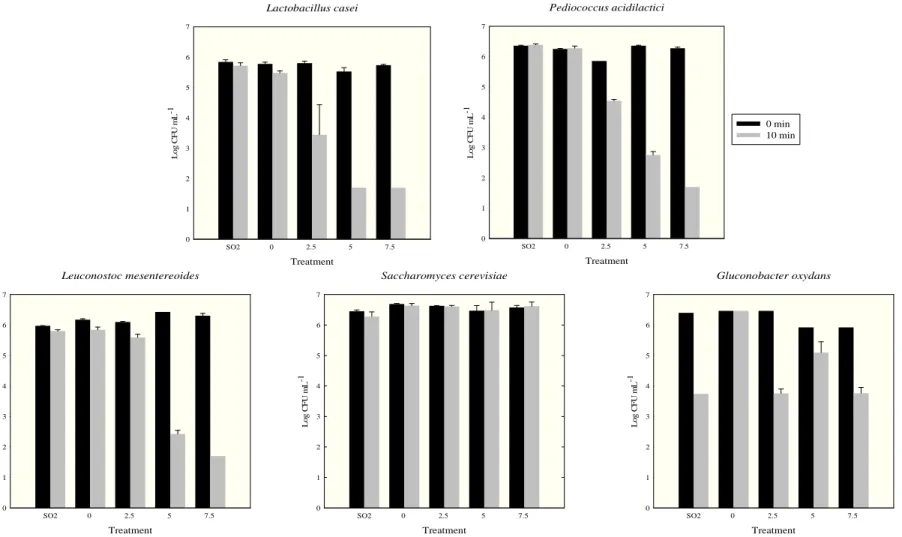
2. Results and discussion
12 treatments with 2.5, 5 and 7.5 mg L-1 of ozone, respectively. The reductions were significantly greater, according to Dunnet’s test (P < 0.05), than those obtained using SO2. Although bacteria from the genus Lactobacillus participate in malolactic fermentation, inhibiting their growth can improve the quality of wine because they convert glycerol into 3-hydroxypropionaldehyde (3-HPA) during anaerobic fermentation. The accumulation of 3-HPA can affect wine quality due to its spontaneous conversion to acrolein under winemaking conditions. This substance is not only dangerous for living cells; it is also related to the development of unpleasant bitterness when combined with polyphenols in wine (Bauer et al. 2010).
Pediococcus acidilactici was reduced by 1.3, 3.6 and 4.6 log cycles at ozone
concentrations of 2.5, 5 and 7.5 mg L-1, respectively, and these were reductions greater (P < 0.05) than those that occurred upon treatment with SO2. P. acidilactici is another lactic acid bacterium that performs malolactic fermentation and produces exopolysaccharide (EPS) (Bartowsky 2009). Wines with high EPS have elevated viscosity, which is sometimes observed during vinification or after bottling. Such wines cannot be sold due to their abnormal viscosity, which represents a serious problem for wine producers and merchants, resulting in considerable economical loss (Montersino et al. 2008).
Leuconostoc mesenteroides had its cell counts reduced to 4 and
13 demonstrates its potential as a sulfite substitute that avoids the viscosity problem in wines.
14
Lactobacillus casei
Treatment
SO2 0 2.5 5 7.5
L o g C F U m L -1 0 1 2 3 4 5 6 7 Pediococcus acidilactici Treatment
SO2 0 2.5 5 7.5
L o g C F U m L -1 0 1 2 3 4 5 6 7 0 min 10 min Leuconostoc mesentereoides Treatment
SO2 0 2.5 5 7.5
L o g C F U m L -1 0 1 2 3 4 5 6 7 Saccharomyces cerevisiae Treatment
SO2 0 2.5 5 7.5
L o g C F U m L -1 0 1 2 3 4 5 6 7 Gluconobacter oxydans Treatment
SO2 0 2.5 5 7.5
L o g C F U m L -1 0 1 2 3 4 5 6 7
15 Practically no reduction of S. cerevisiae viability was observed under any ozone treatment performed for 10 min. Pascual et al. (2007) found that yeasts are more resistant to ozonethan bacteria. However, Guzzon et al. (2013) found that 7 mg L-1 of ozone completely inactivated 106 CFU mL-1 of S. cerevisiae in distilled water when applied for 30 min. This shows that increasing the time of exposure to ozone may strongly inhibit microorganisms, and it suggests that ozone may be more effective in the absence of organic compounds. Considering the importance of S. cerevisiae to winemaking, the yeast resistance to ozone concentration that is enough
to eliminate undesirable bacteria is an important result. S. cerevisiae is responsible for the conversion of sugar to alcohol (González-Arenzana et al. 2015), and bacteria that grow during alcoholic fermentation can compete for nutrients or produce secondary metabolites, restricting the growth of fermentative yeasts (Fleet 2003). Therefore, the inhibitory effect of ozone on bacteria promotes the predominance of yeasts during the initial step of winemaking. This favors yeast fermentation.
16 the exocellular matrix that characterizes the biofilm can promote the resistance of the cells to ozone. Tristezza et al. (2010) stated that biofilms may cause an increase in tolerance to biocides and antibiotics (100-fold greater resistance) compared to the same microorganisms in a free-floating state. AAB species are catalase-positive, and the presence of this enzyme may allow cells to detoxify themselves and become more resistant to oxidative stress (Serrazanetti et al. 2009). This would allow them to resist the effects of reactive oxygen species formed during ozone treatments (Tiwari et al. 2009).
Ozone acts initially on the cell membrane, and its antimicrobial action is due to oxidation of glycolipids, amino acids and glycoproteins in the cell wall, which changes the membrane permeability and causes rapid lysis. Ozone also attacks sulfhydryl groups in enzymes, disabling certain cellular enzyme activities. Moreover, its action on the nuclear material of microorganisms alters the purine and pyrimidine bases of nucleic acids (Silva et al. 2011). In addition to the molecular ozone action, the antimicrobial activity may also be to due oxidative stress initiated by the intermediate radicals •OH, •O2-, HO2• and •O3- that result from ozone decomposition (Serrazanetti et al. 2009; Tiwari et al. 2009).
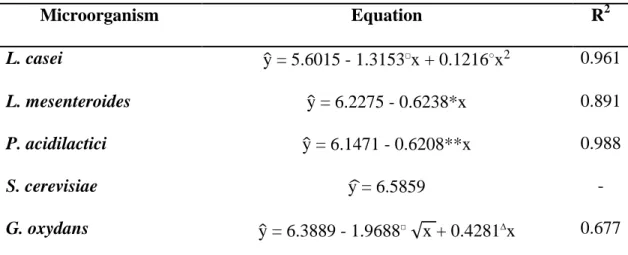
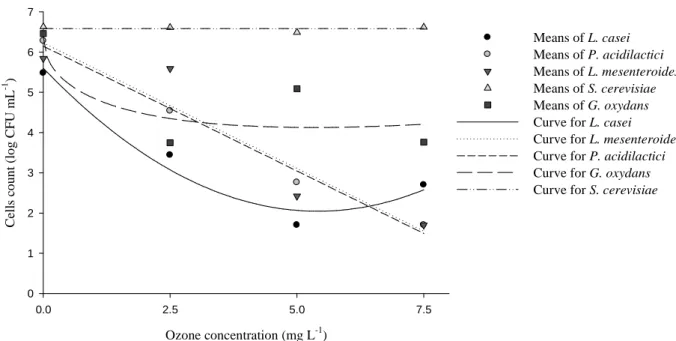
17 Regression equations were adjusted for cells counts as a function of ozone concentrations to analyze the differences between ozone treatments (Table 1). The adjusted models showed a significant linear effect of ozone on L. mesenteroides and P. acidilactici viability (P < 0.10 and P < 0.05, respectively), i.e., the populations
decreased linearly with increasing ozone concentrations. The effect of ozone on L. casei had a quadratic adjustment, reaching a minimum point at 5.41 mg L-1 of ozone. The reduction of G. oxydans populations with increasing ozone concentration had a square root effect, with the minimum at 5.29 mg L-1 of O3. The effect of ozone on S. cerevisiae survival was not significant and the estimative of cells was equal the overall mean for any ozone concentration. The respective curves that estimate the number of viable cells after treatment are shown in Figure 2.
Table 1. Regression equation for cells count (y, CFU mL-1) vs. ozone concentration (x, mg L-1)
Microorganism Equation R2
L. casei y = 5.6015 - 1.3153□x + 0.1216○x2 0.961 L. mesenteroides y = 6.2275 - 0.6238*x 0.891 P. acidilactici y = 6.1471 - 0.6208**x 0.988
S. cerevisiae y = 6.5859 -
G. oxydans y = 6.3889 - 1.9688□√x + 0.4281∆x 0.677
* Significative to 5%; ** significative to 1%; □ significative to 10%; ○ significative to 15%;
18
Ozone concentration (mg L-1)
0.0 2.5 5.0 7.5
C el ls c o u n t (l o g C F U m L -1 ) 0 1 2 3 4 5 6 7
Means of L. casei Means of P. acidilactici Means of L. mesenteroides Means of S. cerevisiae Means of G. oxydans Curve for L. casei Curve for L. mesenteroides Curve for P. acidilactici
Curve for G. oxydans Curve for S. cerevisiae
Figure 2. Curves to estimative of cells (CFU mL-1) vs. ozone concentration (mg L-1)
In general, the results confirmed that gram-positive bacteria are more sensitive to ozone than yeasts, as previously verified by Pascual et al. (2007). Ozone as a biocide has an advantageous mechanism action, which destroys the microorganism through cell lysis and does not lead to microorganism resistance (Pascual et al. 2007).
In conclusion, ozone was more effective in reducing the populations of LAB compare to SO2 treatment, even in the presence of grape nutrients under winemaking conditions. The highest ozone concentration tested (7.5 mg L-1) was the most effective, reducing the population by more than four log cycles while still allowing survival of fermenting yeast. Although the results of ozone effectiveness on AAB have shown a reduction in microbial cell number, the production of a biofilm by G. oxydans may have affected the results. More studies are needed to find ways to
19 3. Materials and methods
3.1.Preparation of grape juice
Fresh Niagara Rosada grapes (Vitis labrusca L. x Vitis vinifera L.), cultivated in Southeast Minas Gerais, Brazil, were split from bunches and crushed using a domestic juice extractor (Arno, São Paulo, Brazil). Juice was filtered on a cotton cloth to remove skin, seeds and pulp. The total soluble solids content was adjusted to 18 ºBrix with granulated sugar cane, and the must was frozen at -18 ºC until processing. Approximately 500 mL of frozen juice were thawed for 4 hours at 20 ºC, centrifuged at 15300 × g in a Beckman J2-MI Centrifuge (Beckman Instruments, Inc., Palo Alto, CA, USA) for 10 min and autoclaved (121 ºC, 1.5 kgf for 15 min). Sterilized juice was maintained at 8 ± 2 ºC until use. The final grape juice pH was 3.5.
3.2.Preparation of inoculum
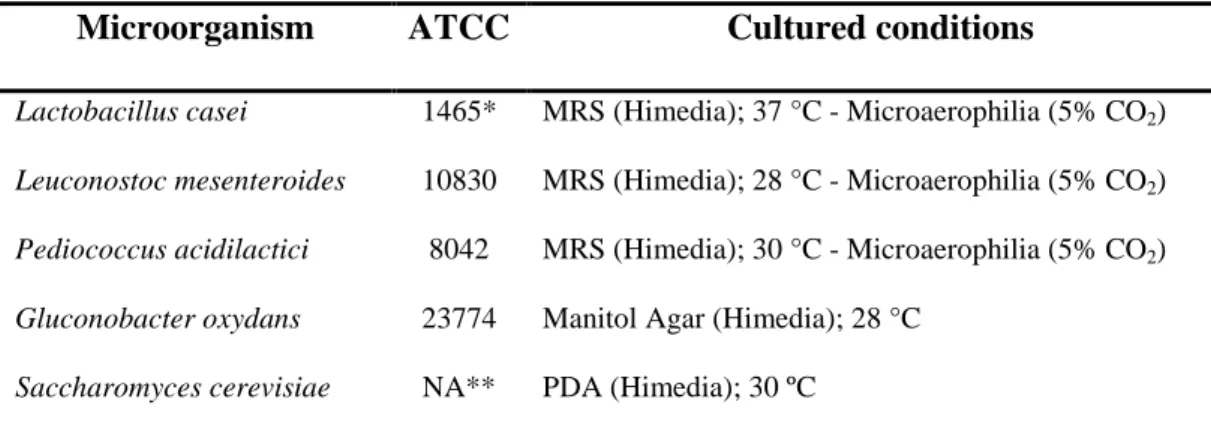
The microorganisms were obtained from the Tropical Foundation André Tosello (Campinas, SP, Brazil), Bioagro collection (BIOAGRO, Department of Microbiology, Federal University of Viçosa, MG, Brazil) and the Indupropil Commerce (Ijuí, RS, Brazil) (Table 2). Microorganisms were cultured in growth media according to the requirements of different species, as described in Table 2.
20 absorbance at 600 nm in a BioMate5 spectrophotometer (THERMO Scientific, Woburn, MA, USA), using a calibration curve that was previously prepared, as described by Begot et al. (1996). Then, the cell suspension was diluted to approximately 108 CFU mL-1.
Table 2. List of microorganisms studied and culture conditions for each one
Microorganism ATCC Cultured conditions
Lactobacillus casei 1465* MRS (Himedia); 37 °C - Microaerophilia (5% CO2)
Leuconostoc mesenteroides 10830 MRS (Himedia); 28 °C - Microaerophilia (5% CO2)
Pediococcus acidilactici 8042 MRS (Himedia); 30 °C - Microaerophilia (5% CO2)
Gluconobacter oxydans 23774 Manitol Agar (Himedia); 28 °C
Saccharomyces cerevisiae NA** PDA (Himedia); 30 ºC
*CCT; **Not available – commercial product (Refer. Blastosel FR 95)
3.3.Ozone treatment
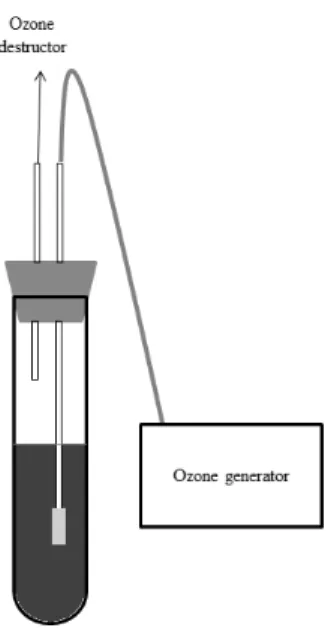
21 Because of this, the ozone concentration in the system was recorded by an iodometric method (Rice 2012). Residual ozone was destroyed using an Ozone Destroyed Unit (O&LM). A control treatment was made using potassium metabisulfite at 80 mg L-1 as the source of SO2 (Rizzon et al. 1996).
Figure 3. Scheme of ozone application system
3.4.Microbiological analyses
22 treatments, in two replicates. Due to sterilization of the juice before use, the counts at time 0 min represented the total population of each microorganism.
3.5.Statistical analyses
The experiment had a completely randomized design with five treatments and two replicates. Statistical analyses were performed using the statistical software package SAEG 9.0 (Federal University of Viçosa). To compare the effect of ozone on microorganism populations to the effect of SO2 (control treatment) Dunnet’s test (P < 0.05) was performed. The results for ozone treatments were also used for regression analysis. The models were chosen based on the significance of the regression coefficients (using Student’s t-test at a level of 15% probability), using the determination coefficient (R2), and by considering biological phenomena. The graph was generated using SigmaPlot 10.0.
Acknowledgments
The author Juliane Laureano is grateful to CNPq for a scholarship. The authors also would like to thank FAPEMIG for financial support and Monique Renon Eller for kindly allowing us the use of her laboratory.
Conflict of interest
23 References
Andorrà, I., Landi, S., Mas, A., Esteve-Zarzoso, B. and Guillamón, J.M. (2010) Effect of fermentation temperature on microbial population evolution using culture-independent and dependent techniques. Food Res Int 43, 773–779. Andorrà, I., Landi, S., Mas, A., Guillamòn, J.M. and Esteve-Zarzoso, B. (2008)
Effect of oenological practices on microbial populations using culture independent techniques. Food Microbiol 25, 849– 856.
Artés-Hernández, F., Aguayo, E., Artés, F. and Tomás-Barberán, F.A. (2007) Enriched ozone atmosphere enhances bioactive phenolics in seedless table grapes after prolonged shelf life. J Sci Food Agric 87, 824–831.
Artés-Hernández, F., Tomás-Barberán, F.A. and Artés, F. (2006) Modified atmosphere packaging preserves quality of SO2-free 'Superior seedless' table grapes. Postharvest Biol Technol 39, 146-154.
Barata, A., Malfeito-Ferreira, M. and Loureiro, V. (2012) The microbial ecology of wine grape berries. Int J Food Microbiol 153, 243-259.
Bartowsky, E.J. (2009) Bacterial spoilage of wine and approaches to minimize it. Lett Appl Microbiol 48, 149–156.
Bartowsky, E.J. and Henschke, P.A. (2008) Acetic acid bacteria spoilage of bottled red wine—A review. Int J Food Microbiol 125, 60–70.
Bartowsky, E.J., Xia, D., Gibson, R.L., Fleet, R.L., Henschke, P.A. (2003) Spoilage of bottled red wine by acetic acid bacteria. Lett Appl Microbiol 36, 307–314. Bauer, R., Du Toit, M. and Kossmann, J. (2010) Influence of environmental
parameters on production of the acrolein precursor 3-hydroxypropionaldehyde by Lactobacillus reuteri DSMZ 20016 and its accumulation by wine lactobacilli. Int
24 Begot, C., Desnier, I., Daudin, J.D., Labadie, J.C. and Lebert, A. (1996) Recommendations for calculating growth parameters by optical density measurements. J Microbiol Methods 25, 225-232.
Botondi, R., De Sanctis, F., Moscatelli, N., Vettraino, A.M., Catelli, C. and Mencarelli, F. (2015) Ozone fumigation for safety and quality of wine grapes in postharvest dehydration. Food Chem 188, 641–647.
Coggan, M. (2003) Ozone in wineries part 1 – getting beyond myths and mistakes. Vineyard & Winery Management 29, 1-13.
Dev Kumar, G., Williams, R.C., Sumner, S.S. and Eifert, J.D. (2016) Effect of ozone and ultraviolet light on Listeria monocytogenes populations in fresh and spent chill brines. Food Control 59, 172-177.
Feliziani, E., Romanazzi, G. and Smilanick, J.L. (2014) Application of low concentrations of ozone during the cold storage of table grapes. Postharvest Biol Technol 93, 38 – 48.
Fleet, G.H. (2003) Yeast interactions and wine flavor. Int J Food Microbiol 86, 11 – 22.
García-Ruiz, A., Moreno-Arribas, M.V., Martín-Álvarez, P.J. and Bartolomé, B. (2011) Comparative study of the inhibitory effects of wine polyphenols on the growth of enological lactic acid bacteria. Int J Food Microbiol 145, 426–431. González-Arenzana, L., Portu, J., López, R., López , N., Santamaría, P.,
Garde-Cerdán, T. and López-Alfaro, I. (2015) Inactivation of wine-associated microbiota by continuous pulsed electric field treatments. Innovative Food Sci Emerging Technol 29, 187–192.
25 Guzel-Seydim, Z.B., Bever, P.I., Jr. and Greene, A.K. (2004) Efficacy of ozone to reduce bacterial populations in the presence of food components. Food Microbiol 21, 475-479.
Guzzon, R., Nardin, T., Micheletti, O., Nicolini, G. and Larcher, R. (2013) Antimicrobial activity of ozone. Effectiveness against the main wine spoilage microorganisms and evaluation of impact on simple phenols in wine. Aust J Grape Wine Res 19, 180-188.
Hester, T. (2006) New Brett solution arrives in Australia. Aust N Z Grapegrow Winemak 512, 77-79.
Jett, B.D., Hatter, K.L., Huycke, M.M. and Gilmore, M.S. (1997) Simplified agar plate method for quantifying viable bacteria. Biotechniques 23, 648–650.
Joshi, R.K., Alagusundaram, M.K., Norton, T. and Tiwari, B.K. (2013) Novel disinfectants for fresh produce. Trends Food Sci Technol 34, 54-61.
Kántor, A., Kačániová, M. and Kluz, M. (2015) Natural microflora of wine grape berries. J Microbiol, Biotechnol Food Sci 4, 32-36.
Kántor, A., Kačániová, M., Petrová, J., Medo, J., Hleba, L. and Rovná, K. (2014) Identification of lactic acid bacteria isolated from red wine samples by RT-qPCR. J Microbiol, Biotechnol Food Sci 3, 235-237.
Khadre, M.A., Yousef, A.E. and Kim, J.G. (2001) Microbiological aspects of ozone applications in food: a review. J Food Sci 66, 1242–1252.
König, H. and Fröhlich, J. (2009) Lactic acid bacteria. In: Biology of Microorganisms on Grapes, in Must and in Wine ed. König, H., Unden, G. and
Fröhlich, J. pp. 3–29. Berlin Heidelberg: Springer-Verlag.
26 Montersino, S., Prieto, A., Munoz, R. and De Las Rivas, B. (2008) Evaluation of exopolysaccharide production by Leuconostoc mesenteroides strains isolated from wine. J Food Sci 73(4), 196-199.
Morton, R.D. (2001) Aerobic plate count. In: Compendium of methods for the microbiological examination of foods ed. Downes, F.P. and Ito, K. pp. 66 –67. 4
ed. Washington: American Public Health Association.
Mylona, K., Kogkaki, E., Sulyok, M. and Magan, N. (2014) Efficacy of gaseous ozone treatment on spore germination, growth and fumonisin production by Fusarium verticillioides in vitro and in situ in maize. J Stored Prod Res 59,
178-184.
Öztekin, S., Zorlugenç, B. and Zorlugenç, F.K. (2006) Effects of ozone treatment on microflora of dried figs. J Food Eng 75, 396–399.
Pascual, A., Llorca, I. and Canut, A. (2007) Use of ozone in food industries for reducing the environmental impact of cleaning and disinfection activities. Trends Food Sci Technol 18, 29-35.
Patil, S., Valdramidis, V.P., Tiwari, B.K., Cullen, P.J. and Bourke, P. (2011) Quantitative assessment of the shelf life of ozonated apple juice. Eur Food Res Technol 232, 469-477.
Pérez-Martín, F., Seseña, S. and Palop, M.L. (2015) Inventory of lactic acid bacteria populations in red wine varieties from Appellation of Origin Méntrida. Eur Food Res Technol 240, 725–733.
27 Rice, E.W. and Bridgewater, L. (2012) Standard methods for the examination of water and wastewater. American Public Health Association. Washington, D.C. https://www.standardmethods.org Accessed 26 april 2015.
Rizzon, L.A., Zanuz, M.C. and Manfredini, S. (1996) O emprego do metabissulfito de potássio. In: Como elaborar vinho de qualidade na pequena propriedade, 2ª ed., 14pp. Embrapa: Bento Gonçalves.
Segat, A., Biasutti, M., Iacumin, L., Comi, G., Baruzzi, F., Carboni, C. and Innocente, N. (2014) Use of ozone in production chain of high moisture Mozzarella cheese. LWT-Food Sci Technol 55, 513-520.
Serrazanetti, D.I., Guerzoni, M.E., Corsetti, A. and Vogel, R. (2009) Metabolic impact and potential exploitation of the stress reactions in lactobacilli. Food Microbiol 26, 700–711.
Silva, S.B., Luvielmo, M. de M., Geyer, M.C. and Prá, I. (2011) Potencialidades do uso do ozônio no processamento de alimentos. Semina: Cienc Agrar 32(2), 659-682.
Tiwari, B.K., O’donnell, C.P., Patras, A., Brunton, N. and Cullen, P.J. (2009) Effect of ozone processing on anthocyanins and ascorbic acid degradation of strawberry juice. Food Chem 113, 2824–2829.
Torlak, E. (2014) Efficacy of ozone against Alicyclobacillus acidoterrestris spores in apple juice. Int J Food Microbiol 172, 1–4.
28 ARTIGO 2
ANTIMICROBIAL ACTIVITY OF OZONE TREATMENT DURING ALCOHOLIC FERMENTATION AND ITS EFFECT ON THE
ANTHOCYANINS AND COLOR OF RED WINE
Juliane Laureano¹, Lêda R. A. Faroni¹*, Paulo H. A. Silva², Maria C. D. Vanetti³, Monique R. Eller², Paulo R. Cecon4, Tamara B. O. Freitas², Patrícia H. Ribeiro¹,
Lucas H. F. Prates¹
¹Depto de Engenharia Agrícola, Universidade Federal de Viçosa, Viçosa-MG, 36570-000, Brazil
²Depto de Tecnologia de Alimentos, Universidade Federal de Viçosa, Viçosa -MG, 36570-000, Brazil
³Depto de Microbiologia, Universidade Federal de Viçosa, Viçosa-MG, 36570-000, Brazil
4Depto de Estatítica, Universidade Federal de Viçosa, Viçosa-MG, 36570-000, Brazil
29 Abstract
This work investigated the effect of ozone on yeasts, lactic bacteria (LAB) and acetic bacteria (AAB) during fermentation, as well as its effect on the anthocyanins content and color of wine compared with sulfite. Wines were produced with a Syrah cultivar grape for 15 days. Ozone was applied at different concentrations (2 - 12 mg· L-1) and times (5 – 25 min) at days 1, 6 and 16 of fermentation. Analyses of anthocyanins and color parameters were performed at the end of fermentation. The yeasts, LAB and AAB were not affected by the ozone treatments. The wines treated with higher ozone concentrations acquired characteristics of mature wine, presenting with decreased monomeric anthocyanins, and increased percent of polymeric color, yellow/brown shades and tonality. This suggests that the use of ozone as a substitute for sulfite may confer aging characteristics to wine in terms of color and may contribute to reducing the time for maturation.
30 1. Introduction
Transforming grape must to wine is a complex biochemical process involving interactions between yeasts, lactic acid bacteria (LAB) and acetic acid bacteria (AAB) (Andorrà, Landi, Mas, Guillamòn & Esteve-Zarzoso, 2008). Represented by its flavor and aroma, wine quality is influenced by the metabolism of these microorganisms (Swiegers, Bartowsky & Henschke, 2005). The role of yeast is to perform fermentation by converting sugars into ethanol (Suárez-Lepe & Morata, 2012). LAB influences wine flavor. However, their growth has also been correlated to producing off-flavors and increasing wine viscosity in the bottle (Montersino, Prieto, Munoz & De Las Rivas, 2008). Similarly, AAB growth generates undesirable compounds, such as acetic acid and ethyl acetate, which have a negative effect on wine quality (Andorrà et al., 2008).
Sulfur dioxide (SO2) application and yeast inoculation are well-established practices in winemaking to restrict the growth of endogenous yeasts and bacterial populations (Andorrà et al., 2008). Despite its well-established ability to control microorganisms, numerous adverse effects on human health have been linked to the ingestion of SO2 (Garaguso & Nardini, 2015). Moreover, SO2 is highly corrosive to metals (Cayuela, Vázquez, Pérez & García, 2009), which compels researchers to search for alternative methods to control microorganisms during the fermentation step.
31 (Khadre, Yousef & Kim, 2001), it could be used to control or eliminate undesirable microorganisms in wine production. Relatively low concentrations of ozone and short contact times are adequate to reduce microbial numbers. Additionally, ozone spontaneously decomposes to molecular oxygen, resulting in no toxic residues (Tiware et al., 2009a). Ozone results in controlled oxidation that can be sensorially beneficial to red wine by enhancing and stabilizing its color and reducing its astringency (Oliveira, Ferreira, Freitas & Silva, 2011). However, doses sufficient to eliminate some microorganisms may cause prejudicial sensorial modifications to the wines. Tiware et al. (2009a) found that ozone caused a significant reduction in color and anthocyanin content when applied to grape juice.
Normally, the color of a wine is the first characteristic perceived by a consumer. Consequently, it conditions a global sensorial analysis of the wine. In young red wines, the color is determined by monomeric anthocyanins, which are pigments mainly located in the skin of grape berries (He et al., 2012). During maturation, polymeric pigments more stable to pH changes are formed (Gutiérrez, Lorenzo & Espinosa, 2005). The nature of anthocyanins, their extraction during winemaking and their final content influence the sensory characteristics of wine and, as a result, their acceptance by a consumer (Giacosa, Marengo, Guidoni, Rolle & Hunter, 2015). Moreover, this compound presents potential benefits for human health and disease prevention (Tiware et al., 2009b).
32 degradation of anthocyanin content and, thus, changes in color of the wine. However, such supposed effects need to be confirmed.
The purpose of this work was to investigate the effect of ozone on yeasts, LAB and AAB during fermentation, as well as on the anthocyanin content and parameters of color of red wine.
2. Materials and Methods 2.1.Grapes
The study was performed with Vitis vinifera L. cultivar Syrah grown at a vineyard located in South-East Brazil (Minas Gerais State). Grapes were manually harvested with approximately 17 °Brix and transported to the laboratory. After the grapes were manually crushed and destemmed, the must was maintained at -18 ºC until winemaking. This practice is considered a valid research tool for producing experimental wines outside of vintage or in distant places of a vineyard (Schmid, Li, Liebich, Culbert, Day & Jiranek, 2007).
2.2.Winemaking procedure
Wines were produced using microvinification. Approximately 4 L of frozen must was thawed overnight (12 h) for each treatment. Musts received the first-stage of treatments (day 1) (as described in the following section). They were then placed into a stainless steel tank for fermentation. Active dry yeasts (Saccharomyces cerevisiae, Blastosel FR 95, Indupropil, Ijuí, Brazil) were added in the proportion of
33 The soaking period of the skins was 6 days. After this, musts without skins were transferred to a flask glass with hydraulic stopper, where the second stage of treatments was performed (day 6). Alcoholic fermentation was a total of 15 days. When complete (at 16 day), a second solids separation method and application of the last stage of treatments were performed. All processes were performed at 20 ºC.
The progression of alcoholic fermentation was monitored daily by measuring the sugar content of the fermenting must with each treatment. A digital hand-held refractometer with temperature compensation (Pal-3 model, Atago Corporation, Tokyo, Japan) was used. Malolactic fermentation was not made. Bottling was performed manually at 16 day in bottles of 750 mL that were sealed with cork stoppers. The bottles were stored in a dry and ventilated area at room temperature that was protected from light.
2.3.Ozonation
Ozone treatments were carried out (at day 1, 6 and 16) in a mechanically agitated bioreactor with a capacity of 8 L. Ozone gas was produced by a generator (O&LM model, Ozone & Life, São José dos Campos, Brazil) that was fed by an oxygen cylinder (White Martins, Juiz de Fora, Brazil). Extrinsic parameters of ozone concentration (2 – 12 mg· L-1) and treatment time (5 – 25 min) were varied. The gas flow rate was 0.37 L·min-1. Ozone concentration was monitored by the Iodometric method (Rice & Bridgewater, 2012). Two trials were performed for each ozone concentration and treatment time.
34 dioxide content in 30 mg· L-1. A control treatment was also carried out without ozone or SO2.
2.4.Microbiological analyses
For microbiological analysis, aliquots of 1 mL were withdrawn at days 1, 6 and 16 of fermentation, immediately after treatments with ozone. The aliquots were serially diluted in a sterile saline peptone solution (0.1% peptone, 0.85% NaCl). A surface spread method was used for the quantification of yeasts (PDA – Himedia) and AAB (WL agar – Himedia), which were incubated at 30 ºC for 5 days and 28 ºC for 4 days, respectively. To determine LAB quantity, aliquots of 20 µL were plated (MRS agar – Himedia) using a microdot method (Morton, 2001) and incubated at 37 ºC for 24 h in ambient microaerophilic conditions. The different colonies from each plate were analyzed using an optical microscope by Gram staining and tested for catalase production. Gram-positive and catalase negative cells were considered to be LAB. Gram-negative and catalase positive cells were considered to be AAB. Colony-forming units (CFU) were counted as specified by the Organisation Internationale de la Vigne et du Vin (OIV) (OIV, 2014). All samples were analyzed
in duplicate. The viable numbers of cells obtained were transformed into log10 before statistical analysis and were expressed as CFU·mL-1.
2.5.Enological parameters
35 Anton Paar, Haryana, India) and was expressed in % v/v at 20 ºC and g·cm-3, respectively. Total acidity and volatile acidity were determined by titrimetry in accordance with official methods proposed by OIV (2014).
2.6.Anthocyanins determination
Total anthocyanin, polymeric and monomeric was determined using a method proposed by Cliff, King and Schlosser (2007) with modifications. Sample wines had their pH adjusted to 3.6 using 2 N NaOH or 2 N HCl and were centrifuged (J2-MI, Beckman Instruments Inc., Palo Alto, USA) at 1087 × g for 15 min at 20 ºC. As the first step, aliquots were diluted 1:10 with model wine (5 g· L-1 tartaric acid, 12% ethanol, pH 3.6). The absorbance was measured at 520 nm (Adil) with a spectrophotometer (BioMate5, Thermo Scientific, Woburn, USA) using a 10 mm cuvette. In the second step, aliquots of 4 mL of each sample were mixed with 320 µL of 5% SO2 (v/v) (as NaHSO3 solution). The absorbance was measured using 1 mm cuvette (ASO2). The results were expressed in absorbance units (a.u.), taking into
account the dilution and the different thickness of cuvettes (Adil = Abs × 4 and ASO2 = Abs × 2.16).
The different anthocyanins fractions were determined by equations 1 to 3.
Total anthocyanin = Adil Eq. 1
Polymeric anthocyanin = ASO2 Eq. 2 Monomeric anthocyanin = A + A Eq. 3
2.7.Polymeric color analysis
36 described by Giusti and Wrolstad (2001) were used to determine color density, polymeric color (color as a result of polymeric anthocyanins) and percent of polymeric color. Samples were diluted with distilled water to have an absorbance reading under 1.0 at 420 and 520 nm. To a test tube containing 3.0 mL of wine, 0.2 mL of K2S2O5 20% (bisulfite-bleached sample) was added. A control sample was performed with 0.2 mL of water. Samples were measured at λ = 420, 520, and 700 nm. Color density was calculated using a control sample according to Eq. 4:
Color density= A520-A700 + A420-A700 ×dilution factor Eq. 4
Polymeric color was determined using a bisulfite-bleached sample, according Eq. 5:
Polymeric color = A520-A700 + A420-A700 ×dilution factor Eq. 5 Percent of polymeric color was determined from color density and polymeric color (Eq. 6).
Percentage of polymeric color = polymeric
color density ×100 Eq. 6
2.8.Chromatic characteristics
To determine the wine color two methods were used: a CIELAB method and a spectrophotometric absorbance of the wine at 420, 520, and 620 nm (using a 1 mm cuvette).
37
C*= a*2 + b*2 Eq. 7
h* =arctg b*
a* Eq. 8
From the spectrophotometric absorbance of the wine at 420, 520, and 620 nm, color intensity and tonality were determined using equations 9 and 10:
Color intensity = A420+ A520+A620 Eq. 9
Tonality= A420 A520
Eq. 10
2.9.Statistical analyses
38 3. Results and Discussion
3.1.Ozone effects on the microorganisms during fermentation
The results of the viable cells number of yeasts, LAB and AAB analyzed at days 1, 6 and 16 of fermentation, after the treatments, are shown in Table 1.
The population of yeasts on the must at the first day after the treatments ranged from 5.5 to 6.4 log CFU·mL-1. At day 6 of fermentation, an increase in the yeast population in the must of the control, SO2 and ozone treatments at 7 mg· L-1 for 5, 15 and 25 min was observed. At the last day of fermentation (day 16), there was a downward trend of viable cells with a verified variation from under 3 to 5.6 log CFU·mL-1. This reduction at 16 day did not largely vary between the treatments. Such behavior probably indicates natural death of the yeasts that follows the reduction of available sugar and increase of ethanol concentration (Guzzon, Nardin, Micheletti, Nicolini & Larcher, 2013), which is not dependent on the treatment performed.
39 Table 1
Effect of treatments on microorganisms in red wine at days 1, 6 and 16 of fermentation. Results reported as mean values of log CFU·mL-1.
Treatments (mg· L-1 O3 / min)
Yeasts Acetic Bacteria Lactic Bacteria 1 d 6 d 16 d 1 d 6 d 16 d 1 d 6 d 16 d 2 / 5 6.4 5.6 5.1 5.4 <3 <3 <3 <3 <3 2 / 15 6.0 5.4 4.8 5.0 <3 <3 3.6 <3 <3 2 / 25 6.0 5.7 4.8 5.0 <3 <3 3.8 <3 <3 7 / 5 5.8 6.0 5.5 5.2 <3 <3 4.2 <3 <3 7 / 15 5.7 6.5 4.8 5.1 3.3 <3 3.5 <3 <3 7 / 25 5.5 6.2 5.6 4.9 <3 <3 4.0 <3 <3 12 / 5 6.3 6.3 <3 5.4 <3 <3 4.7 <3 <3 12 / 15 6.2 5.3 4.8 5.5 3.0 <3 3.7 <3 <3 12 / 25 6.3 5.8 4.0 5.1 3.3 <3 <3 <3 <3 SO2 6.3 7.7 5.0 4.3 <3 <3 <3 <3 <3 Control 6.2 7.4 5.0 5.5 <3 <3 <3 <3 <3 <3: under quantification limit of the utilized method for count cells
The LAB count ranged between under 3 and 4.7 logCFU·mL-1 at the first day of fermentation. This cell population was not recovered on the analyses carried out at 6 and 16 day of fermentation. It was below the detection limit of the adopted procedure (3 log CFU·mL-1) for all the treatments, including the control.
40 not present on the utilized grapes, eliminated with the solids in the wine transfers or in low numbers under the detection limit of the technique used.
3.2.Enological parameters
41 Table 2
Enological properties of wines Treatments
(mg·L-1 O3 / min)
Total Soluble Solids (ºBrix)
pH Alcohol
(% v/v at 20 ºC)
Density (g·cm-3)
Total Acidity (meq·L-1 tartaric
acid)
Volatile Acidity (meq·L-1 acetic
acid)
2 / 5 6.1 3.51 8.55 0.9857 106.09 1.01*
2 / 15 6.1 3.52 8.65 0.9856 106.21 1.03*
2 / 25 6.0 3.51 8.57 0.9859 104.08 0.89*
7 / 5 6.1 3.53 8.48 0.9861 96.15 0.91*
7 / 15 6.2 3.53 7.88 0.9869 92.16 1.03*
7 / 25 6.1 3.51 8.32 0.9864 93.66 0.96*
12 / 5 6.0 3.51 8.48 0.9858 104.75 0.96*
12 / 15 6.1 3.48 8.75 0.9858 108.91 0.87*
12 / 25 6.0 3.50 7.98 0.9864 107.61 0.94*
SO2 6.1 3.53 8.28 0.9861 112.34 2.51†
Control 6.0 3.51 8.38 0.9855 113.57 1.09*
*Differ from SO2 treatment in the column by Dunnet test (P < 0.05); †
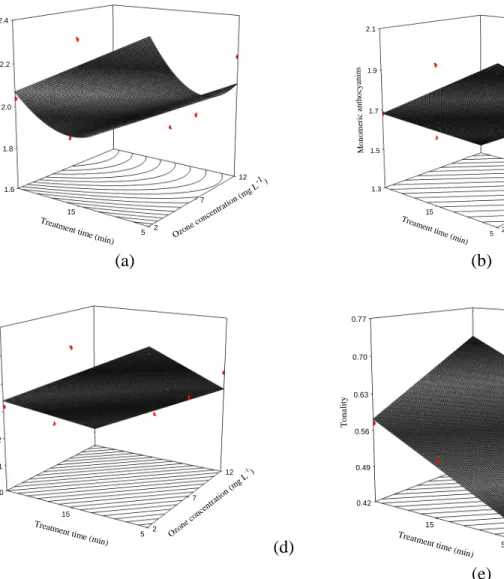
42 3.3.Ozone effects on the anthocyanin content of wine
43 Table 3
Total, polymeric and monomeric anthocyanins, color density, polymeric color and percentage of polymeric color of wines Treatments
(mg·L-1 O3 / min)
Total anthocyanins ¹
Polymeric anthocyanins ¹
Monomeric anthocyanins ¹
Color density Polymeric color Percentage of polymeric color
2 / 5 2.31 0.34 1.97 8.89 2.79 31.22
2 / 15 2.35 0.38 1.97 9.14 3.08 33.63
2 / 25 2.04 0.35 1.68 7.98 2.86 35.78
7 / 5 1.99 0.28 1.72 7.53 2.41 31.95
7 / 15 2.04 0.32 1.72 9.45 3.27 34.62
7 / 25 1.76 0.28 1.48* 7.28 2.67 36.65
12 / 5 2.20 0.38 1.82 8.28 2.96 35.74
12 / 15 1.79 0.33 1.45*† 7.92 3.98 49.66*†
12 / 25 1.73 0.40 1.34*† 7.63 3.85 50.03*†
SO2 2.02 0.26 1.76 8.26 2.58 31.11
Control 2.18 0.34 1.84 8.30 2.47 29.79
44 1.6 1.8 2.0 2.2 2.4 2 7 12 5 15 T o ta l an th o cy an in s Ozon e con
centra tion (
mg L -1 )
Treatment tim e (min) (a) 1.3 1.5 1.7 1.9 2.1 2 7 12 5 15 M o n o m er ic a n th o cy an in s Ozone conce ntratio n (mg
L-1 )
Tream ent tim
e (min)
(b) 25 30 35 40 45 50 55 2 7 12 5 15 % p o ly m er ic c o lo u r Ozone conce ntratio n (mg
L-1)
Treatment tim e (min) (c) 1.0 1.1 1.2 1.3 1.4 1.5 1.6 2 7 12 5 15 C o lo u r in te n si ty Ozon e con
cent ratio
n (m g L
-1)
Treatm ent time (min)
(d) 0.42 0.49 0.56 0.63 0.70 0.77 2 7 12 5 15 T o n a li ty Ozon e con
centra tion (
mg L -1)
Treatment tim
e (min)
(e)
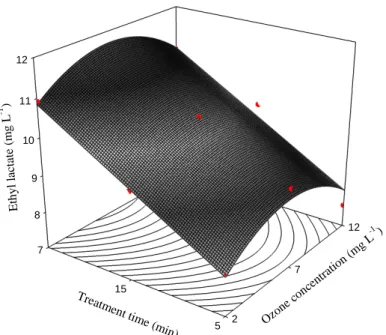
45 There was a trend in a reduction of the monomeric anthocyanins and increase in the polymeric ones with the intensification of the treatments. The same observation was reported by Cano-López, López-Roca, Pardo-Minguez and Gómez-Plaza (2010), who were studying the effects of micro-oxygenation on wine, and would be characteristic of wine aging. However, in the treatments with ozone at 2 mg· L-1 for 25 min, 7 mg· L-1 for 25 min and 12 mg· L-1 for 15 min, a reduction of both the monomeric and polymeric anthocyanins was observed with the increment of the treatment time. Such behavior may be due the higher oxidant power of ozone, which may have degraded the anthocyanins before the polymerization reactions. According to Xue, Chen and Wang (2008), beyond the ozone, the formation of high-reactive species as its secondary products, such as • , •, • and • , facilitates the
degradation of organic compounds. Anthocyanins contain aromatic rings, which may be opened by ozone and/or hydroxyl radicals (generated in an aqueous solution) due the formation of ozonide. Thus, the aromatic ring is broken down, and the degradation rapidly increases (Tiwari et al., 2009b). Moreover, reactions of polymerization and condensation of monomeric anthocyanins normally occur during wine maturation. In some cases, the time may not have been adequate (Oliveira et al., 2011).
3.4.Ozone effects on the polymeric color of wine
46 SO2 treatment. Color density quantifies the visual appearance of wine and has a strong positive correlation with wine quality (Somers & Evans, 1974). Its values ranged between 7.28 and 9.45. Polymeric color corresponds to the contribution of polymeric anthocyanins and brown pigments from oxidation to color (Wrolstad, 1976). Although there were no significant differences, the values were higher at 12 mg· L-1 of ozone at 15 and 25 min. From the observed results, the ozone treatments tested possibly did not cause enough oxidation of the pigments to significantly change the polymeric color of the wines. Good models for this parameter were not found in the regression analyses. Therefore, they were considered similar to the overall means (Table 4).
The percentage of polymeric color presented higher mean values in the treatments with 12 mg· L-1 of ozone for 15 and 25 min. They reached up to 50%. These means were significantly (P < 0.05) higher than the control and SO2 treatments (29.79 and 31.11%, respectively). The regression analysis was an adjusted model for the percentage of polymeric color. The response surface was plotted as a function of the ozone concentration and treatment time (Figure 1c). The quadratic effect for ozone concentration (P < 0.05) and linear effect for exposure time (P < 0.01) were verified (Table 4). According to the adjusted model, the total anthocyanins reached a minimum pf 4.06 mg· L-1 of ozone for any exposure time. For each minute of exposure to ozone, the percentage of polymeric color increased by 0.3925 when a constant ozone concentration was maintained.