Tese apresentada à Universidade Federal de Viçosa, como parte das exigências do Programa de Pós(Graduação em Engenharia Agrícola, para obtenção do título de
JAIRO ALEXANOER OSORIO SARAZ
Tese apresentada à Universidade Federal de Viçosa, como parte das exigências do Programa de Pós(Graduação em Engenharia Agrícola, para obtenção do título de
.
A Oios.
A Oeus, por todas as graças que proporciona a mim e à minha família. À professora Ilda de Fátima Ferreira Tinôco, pelo apoio, pela confiança, pela amizade e por ter sido parte fundamental no alcance de meus objetivos.
Ao professor Márcio Arêdes Martins, pelos ensinamentos, pela amizade e por despertar o meu interesse na área da Oinâmica dos Fluidos Computacional (CFO).
Ao professor Richard Gates, pela amizade e pela oportunidade de obter novos espaços na minha vida pessoal e profissional.
Ao professor Jadir Nogueira da Silva, pela amizade e pelos ensinamentos.
Aos professores Sérgio Zolnier, Fernando da Costa Baêta e José Helvécio Martins, pelos ensinamentos.
Ao Or. Ricardo P. Roberti, da Pif(Paf Alimentos.
À Universidade Nacional de Colômbia Sede Medellín, em especial ao Oepartamento de Engenharia Agrícola e de Alimentos.
Luciano, Cinara, Pedro, Samuel, Marilu, Oamiana, Alexandre, Marcos Magalhães, Fatinha, Michel e Kelles. Aos meus sobrinhos brasileiros Arthur e Laura, e colombianos Verônica, Fernando, Juan Jose, Juan Camilo, Esteban, Sofia e Oaniela.
JAIRO ALEXANOER OSORIO SARAZ, filho de Hector Jairo Osorio Arenas e Angela Maria Saraz Hernandez, nasceu na cidade de Medellín Colombia, Oepartamento de Antioquia, em 28 de junho de 1975.
Em 1992, iniciou o curso de Engenharia Agrícola pela Universidade Nacional de Colômbia, graduando(se em dezembro de 1998.
Em 2000, iniciou o curso de Especialização em Legislação Ambiental pela Universidade de Medellín de Colômbia, graduando(se em 2001.
Em julho de 2004, iniciou o Mestrado em Engenharia de Materiais pela Universidade Nacional de Colômbia, graduando(se em junho de 2006.
Em março de 2008, iniciou o Programa de Pós(Graduação em Engenharia Agrícola da Universidade Federal de Viçosa, Brasil, em nível de doutorado, com concentração na área de Construções Rurais e Ambiência.
RESUMO ... x
ABSTRACT ... xiii
GENERAL INTROOUCTION ... 1
REFERENCES ... 4
CHAPTER 1 ( AOAPTATION ANO VALIOATION OF A METHOOLOGY FOR OETERMING AMMONIA FLUX GENERATEO BY LITTER IN NATURALLY VENTILIATEO POULTRY HOUSES ... 6
1. INTROOUCTION ... 7
2. MATERIAL ANO METHOOS ... 8
2.1. Characteristics of the installation ... 9
2.2. Mass diffusion method proposed for determining ammonia mass flux denominated SMOAE ... 9
2.2.1. Measuring equipment ... 10
2.2.2. Appropriate time for ammonia capture ... 10
2.2.3. Location of the collector devices and collection of experimental data ... 11
2.2.4. Oetermination of the quantity of ammonia captured ... 11
2.3. The theoretical proposed SMOAE diffusion method and the mass
convection method ... 12
2.4. Statistical analyses ... 14
2.5. Acquisition of experimental data ... 15
3. RESULTS ANO OISCUSSION ... 16
4. CONCLUSIONS ... 25
5. ACKNOWLEOGEMENTS ... 25
6. REFERENCES ... 26
CHAPTER 2 ( VALIOATION OF A METHOOOLOGY FOR OETERMINATION OF AMMONIA FLUX GENERATEO IN POULTRY HOUSES SUBMITTEO TO NATURAL VENTILATION ... 30
1. INTROOUCTION ... 31
2. MATERIAL ANO METHOOS ... 32
2.1. Characteristics of the confinement ... 32
2.2. Quantification of the ammonia flux using the Saraz method SMOAE .... 33
2.2.1. Oetermination of the amount of ammonia captured by the SMOAE method ... 34
2.3. Validation of the method ... 35
2.4. Appropriate time for ammonia capture and gathering of experimental data ... 37
2.5. Acquisition of experimental data ... 37
3. RESULTS ANO OISCUSSION ... 38
4. CONCLUSIONS ... 45
5. ACKNOWLEOGEMENTS ... 45
3. OETERMINATION OF NH3 CONCENTRATION ANO AIR VELOCITY
OISTRIBUTIONS ... 52
3.1. Tracer gas ratio technique ( TGRT ... 53
3.2. PMUs and MAEMUs methods ... 54
3.3. Oekock method ... 56
3.4. Passive flux methods ... 57
3.4.1. Ferm tube (passive flux samplers) ... 57
3.4.2. SMOAE method proposed by Osorio (2011) ... 57
3.5. Model(based approach that uses mass balance ... 58
4. QUANTITATIVE ANALYSIS OF THE METHOOS ... 59
5. CONCLUSIONS ... 63
6. ACKNOWLEOGEMENTS ... 63
7. REFERENCES ... 63
CHAPTER 4 ( USE OF THE 3O CFO FOR OETERMINATION OF AMMONIA CONCENTRATION OISTRIBUTION IN NON(INSULATEO POULTRY HOUSES WITH NATURAL VENTILATION ... 68
1. INTROOUCTION ... 70
2. MATERIAL ANO METHOOS ... 72
2.1. Operating conditions ... 72
2.2. Experimental data collection ... 73
2.2.1. Acquisition of experimental data ... 73
2.3. Boundary conditions ... 75
2.4. Computational modeling ... 76
2.5. Validation of the model ... 77
3. RESULTS ANO OISCUSSION ... 78
4. CONCLUSIONS ... 88
CHAPTER 5 ( APPLICATION OF CFO FOR IMPROVEMENT OF THE NATURAL VENTILATION OF POULTRY HOUSES OURING THE NIGHT FOR
TEMPERATURE ANO AMMONIA CONCENTRATION CONTROL ... 93
1. INTROOUCTION ... 95
2. MATERIAL ANO METHOOS ... 96
2.1. Operational conditions of the experimental installation ... 96
2.2. Experimental data collection ... 97
2.2.1. Acquisition of experimental data ... 97
2.3. Boundary conditions ... 99
2.4. Computational modeling ... 100
2.5. Validation of the model ... 101
2.6. Cases in the proposed CFO model to improve the internal environment in the facilities during the evening ... 101
3. RESULTS ANO OISCUSSION ... 103
4. CONCLUSIONS ... 112
5. ACKNOWLEOGMENTS ... 112
OSORIO SARAZ, Jairo Alexander, O.Sc., Universidade Federal de Viçosa,
dezembro de 2010. !" # $# $%&!
! '$ ! ( )* +!& ,+ ! - $%! "! . !+/# ! !- &% .
Orientadora: Ilda de Fátima Ferreira Tinôco. Coorientadores: Márcio Arêdes Martins e Richard S. Gates.
A amônia (NH3), dentre os diversos gases poluentes gerados de
produção avícola, aquele mais investigado e considerado de maior importância, devido a seu efeito negativo na saúde e produtividade dos trabalhadores e dos animais. Apesar das pesquisas já terem trazido avanços significativos em termos de medidas mitigadoras ou minimizadoras da taxa de emissão de NH3
uso da ventilação natural. Assim, o objetivo, geral deste projeto foi de adaptar e validar um método simples para determinar a distribuição de fluxo de amônia oriunda da cama e emitida pelo aviário, da distribuição da concentração deste gás no ar, bem como a distribuição da temperatura e velocidades do ar em galpões avícolas tropicais e subtropicais para frangos de corte. Especificamente visou(se: i) Avaliar quanto a aplicabilidade dos principais métodos atualmente usados para a determinação de emissões de amônia gerada nos aviários fechados de frango de corte, e adaptar e avaliar um método, e analisar sua aplicabilidade em instalações abertas praticadas em países de clima tropical e subtropical; ii) Adaptar e validar uma metodologia para determinar o fluxo de amônia gerada por cama sobreposta praticada na avicultura de corte e outras; iii) Realizar medidas da concentração de amônia, da temperatura e da velocidade de ar no interior de aviários abertos, com base em trabalho experimental; iv) Oesenvolver e validar um modelo computacional, usando como ferramenta a Oinâmica de Fluidos Computacional (CFO), para determinar a distribuição de temperatura, de concentração de amônia, e de velocidade do ar no interior do galpão. Para determinar o fluxo de amônia da cama aviária e emissão emitida pelo galpão, foi adaptada e validada uma metodologia ao mesmo tempo precisa e de simples aplicação denominada “Método Saraz para Oeterminação de Emissões de Amônia” (Saraz Method for Oetermination of Ammonia Emissions ( SMOAE). Encontrou(se que os valores de fluxo obtidos pelo SMOAE não diferem dos reportados por outros trabalho, e que a metodologia pode ser usada para valores de concentrações de amônia maiores que 0,5 ppm no caso da cama. O método SMOAE, foi adaptado e validado para determinar o fluxo de NH3 emitida pelas laterais dos galpões
avícolas submetidos à ventilação natural. Verificou(se que o método proposto pode ser usado com confiabilidade em condições de ventilação natural com ventos maiores que 0,1 m s(1 e concentrações de NH3 maiores que 1 ppm.
Emissões no ar (MAEMU). Métodos tais como o método baseados em balanços de massas e aqueles de difusão passiva como o “Ferm Tube” e o SMOAE, indicam também poderem ser adaptados para as diferentes condições de operacionalidade dos galpões abertos. Com os dados experimentais de fluxo de amônia da cama aviaria obtidos pelo método SMOAE, de concentração de amônia, de velocidade do ar e de temperatura, foi aplicado e validado um modelo em Oinâmica dos Fluidos Computacional (CFO). Encontrou(se que o modelo teve uma boa correlação estatística com os dados experimentais, pelo qual este pode ser usado para predizer num tempo real o comportamento da distribuição de concentrações de NH3, de velocidade do ar e
de temperatura, no interior de instalações abertas com ventilação natural e com ventos incidentes e diferentes direções de entrada na lateral da instalação.
OSORIO SARAZ, Jairo Alexander, O.Sc., Universidade Federal de Viçosa,
Oecember, 2010. ! )& $% !$ $" ( ! $ !
# $# $%&!% $ ( )* !$ %0 & ! $+ & $ $% +!& !- $ . $
-& & 0 ) $". Adviser: Ilda de Fátima Ferreira Tinôco. Co(advisers: Márcio Arêdes Martins and Richard S. Gates.
Ammonia (NH3), among the various gas pollutants generated from
poultry production, is that most investigated and considered of greatest importance due to its negative effect on health and productivity of both workers and animals. Although research studies have already brought about significant advances in terms of mitigation measures or minimization of the NH3 emission
adapt and validate a simple method to determine the distribution of ammonia flow derived from the bed and emitted by the poultry house, the concentration distribution of this gas in the air, and the distribution of temperature and air velocities in broiler houses located in tropical and subtropical regions. Specifically it was sought to: i) Assess the applicability of the principal methods currently used for the determination of ammonia emissions generated in closed poultry broiler, and adapt and evaluate a method to analyze its applicability in open installations in countries tropical and subtropical climates, ii). Adapt and validate a methodology for determining ammonia flux generated by litter in poultry production and other activities; iii) Perform measurements of ammonia concentration, temperature and air velocity inside the open poultry installations, based on experimental work, iv). Oevelop and validate a computational model, using computational fluid dynamics (CFO) to determine the distribution of temperature, ammonia concentration and air velocity inside the building. To determine the flow of ammonia emission from poultry manure and emission by the installation, a precise and simple methodology called the Saraz Method for Oetermining Ammonia Emissions (SMOAE) was adapted and validated. It was found that the flow values obtained by the SMOAE did not differ from those reported by other works, and that the methodology can be used for ammonia concentrations greater than 0.5 ppm in the case of the bedding. The SMOAE method was adapted and validated to determine the NH3 flux emitted by the
lateral openings of poultry buildings submitted to natural ventilation. It was verified that proposed method may be reliably used in natural ventilation conditions with wind speeds greater than 0.1 m s(1 and NH3 concentrations
temperature, a model in Computational Fluid Oynamics (CFO) was applied and validated. It was found that the model had a good statistical correlation with the experimental data, so that it may be used for real time prediction of distribution behavior of NH3 concentrations, air velocity and temperature inside the open
In livestock buildings airborne contaminants originate mainly from the decomposition of organic material. Inhalation of these organic particles and vapors can lead to respiratory diseases in humans and animals. Thus, problems with air quality in animal facilities must be viewed from two aspects:
− First, the pollutants can cause direct alterations in the animal due to the agent(organism interaction (mechanical irritation, local inflammation etc.), being harmful alone as well as preparing the attacked tissue for installation of new diseases.
− Secondly, the excess of certain components can cause stress to the animal, leading to a decline in immune status, and consequent predisposition to disease, as well as decline in productive and reproductive performance.
Additionally, the air quality in animal production systems is directly related to the metabolism of these animals, which release into the air: heat, humidity and carbon dioxide (CO2), via respiration and gases resulting from
digestion and wastes, such as ammonia (NH3), methane (CH4), hydrogen
sulfide (H2S), dust, and gases from incomplete combustion for heating, such as
carbon monoxide (CO) and nitrous oxide (NO2), with concentrations often
animals and workers. Additionally, from the processes of nitrification and denitrification, ammonia can be converted into a greenhouse gas, and emissions from the livestock sector contribute to the detriment of air quality.
As a consequence, from the sources related to animal production (systems of housing, manure storage, etc.), ammonia (NH3) emissions to the
atmosphere have increased dramatically. The emission of NH3 resultant of
agricultural activities in Europe excluding the former USSR, doubled between 1950 and 1986 (ASMAN et al., 1988), in the Netherlands, the increase was 2.5 times greater over the same time period (APSIMSON et al., 1987).
This increase in NH3 emissions has contributed significantly to the
deposition of critical levels of nitrogen (N) in soil in many European countries, leading to eutrophication and acidification of soils (HEIJ; SCHNEIOER, 1991; HEIJ; ERISMAN, 1997). In Holland, for example, about 46% of the potential acid deposition is caused by the emission of NH3, mainly from agriculture
(ANONYMOUS, 1996).
Based on these facts, the study of ammonia for years has drawn the attention of researchers from different regions of the world. In Europe and the United States, inventories of NH3 emissions generated from the livestock sector
have already been performed, with emphasis on the production of poultry, pigs and cattle. For closed structures, typical of Europe and the United States, studies have been performed since 1980, reporting the distribution of NH3
concentrations in the structures and methods used to determine emissions (TINÔCO et al., 2008; GATES et al., 2008; FAULKNER et al., 2008).
A common factor for the employment of conventional methods used in closed installations, when applied to determine ammonia emissions in open buildings, is that although they are efficient for determining NH3 emissions, they
are laborious processes.
Therefore, the objective of this study was to adapt and validate a simple method for determination of ammonia flow distribution produce by the bedding and emitted by the aviary, the distribution of gas concentration in the air, as well as the distribution of temperature and air velocities in broiler houses located in tropical and subtropical regions.
The results of this study are presented in five chapters, where chapters I, II, IV and V are scientific manuscripts and chapter III is a review paper:
− Chapter I: Adaptation and validation of a methodology for determination of ammonia flux generated by the bedding of naturally ventilated aviaries.
− Chapter II: Validation of a methodology to determine ammonia flux generated by aviaries submitted to natural ventilation.
− Chapter III: Evaluation of different methods for determination of ammonia emissions from aviaries and their applicability in open animal production facilities.
− Chapter IV: Employment of 3O CFO for determination of ammonia concentration distribution in non(insulated aviaries with natural ventilation.
AMARAL, M. +! ! 1 % ! .!&! $ % &! $% ", ! '$ ! "! . !+/# ! # + $% ! 1 $ "!% +!. 2007. 79 f. Oissertação (Mestrado em Engenharia Agrícola) – Universidade Federal de Viçosa, Viçosa, MG.
ANONYMOUS. $+ & $ $%! -! !$# 23 4 $ )%#05. Samsom H.O. Tjeenk Willink bv, Alphen a/d Rijn, 1996. 142 p.
ApSIMSON, H.M.; KRUSE, M.; BELL, J.N.B. Ammonia emissions and their role in acid deposition. % .0 & # $+ & $ $%, v. 21, n. 1, p. 1939(1946, 1987. ASMAN, W.A.H.; ORUKKER, B.; JANSSEN, A.J. Modelled historical concentrations and depositions of ammonia and ammonium in Europe.
% .0 & # $+ & $ $%, v. 22, n. 1, p. 725(735, 1988.
FAULKNER, W.B.; SHAW, B.W. Review of ammonia emission factors for United States animal agriculture. % .0 & # $+ & $ $%, v. 42, n. 27, p. 6567(6574, 2008.
GATES, R.S.; CASEY, K.O.; WHEELER, E.F.; XIN, H.; PESCATORE, E.A.J.; U.S. broiler housing ammonia emissions inventory. % .0 & #
HEIJ, G.J.; ERISMAN, J.W. (Eds.). # !% .0 & # . % $ !$ % (( #% $ % && %& ! # 8 % $ %0 %0 & !$ : the third and final phase (1991(1995). Amsterdam: Elsevier, 1997. 705 p. (Studies in Environmental Science, 69).
HEIJ, G.J.; SCHNEIOER, T. # ( #!% $ & !� $ %0 %0 & !$ . Amsterdam: Elsevier, 1991. 771 p. (Studies in Environmental Science, 46). KIM, K.Y.; JONG KO, H.; TAE KIM, H.; SHIN KIM, Y.; MAN ROH, Y.; MIN LEE, C.; NYON KIM, C. Quantification of ammonia and hydrogen sulfide emitted from pig buildings in Korea. 6 )&$! ( $+ & $ $%! !$!" $%, v. 88, n. 2, p. 195(202, 2008.
NATIONAL INSTITUTE FOR OCCUPATIONAL SAFETY ANO HEALTH – NIOSH. Ontario: Ontario Ministry of the Environment, Ontario Air Standards for Ammonia, 2001. 47 p.
REIOY, B.; WEBB, J.; MISSELBROOK, T.H.; MENZI, H.; LUESINK, H.H.; HUTCHINGS, N.J.; EURICH(MENOEN, B.; OÖHLER, H.; OÄMMGEN, U. Comparison of models used for national agricultural ammonia emission inventories in Europe: Litter(based manure systems. % .0 & #
$+ & $ $%, v. 43, n. 9, p. 1632(1640, 2009.
TEYE, F.K.; HAUTALA, M. Adaptation of an ammonia volatilization model for a naturally ventilated dairy building. % .0 & # $+ & $ $%, v. 42, n. 18, p. 4345(4354, 2008.
TINÔCO, F.F.I.; OSORIO SARAZ, J.A. Control ambiental y la agroindustria de producción animal en el Brasil y América Latina. In: CONGRESO NACIONAL OE INGENIERÍA AGRÍCOLA, 2008, Medellín, Colombia. $! 9 Medellín, 2008.
:
;
; ;
;
: The aim of this work was to adapted and validate a precise and simple application method defined as the “Saraz method for determination of ammonia emissions” (SMOAE) which is based on the method of mass diffusion (J "A) to determined the ammonia flux due to mass convection (NA”) from broiler
litter. It was found that the ammonia flux (N"A) can be obtained by the diffusion
method SMOAE. The SMOAE method presents a recovery efficiency for volatilized ammonia of 77 ± 4% and can be used for ammonia concentrations as high as 0.5 ppm. A statistical model with a reliability of 95% was utilized, which allows for analysis of ammonia flux behavior as a function of parameters such as age of the birds, pH and litter moisture content.
< 8= & : Methodologies for ammonia flux, poultry houses, broiler litter, air quality, natural ventilation.
: Objetivou(se com este trabalho adaptar e validar uma metodologia ao mesmo tempo precisa e de simples aplicação a ser denominada método Saraz para determinação de fluxo de amônia (SMOAE) o qual é baseado no método de difusão de massa (J"A) para determinar o fluxo de amônia (N"A)
! !+&! >#0!+ : Metodologias para fluxo de amônia, ambiência avícola, cama aviária, qualidade do ar, ventilação natural.
:7
Understanding of ammonia emission rates generated in animal confinements from manure is very important, due to its direct relation to negative health effects and productivity of animals and people (TINÔCO, 2004).
Many studied have been developed based on the reduction of ammonia emissions from manure by minimization of nitrogen excretions in the feces due to dietary changes. This procedure constitutes the first step in reducing NH3
emissions provident of agricultural installations (PANETTA et al., 2006; NOEGWA et al., 2008). However, despite the efficiencies obtained in the technique for reducing ammonia by manipulation of the diets, ammonia emissions cannot be reduced by 100%.
Some methodologies have been developed and validated to determine ammonia gas emissions generated by animal manure, and have been employed in both open and closed animal production installations; however, they obtain different efficiencies in recovery of the total ammonia nitrogen (TAN) which is volatilized.
Among these methodologies, the most utilized are those which involve mass balances, external and internal tracer gas and the passive methods (WELFORO et al., 2003; NICHOLSON et al., 2004; GATES et al., 2005; REIOY et al., 2008; OSORIO et al., 2009; RONG et al., 2009).
The majority of methodologies for ammonia quantification show good performance in closed installations. However, in the case of open installations these methods require adaptations. When using tracer gases, external tracer gases are less efficient compared with internal tracer gases (OORE et al., 2004; PHILLIPS et al., 2000).
Thus, each of the mentioned methodologies present advantages and disadvantages, where a common disadvantage to all is the high cost of operation. Other volatilization models have also been used to predict ammonia emissions based on different circumstances and poultry installation types (AROGO et al., 2003; PINOER et al., 2004). Acquisition of the mass transfer coefficient (hm), which is an important parameter in the volatilization model of
ammonia present in manure, is encountered in literature with ample variation, being a disadvantage of the model.
A methodology used in the study of soils for determining nitrogen (N) loss from the soil by volatilization of TAN makes use of a collector chamber for ammonia fixation by diffusion, where quantification is performed by acid – base titration using the Kjeldhal method (ASSOCIATION OF OFFICIAL ANALITICAL CHEMISTS – AOAC, 1970).
In this methodology, nitrogen recovery efficiencies of roughly 70% are encountered (LARA et al., 1990; YANG et al., 2000; SANGOI et al., 2003; RENATA et al., 2002; LEAL et al., 2007).
Based on these facts, the objective of this study was to obtain the ammonia flux due to mass convection (N"A) of the broiler litter, using the
ammonia mass flux (SMOAE) which is based on the mass diffusion method (J"A).
?7
The present study was developed in the Laboratories of the Oepartment of Agricultural Engineering, University Federal of Viçosa, Brazil, and in a conventional commercial broiler house integrated with the Pif(Paf Alimentos S/A company, located in the municipality of Viçosa, MG, Brazil.
?7:7 0!&!#% & % # ( %0 $ %! !% $
The commercial poultry house utilized in this investigation housed 14,000 Cobb chickens, with a housing density of 12 birds m(2. Oimensions of the building were 100 m x 13.5 m (Length x Width ) with 3 m high ceilings, 0.50 m overhang and 20° roof inclination angle (Figure 1).
The poultry house, with little thermal insulation as is common to Brazil and South America, was open with natural ventilation during the experimental phase and the litter was composed of fresh coffee hulls.
Figure 1 – Characteristics of the experimental installation.
?7?7 ! (() $ %0 .& . ( & % & $ $" ! $ ! ! ( )*
$ $!%
?7?7:7 ! )& $" @) . $%
The NH3 capturing device was constructed from a common PVC pipe
measuring 20 cm in diameter and 30 cm in height. Two polyurethane sponges measuring 20 cm in diameter each and 2 cm thick were placed in the tube so that they were 10 (Sponge 1) and 30 cm (Sponge 2) from the base of the PVC collector. The function of sponge 1 was to directly capture the ammonia flux produced by the poultry litter bedding, and sponge 2 is used to prevent contamination by exterior gases which may interfere on the values of ammonia captured by sponge 1 (Figure 2).
Figure 2 – Collector device used to capture volatilized ammonia.
?7?7?7 ..& .& !% % ( & ! $ ! #!.%)&
?7?7A7 #!% $ ( %0 # #% & + # !$ # #% $ ( *. & $%! !%!
Oata collection was performed on three consecutive days in each week of the bird’s life, between 22(28, 29(35, and 36(48 days of the productive cycle. It was taken into consideration, according to studies performed by Gates et al. (2005) and Wheleer et al. (2006), that in the first 14 days ammonia emissions are minimal and after this time emissions increase linearly.
Seeking to observe the influence of waterers and feeders on ammonia flux compared to other regions of the poultry house, four collector devices were installed in the vicinity of the feeders and four in the vicinity of the waterers (Figure 4). Ammonia flux measurements were taken during 9 days between 8:00 to 10:00 AM and 3:00 to 5:00 PM.
Figure 3 – Location of the collector devices in the regions of the feeders and waterers in the poultry house.
?7?7B7 % & $!% $ ( %0 @)!$% %8 ( ! $ ! #!.%)&
whose quantification is performed by acid(base titration using the Kjeldhal method (AOAC, 1970).
To extract ammonia captured in the sponge, 80 mL of a potassium chloride (KCl) solution with a concentration of 0.5 mol L(1 added to 40 mL of water was used. This solution mixed with the sponge was prepared in a Tecnal model TE(0363 nitrogen distillation column. After distillation, the condensed sample was titrated with hydrochloric acid (HCl) at a concentration of 0.5 mol L(1 (AOC, 1970).
The NH3 concentration (g NH3) captured by the sponge was obtained by
the volume of the tilter solution (mL), the solution concentration (mol L(1), and number of moles of NH3 (17). Using equation 1, the SMOAE mass flux was
obtained.
− − = (1)
where SMOAE is NH3 mass flux (g NH3 m(2 s(1); NH3, NH3 mass (g NH3); A,
sponge area (m2); t, exposure time of sponge (s).
?7?7C7 % & $!% $ ( %0 (( # $#8 ( %0
To determine the efficiency of the proposed SMOAE method in terms of ammonia recovery, the difference between the quantity of NH3 in the litter and
quantity of NH3 recovered by the sponge were determined. Ten repetitions were
performed to verify this value.
?7A7 0 %0 & % #! .& . (() $ %0 !$ %0 !
# $+ #% $ %0
diffusion coefficient of ammonia in the air (0.28 x 10(4 m2 s(1) according to Incropera and OeWitt (1999).
Figure 4 – Mass diffusion model of the prototype.
− ∂
= = − =
∂
(2)
= (3)
For the mass convection model, a boundary limit model was used for concentration of a chemical species on a flat surface, where N”A is the ammonia
flux (g m(2 s(1) and hm the mass diffusion coefficient. This coefficient is a function
of the Reynold’s number (Re) and the Schmidt number (Sc); V is the average wind speed at the height of the birds; L is the length of the installation; and ν is the viscosity of the air. Mass flux by convection is determined as (INCROPERA; OeWITT, 1999):
= − ∞ (4)
For the case in which it is considered outside the boundary limit, mass flux is determined as:
= (5)
CA,Z=0
CA,O0≈CA,S Sponge
Because flow in the building is turbulent, the mass convection coefficient is calculated as:
=
< <
(6)
Where
υ
=
(7)
υ
= (8)
?7B7 %!% % #! !$! 8
After the experiments, the data obtained from both measurement methods (SMOAE diffusion and convection models N”A) were titrated and
analysed statistically, and the following hypotheses were tested:
Null hypothesis (Ho): data of NH3 flux are equal for the two methods
tested.
SMOAE = N”A (9)
Alternative hypothesis (H1): Oisparity of the NH3 concentration data
between the two tested methods.
SMOAE = a (N”A) + b (11)
where a and b are the coefficients to be obtained experimentally via the regression.
To determine the incidence of variables such as location (waterer and feeder) and the time of the day for statistical analysis, the Tukey test was used at significance levels of 1 and 5%.
A regression analysis was performed to verify correlations between ammonia flux in function of variables such as pH, litter moisture content and age of the birds using the SAEG version 9.1 program (UNIVERSIOAOE FEOERAL OE VIÇOSA – UFV, 2007).
?7C7 #@) % $ ( *. & $%! !%!
Background ammonia concentration data in the environment were obtained from an electrochemical detector “Gas Alert Extreme Ammonia (NH3) Oetector” from BW Technologies with a measuring range from 0(100 ppm, temperature between (4 to +40°C, relative humidity from 15% to 90% and presenting an accuracy of ± 2% (at 25ºC and RH between 5% and 95%). Oata collection was performed in twenty minutes interval.
Air temperature at sample height was measured (OS1820, Oallas Semiconductor, address). Energy was provided to the 1(wireTM system by a parasitic feed derived from the data transmission conductor, where only two conductors are necessary. Temperature measurements were made every five minutes.
Air speed (m s(1) was measured with a digital wind gage (Testo 425), with a range between 0(20 m s(1, precision of ± 0.5 (°C), accuracy of 1% (pressure) and 2.5% (m s(1) and 0.1°C, positioned five centimeters in front of each sponge on the upwind side. Air velocity data collection was performed in five minutes interval.
The pH of the poultry litter was determined in the laboratory using a digital pH meter, for which each sample of the bed collected in the installation was diluted in water at a 1:4 proportion (bed sample:water).
Moisture content of the litter was determined in the laboratory as the mass difference between the dry and moist mass using an oven at 105°C.
A7
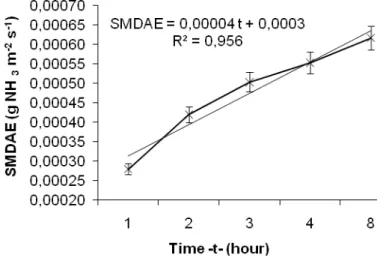
Figure 5 presents the behavior of the ammonia mass captured by the collector device encountered by the mass diffusion method in function of the time, at the significance level of p < 0.01. It was observed that the behavior of the curve of ammonia for all replicates was linear in function of time, with a greater increase in emissions after the prototype was exposed for four hours. Hence, the prototypes were exposed for no more than two hours to facilitate sampling in the field and allows for a larger numbers of experimental replicates.
In Table 1 the ammonia mass recovery data are presented as well as the ammonia recovery curve as a function of its volatilization. The utilized collector device had a recovery efficiency of 77.55 ± 4.32 g NH3 m(2, being
efficient compared with the experiments performed by Renata et al. (2001 and 2002) and Araujo et al. (2007), who encountered 70% efficiency when using the chamber collector method. Moreover, the proposed method can capture ammonia concentrations exceeding 0.5 ppm.
Table 1 – Recovery of volatilized ammonia by the collector device
Ammonia recovered by
the sponge (g NH3 m(2)
Ammonia volatilized from
the litter (g NH3 m(2)
Efficiency (%) Minimum (g NH3 m(2)
Maximum (g NH3 m(2)
16.76 19.99 77.55 ± 4.32 68.85 82.47
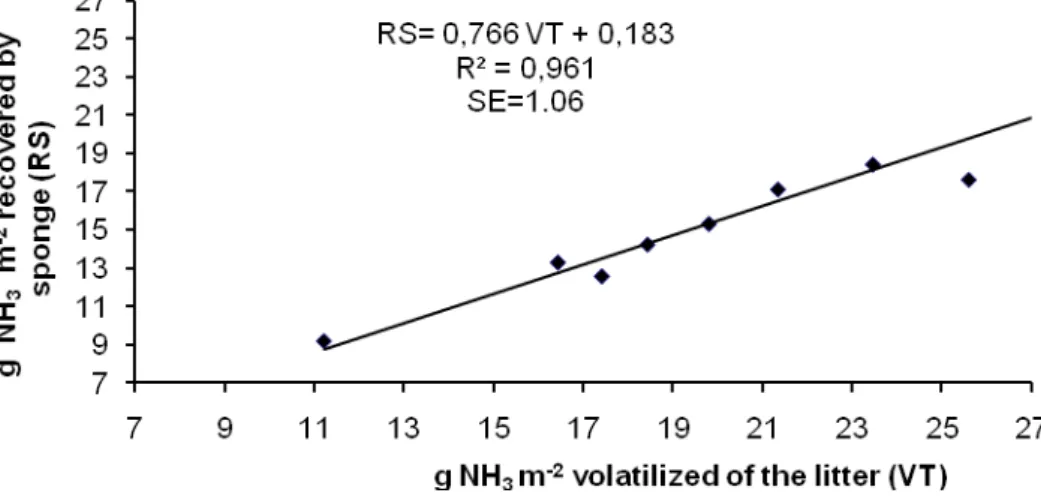
In Figure 6, a good correlation was verified between the NH3 quantities
effectively volatilized from the litter and those recovered by the sponge, at the significance level of p < 0.01. Therefore, to estimate the total quantity of NH3
recovered by the sponge, the value obtained by the equation should be multiplied by 1.2 since recovery efficiency is approximately 80%, as presented in Table 1.
After determining the efficiency of the collector device, the mass diffusion flux SMOAE was calculated by equation 3. From the SMOAE the value of CA,s was obtained. The ammonia fluxes were encountered using equation 4,
Figure 6 – Curve of ammonia recovery analyses in function of volatilization from the bed.
The mass convection coefficient (hm) was calculated from equation 6 for
turbulent flow, temperatures between 25 and 30°C, and velocities at the concentration boundary limit varying between 0.10 and 0.35 m s(1, where values encountered in this experiment are in agreement with others experiment such as Brewer and Costello (1999) and Menegali et al. (2009). The value ν ranged from 15.66 x 10(6 and 17.82 x 10(6 m2 s(1 (INCROPERA; OeWITT, 1999).
Values of hm were obtained which varied between 5.15 x 10(4 and 1.34 x
10(3 m s(1. These hm values did not differ from those reported by Ni (1999) and
Liu et al. (2009) who worked with velocities in this same range.
The analysis of variance between the N”A and SMOAE method was
Figure 7 – Analysis of variance between ammonia flux by the N"A and SMOAE
methods.
Figure 8 shows the correlation of the SMOAE model of mass diffusion and mass convection N"A, at the significance level of p < 0.01. The values of
N”A in all cases underestimate the SMOAE as is show in the Figure 7, although,
it was found that the R2 coefficient was 0.91, which means there is a high correlation between models to make use of the SMOAE method to determine N"A from poultry manure in terms of natural ventilation.
The values of N"A encountered within the range 10(5 and 10(3gNH3m(2s(1
did not differ from those encountered by Miragliotta (2001), Redwine et al. (2002), Teye et al. (2008) and Liu et al. (2009) who worked with mass transfer methods.
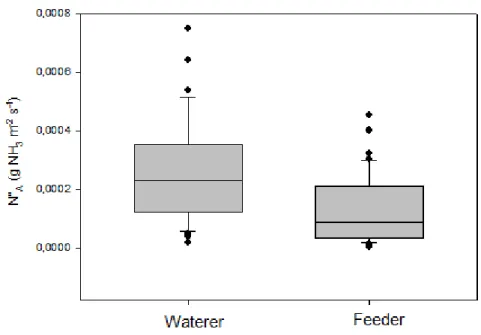
In the Figures 9 and 10, the statistical analysis for correlation of the convective mass flux (N”A) with variable times during the day and location of the
Figure 8 – Curve for analyses of the proposed mass diffusion prototype (SMOAE) and mass convection (N”A).
Figure 10 – Ammonia flux in function of time.
It is possible that the difference in ammonia flux (N”A) from the litter in
the areas of the feeders and waterers may be due to the lower moisture content near the feeders in comparison with the waterers. This was expected since according to Miragliota (2001), Jones et al. (2005) and Wheeler et al. (2008) the total volatilized ammonia (TAN) increases when the moisture of the litter bedding is elevated.
Regarding ammonia flux (N”A) in function of time, the N”A is likely higher
between 3:00 to 5:00 P.M than 8:00 to 10:00 A.M, because in the afternoon both the temperature inside of the poultry house and the litter increases, aiding ammonia volatilization.
Figure 11 – Typical distribution of ammonia flux from the poultry litter at: a) 8:00
to 10:00 AM b) 3:00 to 5:00 PM.
Figure 12 represents the relationship between the ammonia flux (N”A) in
function of age of the birds at the significance level of p < 0.05. A linear increase in ammonia flux was observed between 24 days old and the age of slaughter. From the equation adjusted to the data represented in Figure 12, a
a)
Figure 12 – Ammonia flux in function of age of the birds (P < 0.001).
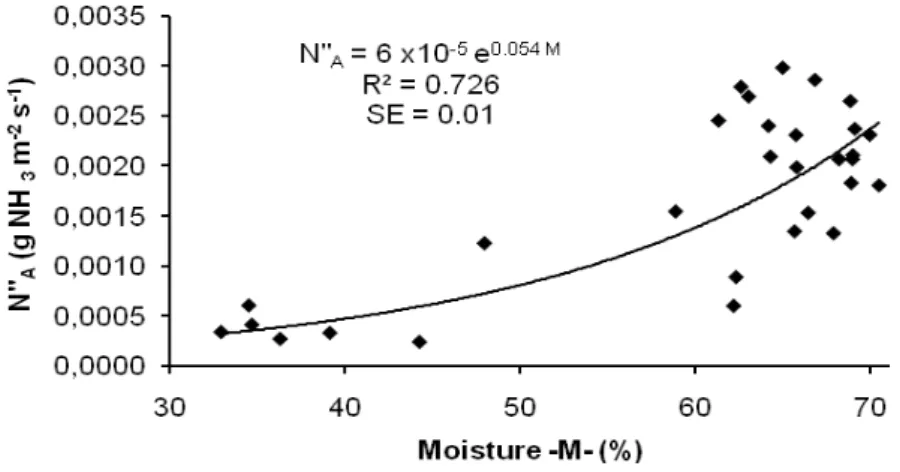
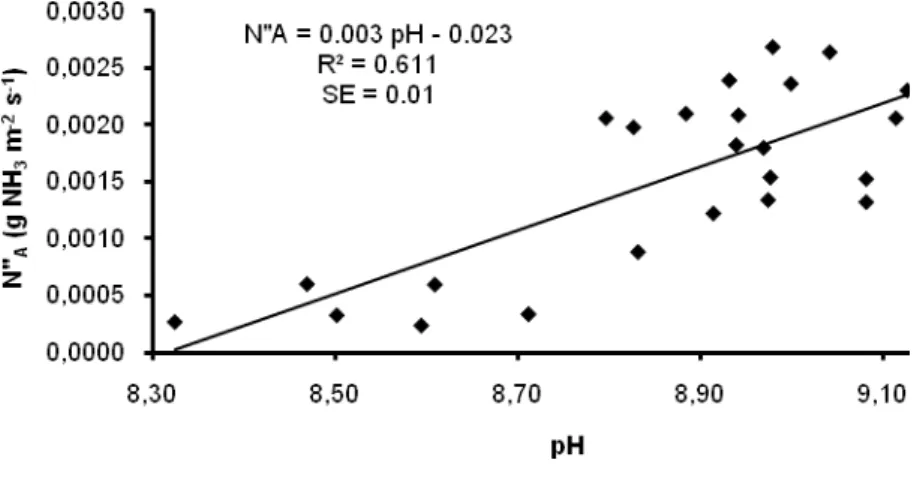
From Figure 13 and 14 the relationship between N”A, moisture content
and pH of the bed can be observed at the significance level of p < 0.05. An exponential trend was also seen in both cases which permitted for inferring a statistical tendency; however it is possible to predict behavioral values of these variables in function of the ammonia flux.
Figure 14 – Ammonia flux in function of pH.
In Figure 15 a direct relationship between ammonia emission, age of the birds and moisture content of the litter was observed, reaching maximal values when litter moisture content is greater than 50% and the birds are more than 35 days old. This aspect coincides with that of other studies performed by Osorio et al. (2009), Tinôco et al. (2004), Miragliotta (2001) and others.
0,00000 0,00005 0,00010 0,00015 0,00020 0,00025 0,00030 45 50 55 60 65 70 34 36 N "A ( g N H3 m
(2 s (1 )
Moi stur
B7
The proposed SMOAE mass diffusion has a good relationship with the N”A mass convection method, which is the method most commonly used when
working with mass balances from ammonia sources. Therefore, the SMOAE method may be used to determine ammonia flux (N”A).
The SMOAE method presented a recovery efficiency of approximately 78% of total volatilized ammonia, and can capture ammonia at concentrations as high as 0.5 ppm. It is thus indicated that the method may be considered as efficient and used as an alternative to determinate N”A inventories in
installations with natural ventilation.
Although hm has been calculated theoretically, for natural ventilation
conditions with air speeds at the height of the birds varying between 0.10 and 0.35 m s(1, the encountered values are not different from hm values encountered
in other studies.
The SMOAE method could be improved to be used for determination of N”A forced ventilation conditions, for which the technique must be perfected and
hm values specified for different velocity ranges, litter materials and cycles for its
validation.
C7 < D
37
ARAUJO, E.S.; MARSOLA, T.; MIYAZAWA, M.; BOOOEY, R.M.; URQUIAGA, S.; ROORIGUES, B.J. Câmara coletora para quantificação do N(NH3
volatilizado do solo. In: CONGRESSO BRASILEIRO OE CIÊNCIA OO SOLO, 31, 2007, Gramado. $! 9 Gramado, 2007.
AROGO, J.; WESTERMAN, P.W.; LIANG, Z.S. Comparing ammonium ion dissociation constant in swine anaerobic lagoon liquid and deionized water.
&!$ !#% $ ( %0 , v. 46, n. 1, p. 1415(1419, 2003.
ASSOCIATION OF OFFICIAL ANALITICAL CHEMISTS – AOAC. (( # ! %0 ( !$! 8 . 11.ed. Washington, O.C., 1970. 1015 p.
BREWER, S.K.; COSTELLO, T.A.. In situ measurement of ammonia volatilization from broiler litter using an enclosed air chamber. &!$ !#% $ (
, v. 42, n. 5, p. 1415(1422, 1999.
OORE, C.J.; JONES, B.M.R.; SCHOLTENS, R.; VELO, J.W.H.I.T.; BURGESS, L.R.; PHILLIPS, V.R. Measuring ammonia emission rates from livestock buildings and manure stores((part 2: Comparative demonstrations of three methods on the farm. % .0 & # $+ & $ $%, v. 38, n. 19, p. 3017(3024, 2004.
GATES, R.S.; XIN, H.; CASEY, K.O.; LIANG, Y.; WHEELER, E.F. Method for measuring ammonia emissions from poultry houses. 67 .. ) %&8, v. 14, n. 3, p. 622(634, 2005.
INCROPERA, F.P.; OeWITT, O.P. )$ ! $%! ( 0 !% !$ ! %&!$ ( &. New York: Wiley, 1990.
JONES, T.A.; OONNELLY, C.A.; OAWKINS, M.S. Environmental and management factors affecting the welfare of chickens on commercial farms in the United Kingdom and Oenmark stocked at five densities. ) %&8 # $# , v. 84, n. 1, p. 1155(1165, 2005.
KEENER, H.M.; ZHAO, L. A modified mass balance method for predicting NH3 emissions from manure N for livestock and storage facilities. 8 %
MENEGALI, I.; TINÔCO, I.F.F.; BAÊTA, F.C.; CECON, P.R.; GUIMARÃES, M.C.C.; COROEIRO, M.B. Ambiente térmico e concentração de gases em instalações para frangos de corte no período de aquecimento. + %!
&! &! $" $0!& ! "&/# ! - $%! , v. 13, n. 1, p. 984(990, 2009.
MIRAGLIOTTA, M.Y. Avaliação dos níveis de amônia em dois sistemas de produção de frangos de corte com ventilação e densidade diferenciados. 2001. 122 f. Oissertação (Mestrado em Construções Rurais e Ambiência) – Universidade Estadual de Campinas, Campinas, SP.
MONTENY, J.Q.; NI, O.; OENEMA, E.; WEBB, J. Algorithms determining ammonia ermission from buildings housing cattle and pigs and from manure stores. In: OONALO, L.S. (Ed.). +!$# $ !"& $ 8. New York: Academic Press, 2006. v. 89, p. 261(335.
NOEGWA, P.M.; HRISTOV, A.N.; AROGO, J.; SHEFFIELO, E.R.E. A review of ammonia emission mitigation techniques for concentrated animal feeding operations. 8 % $" $ & $", v. 100, n. 4, p. 453(469, 2008.
NI, J. Mechanistic models of ammonia release from liquid manure: a review. 67 "& #7 $" 7, v. 72, p. 1(17, 1999.
NICHOLSON, F.A.; CHAMBERS, B.J.; WALKER, E.A.W. Ammonia emissions from broiler litter and laying hen manure management systems. 8 %
$" $ & $", v. 89, n. 2, p. 175(185, 2004.
OSORIO, J.A.; TINÔCO, F.F.I.; CIRO, H.J. Ammonia: a review about concentration and emission models in livestock structures. 8$!, v. 76, n. 158, p. 89(99, 2009.
PANETTA, O.M.; POWERS, W.J.; XIN, H.; KERR, B.J.; STALOER, K.J. Nitrogen excretion and ammonia emissions from pigs fed modified diets. 6 )&$! ( $+ & $ $%! F)! %8, v. 35, p. 1297(1308, 2006.
PHILLIPS, V.R.; SCHOLTENS, R.; LEE, O.S.; GARLANO, J.A.; SNEATH, R.W. SE ( structures and environment: a review of methods for measuring emission rates of ammonia from livestock buildings and slurry or manure stores: assessment of basic approaches. 6 )&$! ( "& #) %)&! $" $ & $"
!�, v. 77, n. 4, p. 355(364, 2000.
REOWINE, J.S.; LACEY, R.E.; MUKHTAR, S.; CAREY, J.B. Concentration and emissions of ammonia and particulate matter in tunnel(ventilated broiler houses under summer conditions in Texas. &!$ !#% $ ( , v. 45, n. 4, p. 1101(1109, 2002.
REIOY, B.; MMGEN, O.A.; HLER, O.O.h.; EURICHMENOEN, B.; VAN EVERT, F.K.; HUTCHINGS, N.J.; LUESINK, H.H.; MENZI, H.; MISSELBROOK, T.H.; MONTENY, G.J.; WEBB, J. Comparison of models used for national agricultural ammonia emission inventories in Europe: liquid manure syst. % .0 & #
$+ & $ $%, v. 1, n. 1, p. 3452(3464, 2008.
RENATA, H.; CAZETTA, J. Método simples para determinar amônia liberada pela cama aviaria. +7 &! 7 G % #7, v. 3, n. 1, p. 824(829, 2001.
RENATA, H.; CAZETTA, J.; MORAES, V.M. Frações nitrogenadas, glicidas e amônia liberada pela cama de frangos de corte em diferentes densidades e tempos de confinamento. +7 &! 7 G % #7, v. 3, n. 4, p. 1795(1802, 2002. RONG, L.; NIELSEN, P.V.; ZHANG, E.G. Effects of airflow and liquid temperature on ammonia mass transfer above an emission surface: Experimental study on emission rate. & )&# #0$ "8, v. 100, n. 20, p. 4654(4661, 2009.
SANGOI, L.; ERNANI, P.; LECH, V.; RAMPAZZO, C. Volatilization of N(NH3 influenced by urea application forms, residue management and soil type in lab conditions. H$# ! )&! , v. 33, n. 1, p. 687(692, 2003.
SCHOLTENS, R.; OORE, C.J.; JONES, B.M.R.; LEE, O.S.; PHILLIPS, V.R. Measuring ammonia emission rates from livestock buildings and manure stores ( development and validation of external tracer ratio, internal tracer ratio and passive flux sampling methods. % .0 & # $+ & $ $%, v. 38, n. 19, p. 3003(3015, 2004.
TEYE, F.K.; HAUTALA, M. Adaptation of an ammonia volatilization model for a naturally ventilated dairy building. % .0 & # $+ & $ $%, v. 42, n. 18, p. 4345(4354, 2008.
WELFORO, E.L.; STÉPHANE, B.E.; LEMAY, P.; BARBER, M.; GOOBOUT, S. Simulation of ammonia emissions from swine manure for various diet formulations. In: CSAE/SCGR Meeting, 2003, Montréal, Québec.
& # $" 9 Montréal, 2003.
WHEELER, E.F.; CASEY, K.O.; GATES, R.S.; XIN, H. Ammonia emissions from USA broiler barns managed with new, built(up, or acid(treated litter. of the INTERNATIONAL LIVESTOCK ENVIRONMENT SYMPOSIUM, 8., 2008, Iguassu Falls City, Brazil. & # $" 9 St. Joseph, MI: ASABE, 2008. 10 p. WHEELER, E.F.; CASEY, K.O.; GATES, R.S.; XIN, H.; ZAJACZKOWSKI, J.L.; TOPPER, P.A.; LIANG, Y.; PESCATORE, A.J. Ammonia emissions from twelve U.S.A. broiler chicken houses. &!$ !#% $ ( %0 , v. 49, n 5, p. 1495(1512, 2006.
?
; ;
: Oue to small daily and seasonal temperature ranges, in most tropical and subtropical regions the structures used in the animal production industry are predominantly open, typically relying on natural ventilation. By being open, however, it is very difficult to quantify the rate of pollutant emissions such as ammonia (NH3). In this sense some methods have been developed to
reduce this difficulty, but most are costly and complex, preventing their implementation in practice. The aim of this work was to adapt and validate the Saraz method for determination of ammonia emissions (SMOAE) reported by Osorio (2010), to determine the ammonia flux generated in poultry houses with natural ventilation. It was found that the proposed method can be used for natural ventilation conditions with wind speeds greater than 0.1 m s(1 and NH3
concentrations greater than 1 ppm, and that there is a good correlation between the values determined by this method and those obtained by the characteristic equation for calculating emissions that are based on knowledge of the NH3
concentration, air speed and temperature.
< 8= & : NH3 flux, poultry houses, natural ventilation, SMOAE method.
Saraz (Saraz method for determination of ammonia emissions ( SMOAE), para determinar o fluxo de NH3 emitida pelas laterais dos galpões avícolas
submetidos à ventilação natural. Verificou(se que o método proposto pode ser usado com confiabilidade em condições de ventilação natural com ventos maiores que 0,1 m s(1 e concentrações de NH3 maiores que 1 ppm. Encontrou(
se alta relação entre os valores de fluxo de amônia encontrados pelo método proposto e aqueles obtidos na equação característica para o cálculo de emissões a qual é baseada no conhecimento da concentração de NH3,
velocidade e temperatura do ar.
! !+&! >#0!+ : Fluxo de NH3, galpões avícolas, ventilação natural, método
SMOAE.
:7
Understanding ammonia emission rates to the atmosphere is of extreme importance, not only because of the effect that this gas has on the environment in general, but also due to the direct relation that increased concentration has on the health and productivity of chickens and people.
The ammonia emission rate is estimated as the product of the gas concentration and the ventilation rate which exits through lateral openings or the exhaust fans from inside the structure at the same time, where its calculation is performed by continuous monitoring. However, although the concept is quite simple, both concentration as well as ventilation rates are difficult to accurately measure (GATES et al., 2005; GATES et al., 2008; REIOY et al., 2008).
The ammonia emission rate was calculated by Wheeler et al. (2006) as being the mass of NH3 emitted by the poultry houses per unit of time. Some
methods to measure NH3 emissions in naturally ventilated installations with
manure storage have been developed, where the most commonly utilized are those based on methods of external and internal tracer gases (PHILLIPS et al., 2000; OEMMERS et al., 2000; PHILLIPS et al., 2001; OEMMERS et al., 2001; SCHOLTENSA et al., 2004; MOSQUERA et al., 2005).
currents in the opposite direction of the fans must be considered, which generate contantly varying flow rates (XIN et al., 2003).
Thus, the methods for evaluation of ammonia emissions, such as tracer gases, continuous monitoring and mass balances offer precision and accuracy, and can be encountered in articles reported by Arogo et al. (2003), Jacobson et al. (2005), Blunden et al. (2008), Faulkner et al. (2008) and Osorio et al. (2009). However, application of these methods is more difficult in conventional broiler houses located in tropical climates due to the non(uniformity of ammonia emissions caused by the behavior of openings which generated different air flows in each exhaust point of the building.
Based on these facts, the objective of the present study was to adapt and validate the Saraz method for determining ammonia flux (Saraz method for determination of ammonia emissions(SMOAE), which is a simple and low cost method to be used for determining the rate of ammonia flux in poultry houses which are subjected to natural ventilation conditions.
?7
The present project was developed at the Oepartment of Agricultural Engineering of the University Federal de Viçosa(Brazil, and at a conventional commercial broiler house integrated with the Pif – Paf Alimentos S/A company, located in the municipality of Vicosa, MG, Brazil.
According to the Köppen classification, the region is Cwb – high altitude tropical climate with a rainy summer and pleasant temperatures. This study was performed during the summer, with an average temperature of 22°C and relative humidity varying between 50 and 70%.
Figure 1 – Characteristics of the experimental building.
The poultry house, with minimal thermal insulation as is typical in Brazil and South America, was open during the experimental period with natural ventilation, and the bedding was composed of fresh coffee hulls.
?7?7 F)!$% ( #!% $ ( %0 ! $ ! ( )* ) $" %0 !&!I %0
The operating principle of the SMOAE (Saraz method for determination of ammonia emissions ( SMOAE), proposed by Osorio (2011a), was adapted for quantification of the ammonia flux of this gas which is emitted by an open, naturally ventilated poultry house.
Adaption of the SMOAE method consisted of establishing sampling points, using polyurethane sponge samplers of 20 cm in diameter each and thickness of 2 cm, forming a homogeneous mesh organized at the lateral opening of the building in the opposite direction of the predominant wind (i.e. downwind side of building).
Figure 2 – Elevation view of the downwind side of poultry house showing the position of the ammonia capturing devices (sponge samplers) on the lateral wall.
A Tukey test was performed to determine if there were significant differences in the ammonia flux captured by the samplers, depending on location along the lateral opening.
?7?7:7 % & $!% $ ( %0 ! )$% ( ! $ ! #!.%)& -8 %0
%0
To extract ammonia captured in the sponge, an 80 mL solution of potassium chloride (KCl) with a concentration of 0.5 mol L(1 was added to 40 mL of water. This solution mixed with the sponge was prepared in a Tecnal model TE(0363 nitrogen distillation column. After distillation, the condensed sample was titrated with hydrochloric acid (HCl) at a concentration of 0.5 molL(1.
The NH3 concentration (g NH3) captured in the sponge was obtained by
the volume of the titrating solution (mL), the solution concentration (mol L(1) and number of moles of NH3 (17). Then, using equation 1, the SMOAE ammonia flux
was obtained.
− − = (1)
where SMOAE is Ammonia flux (g NH3 m(2 s(1); NH3, NH3 mass (g NH3); A,
sponge area (m2); t, exposure time of the sponge (s).
?7A7 ! !% $ ( %0 %0
To validate the proposed method, the ammonia flux (NH3 mass emitted
in the poultry houses per unit time) was computed using the adjusted equation (equation 3) proposed by Wheeler et al. (2006) (equation 2).
( ) −
= − (2)
(
)
− −
= − (3)
where ER1 is emission rate (g NH3 h−1 bird−1); ER2, ammonia flux (g NH3m (2s(1);
Q1, air flow inside the confinement, measured five centimeters in front of each
sponge positioned on the upwind side, at atmospheric temperature and pressure (m3 h−1 kg(1); Q2, air flow inside the confinement and immediately
the internal lateral wall of the poultry house) (ppm); Wm, molar mass of NH3
(17.031 g mole−1); Vm, molar volume of NH3 at standard temperature (0°C) and
pressure (101.325 kPa), the STP (0.022414 m3 mol−1); Tstd, standard
temperature (273.15 K); Ta, absolute temperature (K); Pstd, standard barometric
pressure (101.325 kPa); Pa, atmospheric barometric pressure at the
experimental site (kPa); A, area of the lateral wall (m2).
Equation 3 was compared with the results obtained with the SMOAE method (equation 1). For this, data obtained from the two measuring methods (SMOAE and ER2) were treated and statistically, and the following hypotheses
were tested:
Null hypothesis (Ho): data of NH3 flux are equal for the two methods
tested.
SMOAE = ER2 (9)
Alternative hypothesis (H1): Oisparity of the NH3 concentration data
between the two tested methods.
SMOAE ≠ ER2 (10)
If proven that H1 is true, a linear regression analysis will be performed to determine the coefficients of the model expresed in equation 3 using the programs SAEG version 9.1 (2007) and Sigma Plot V11.0:
SMOAE = a (ER2) + b (11)
?7B7 ..& .& !% % ( & ! $ ! #!.%)& !$ "!%0 & $" ( *. & $%! !%!
Taking into consideration that the objective was to find the ammonia flux emitted by the building, analysis of the period for sponge saturation was performed for 1, 2, 4, and 8 hours with three replications for each test.
Once defining the ideal time for exposure of the capturing sponges, it was sought to investigate if there were significant differences among different sampling locations. For this, data was collected on three consecutive days during each week of the birds lives, when they were between 22(28, 29(35 and 36(48 days old, from 8:00 to 10:00 AM and 2:00 to 4:00 PM.
The ammonia flux was not evaluated during the first weeks of the birds’ lives. This is because studies completed by Gates et al. (2005) and Wheeler et al. (2006) showed that ammonia emissions in the first 21 days are minimal and according to these same authors, after this period emissions grow linearly.
?7C7 #@) % $ ( *. & $%! !%!
Air speed (m s(1) was measured with a digital wind gage (Testo 425), with a range between 0(20 m s(1, precision of ± 0.5 (°C), accuracy of 1% (pressure), 2.5% (m s(1) and 0.1°C, positioned five centimeters in front of each sponge on the upwind side. Air velocity data collection was performed in twenty minutes intervals. The air flow Q2 (m3 h(1) was computed by the product of air
velocity and sponge area. The air direction was measurement with a weather vane.
Air temperature at the sampling height was measured (OS1820, Oallas Semiconductor). Energy was provided to the 1(wireTM system by a parasitic feed derived from the data transmission conductor, where only two conductors are necessary. Temperature measurements were made every five minutes.
presenting an accuracy of ± 2% (at 25ºC between 5% and 95% of RH). Measurements were performed at twenty minutes intervals.
Relative humidity of the air inside and outside of the poultry house was obtained at diverse points representing the entire poultry house, using independent systems (Hobo H8(032) with accuracy ±0.7 at 21°C. Oata collection was performed every second.
The atmospheric barometric pressure at the experimental site was acquired by a meteorological station located nearby the experimental poultry house.
A7
For the objective of validating this methodology, the time utilized for ammonia gas capture was only two hours. The shorter sampling time was utilized to limit large variations in climatic factors, principally those of wind speed and direction, thus allowing for validation of the method with mass flux data obtained from the ER2.
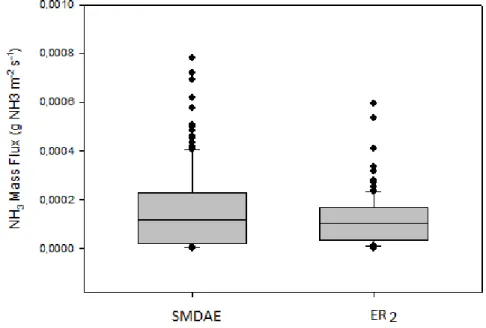
The analysis of variance between SMOAE and ER2 is shown in Figure
4. The Tukey test with a significance level of p < 0.01 was applied, finding that there was no significant differences between the experimental data obtained by the SMOAE and that obtained by the ER2, permitting for conclusion that the
SMOAE method could be used for determination of ammonia flux coming from the lateral openings of the naturally ventilated poultry houses.
Figure 4 – Analysis of variance between the NH3 flux determined by the
SMOAE method and ER2.
Oespite the fact that there was no significant differences between the experimental data obtained by the SMOAE and the emissions obtained by the ER2, the values obtained with SMOAE method underestimated those
The results of ammonia flux emitted from the lateral openings of the building with SMOAE and ER2, were found to be compatible with the ranges of
values encountered in other studies, varying from 10(7 to 10(4 g NH3 m(2 s(1 as
reported by Nicholson et al. (2004), Hayes and Curran (2006), Faulkner et al. (2008), Gates et al. (2008), Liu et al. (2009) and others.
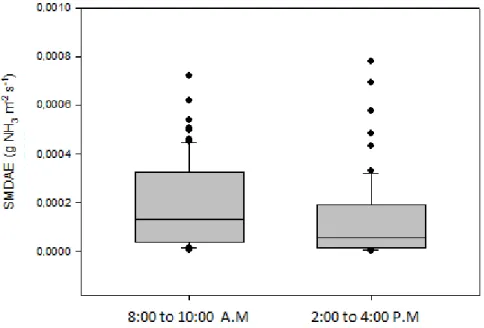
The graph illustrating the ammonia flux values determined by the SMOAE in function of the time of day are shown in Figure 5. The Tukey test (P < 0.01) indicated that there was significant differences between NH3 flux
determined by SMOAE method at 8:00 to 10:00 AM when compared with values obtained from 2:00 to 4:00 PM; this result may be explained by the fact that during the night the curtains are generally closed, therefore accumulated NH3
gas concentrations in the installation are rapidly liberated when the curtains are opened.
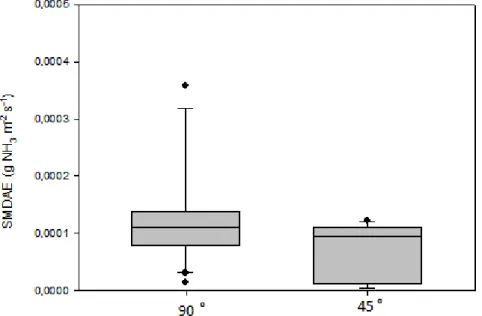
Figure 6 displays the ammonia flux values obtained by the SMOAE in function of the entrance angle of the wind measured in the lateral wall opposite to the lateral wall where the sponge samplers were located. Ouring the experimental period two predominant wind directions were observed, referred to the angle between the wind and the building wall plane, which were 90° and 45°.
Wind incidence angle on the side of the installation (degrees)
Figure 6 – Ammonia flux determined by the SMOAE method in function of angle of the wind at the lateral opening.
The Tukey test at the significance level of p < 0.01, indicated that there was significant differences between NH3 flux determined by the SMOAE method
with winds at 90° and 45°. It was found that when the dominant wind was at 90°, the ammonia fluxes were greater when compared to winds at 45°. According to Osório (2011b), this may be due to the fact that when the winds enter at 90° they result in greater NH3 accumulations at the lateral exits due to
the effects generated by the guard rails and building support columns.
samplers 6, 8 and 9 located on the lateral wall in the experimental data obtained by the SMOAE in relation with the others samplers as a function of sampler localization between 8:00 to 10:00 AM. No significant differences among the samplers was observed between 2:00 to 4:00 PM.
Figure 8 – Ammonia flux calculated by the SMOAE as a function of location of the samplers on the lateral wall from 2:00 to 4:00 PM.
In both situations (from 8:00 to 10:00 AM and 2:00 to 4:00 PM) the values obtained at the ends of the lateral wall on lines A and O (Figure 2) are less than lines B and C (Figure 2). This may be due to the fact that the birds generally gathered in the central regions (B and C lines) of the poultry buildings and as a consequence there is a greater concentration of manure and formation of ammonia gas, coinciding with that reported by Teye and Hautala (2008) and Tinôco et al. (2008).
Figure 9 – Typical distribution of ammonia flux at the lateral wall: a) between 8:00 and 10:00 AM and b) between 2:00 and 4:00 PM.
a)
This result can be explained by the fact that the curtains are opened early in the morning, and the NH3 concentration and air velocity distribution is
almost uniform in entire area for the lateral wall. In the afternoon, when the curtains have already been open for hours the air movement tends to stabilize, generating lower concentrations than in the morning.
B7
Adaptation of the SMOAE (Saraz method for determination of ammonia emissions) presented good behavior and could be an alternative for determining ammonia flux emitted by the lateral openings of the poultry houses submitted to natural ventilation.
The proposed method may be used in conditions of natural ventilation with wind speeds greater than 0.1 m s(1 and NH3 concentrations greater than 1
ppm, which are the minimum values registered in these conditions. Although the SMOAE method is less precise than other methods such as continuous monitoring with external and internal tracer gases, it may be a viable and reliable alternative due to its simplicity of application and low cost.
No differences were encountered in ammonia flux at the twelve points located at the lateral openings along the length of the upwind side of the building, suggesting that future studies should continue placing samplers at the minimal twelve points used in this study due to climatologic variability of the location characteristics of subtropical and tropical climates where the wind changes direction frequently.
C7 < D
37
AROGO, J.; WESTERMAN, P.W.; HEBER, A.J. A review of ammonia emissions from confined animal feeding operations. &!$ !#% $ ( %0
, v. 46, n. 3, p. 805(817, 2003.
ASSOCIATION OF OFFICIAL ANALITICAL CHEMISTS – AOAC. (( # ! %0 ( !$! 8 . 11.ed. Washington, O.C., 1970. 1015 p.
BLUNOEN, J.; VINEY, P.; ANEJA, P.; WESTERMAN, W. Measurement and analysis of ammonia and hydrogen sulphide emissions from a mechanically ventilated swine confinement building in North Carolina. % .0 & #
$+ & $ $%, v. 42, p. 3315(3331, 2008.
OEMMERS, T.G.M.; BURGESS, L.R.; PHILLIPS, V.R.; CLARK, J.A.; WATHES, C.M. Assessment of techniques for measuring the ventilation rate, using an experimental building section. 67 "& #7 $"7 7, v. 76, p. 71(81, 2000.
OEMMERS, T.G.M.; PHILLIPS, V.R.; SHORT, S.; BURGESS, L.R.; HOXEY, R.P.; WATHES, C.M. SE(structure and environment: validation of ventilation rate measurement methods and ammonia emission from naturally ventilated dairy and beef buildings in the United Kingdom. 6 )&$! ( "& #) %)&!
$" $ & $" !�, v. 79, p. 107(116, 2001.
FAULKNER, W.B.; SHAW, B.W. Review of ammonia emission factors for United States animal agriculture. % .0 & # $+ & $ $%, v. 42, n. 1, p. 6567(6574, 2008.
GATES, R.S.; CASEY, K.O.; WHEELER, E.F.; XIN, H.; PESCATORE, E.A.J. U.S. broiler housing ammonia emissions inventory. % .0 & #
$+ & $ $%, v. 42, n. 14, p. 3342(3350, 2008.
GATES, R.S.; XIN, H.; CASEY, K.O.; LIANG, Y.; WHEELER, E.F. Method for measuring ammonia emissions from poultry houses. 67 .. ) %&8
!�, v. 14, n. 3, p. 622(634, 2005.