Peripheral Blood Cells in Patients with SLE Reduces the
Muramyl Dipeptide-Induced IL-10 Production
Shui-Lian Yu1, Chun-Kwok Wong2, Purple Tsz-Yan Wong2, Da-Peng Chen2,3, Cheuk-Chun Szeto1, Edmund K. Li1, Lai-Shan Tam1*
1Department of Medicine and Therapeutics, Prince of Wales Hospital, The Chinese University of Hong Kong, Hong Kong, China,2Department of Chemical Pathology, Prince of Wales Hospital, The Chinese University of Hong Kong, Hong Kong, China,3Department of Clinical Laboratory, Children’s Hospital of Chongqing Medical University, Chongqing, China
Abstract
Background:Pattern recognition receptors (PRRs) such as Toll-like receptors are aberrantly expressed of peripheral blood mononuclear cells (PBMCs) in systemic lupus erythematosus (SLE) patients, for playing immunopathological roles.
Methodology/Principal Findings: We investigated the expression and function of the PRR nucleotide-binding oligomerization domain (NOD2) in SLE. NOD2 expression in T, B lymphocytes, monocytes, myeloid dendritic cells (mDCs) and plasmacytoid dendritic cells (pDCs) was assessed in SLE patients and healthy controls (HCs) using flow cytometric analysis. Ex vivo production of cytokines from PBMCs upon NOD2 agonist muramyl dipeptide (MDP) stimulation was assessed using Cytometric Bead Array. Over-expression of NOD2 in monocytes was observed in immunosuppressant naı¨ve SLE patients, and was positively associated with longer disease duration. Immunosuppressive therapy was an independent explanatory variable for downregulating NOD2 expression in CD8+T, monocytes, mDCs and pDCs.Ex vivobasal productions of cytokines (IL-6, IL-8 and IL-10) were significantly increased in immunosuppressant naı¨ve patients and patients with active disease despite immunosuppressants compared with HCs. Upon MDP stimulaiton, relative induction (%) of cytokines (IL-1b) from PBMC was significantly increased in immunosuppressant naı¨ve patients with inactive disease, and patients with active disease despite immunosuppressant treatment compared with HCs. Immunosuppressant usage was associated with a decreased basal production and MDP induced relative induction (%) of IL-10 in patients with inactive disease compared with immunosuppressant naı¨ve patients and HCs.
Conclusions/Significance: Bacterial exposure may increase the NOD2 expression in monocytes in immunosuppressant naı¨ve SLE patients which can subsequently lead to aberrant activation of PBMCs to produce proinflammatory cytokines, implicating the innate immune response for extracellular pathogens in the immunopathological mechanisms in SLE. Immunosuppressant therapy may downregulate NOD2 expression in CD8+ T lymphocytes, monocytes, and DCs in SLE
patients which subsequently IL-10 reduction, contributing towards the regulation of immunopathological mechanisms of SLE, at the expense of increasing risk of bacterial infection.
Citation:Yu S-L, Wong C-K, Wong PT-Y, Chen D-P, Szeto C-C, et al. (2011) Down-Regulated NOD2 by Immunosuppressants in Peripheral Blood Cells in Patients with SLE Reduces the Muramyl Dipeptide-Induced IL-10 Production. PLoS ONE 6(8): e23855. doi:10.1371/journal.pone.0023855
Editor:Luwen Zhang, University of Nebraska – Lincoln, United States of America ReceivedFebruary 8, 2011;AcceptedJuly 26, 2011;PublishedAugust 19, 2011
Copyright:ß2011 Yu et al. This is an open-access article distributed under the terms of the Creative Commons Attribution License, which permits unrestricted use, distribution, and reproduction in any medium, provided the original author and source are credited.
Funding:This study is supported by research grant from The Chinese University of Hong Kong. The funders had no role in study design, data collection and analysis, decision to publish, or preparation of the manuscript.
Competing Interests:The authors have declared that no competing interests exist. * E-mail: lstam@cuhk.edu.hk
Introduction
Systemic lupus erythematosus (SLE) is an autoimmune disease with unknown etiology affecting more than one million individuals each year. It is characterized by B and T cell hyperactivity, and defects in the clearance of apoptotic cells and immune complexes [1]. Besides genetic factors, environmental triggers can also contribute to pathogenesis of SLE. An infectious etiology of SLE has been longstanding hypothesis [2,3,4] and with the discovery of pattern recognition receptors (PRRs) in SLE patients, the role of bacteria and viruses in the pathogenesis of SLE has been invigorated.
co-stimulatory molecules, maturation of dendritic cells (DCs) and stimulation of B cells [7,8]. Being the most studied PRRs, toll-like receptors (TLRs) mediated intracellular signaling is a crucial link between innate and adaptive immunity [9]. Peripheral blood mononuclear cells (PBMCs) of SLE patients with a higher expression of TLRs are more prone to be activated by diverse TLR ligands when compared with HCs [7,10]. Signaling through MyD88- and Toll-IL-1 receptor-domain-containing adapter-inducing interferon-b (TRIF)-dependent pathways results in the activation of type I interferons (IFN)s, resulting in inflammation and subsequent tissue damage in SLE [7,10,11].
In contrast to the well elucidated membrane-bound TLRs, cytoplasmic nucleotide binding oligomerisation domain (NOD) receptors are a new family of PRRs for the recognition of extracellular PAMPs [12,13]. Two NOD-like receptor (NLR) proteins, namely NOD1 and NOD2, can participate in the signaling events triggered by host recognition of specific motifs of bacterial peptidoglycans (PGNs) and, upon activation, induce the production of proinflammatory mediators [12]. NOD1 recognizes products from gram-negative bacteria (diaminopimelic acids), whereas NOD2 senses muramyl dipeptide (MDP), a peptidoglycan derived peptide from gram-negative as well as gram-positive bacteria [14]. It has been shown that NLRs complement and synergize with TLRs in innate immune responses [5,6,15,16]. NLRs are associated with inflammatory bowel disease such as Crohn’s disease (CD) [17]. However, the precise mechanisms by which NOD-mediated recognition of PGNs in the pathogenesis of inflammatory diseases are still unclear. Possible pathogenic mechanisms in rheumatoid arthritis (RA) patients and murine experimental models included [6,16] (1) NOD2 functions to induce proinflammatory effects in the inflamed joint, whereas NOD1 has mainly an inhibitory role, exemplified by the inhibition of cytokine production and decrease in cell influx in a model of streptococcal cell wall (SCW)-induced arthritis; (2) NOD2 act synergistically with TLR in the production of proinflammatory and destructive mediators in RA patients. A better understanding of the intracellular events induced by the interaction between NLR and PGNs is therefore crucial for the elucidation of the mechanisms of both the recognition of pathogens by the innate immune system and the pathogenesis of chronic inflammation.
Apart from the putative link between genetic mutations of NOD2 and SLE [18,19,20,21,22,23], little is known regarding the expression and function of NOD2 in SLE. Therefore, in this cross-sectional study, we investigated the role of NOD2 in the peripheral antigen presenting cells (APCs), T, B lymphocytes, as well as the role of NOD2 in the modulation of proinflammatory cytokines induced by NOD2 ligand MDP of SLE patients and control subjects.
Methods
SLE patients, control subjects, and blood samples
Forty-seven SLE patients of Southern Chinese origin were recruited at the Rheumatology Out-Patient Clinic of the Prince of Wales Hospital, the Chinese University of Hong Kong. Diagnosis of SLE was established according to the 1997 American College of Rheumatology (ACR) revised criteria for the classification of SLE.[24] Patients were excluded from the study if they had prior treatment with a monoclonal antibody or other biologic agents. SLE patients were divided into 3 groups according to disease activity as reflected by the systemic lupus erythematosus disease activity index (SLEDAI) [25] and the use of immunosuppressants as list below: Group 1) Patients with inactive disease (SLEDAI,4) who were never treated with immunosuppressants since the
diagnosis or within the past 10 years, whichever longer; Group 2) Patients with inactive disease (SLEDAI,4) who had received or are currently on immunosuppressants; Group 3) Patients with active disease (SLEDAI.4) who had received or are currently on immunosuppressants. Thirty-one age- and sex-matched healthy Chinese volunteers were recruited as controls (HC group). Twelve mls of ethylenediamine tetra-acetic acid (EDTA) venous periph-eral blood were collected from each patient and control.
Ethics approval has been obtained from Ethics Committee of The Chinese University of Hong Kong-New Territories Ease Cluster Hospitals, and informed consent was obtained from all participants according to the Declaration of Helsinki.
Clinical and laboratory parameters
Patient information with regard to demographic characteristics, clinical features, serological profile and medications were retrieved from medical records. Physical examinations and laboratory investigations including complete blood count, liver and renal functions, levels of anti-double stranded DNA (dsDNA) titer, serum complements C3 and C4 levels were performed at study visit. SLEDAI [25] and Systemic Lupus International Collaborat-ing Clinics score (SLICC) [26] were evaluated durCollaborat-ing clinical assessment. Serum level of anti-dsDNA was measured by in house ELISA using a calibration curve generated from six standards which were prepared with reference to the WHO international standard serum Wo80. The interassay coefficient of variation of the immunoassay for low and high controls was 14.7 and 6.7%, respectively. Serum C3 and C4 levels were determined by immunonephelometry (Immage 800; Beckman Coulter, Califor-nia, USA).Flare is defined as increase in SLEDAI score by 3 or more compared to the last clinical visit [27,28]. Major organ involvement was defined as the involvement of one or more of the following organs: the central nervous system, kidney, lung, heart and the hematologic system (hemolytic anemia, platelet
,100,000/mL). Immunosuppressive agents included prednisolone, hydroxychloroquine (HCQ), azathioprine (AZA), cyclophospha-mide (CYC) (oral or IV), cyclosporin A and mycophenolate mofetil (MMF) were prescribed for SLE patients.
Flow cytometric analysis for T, B lymphocytes, monocytes and dendritic cells
PBMCs from SLE patients and HCs were purified by Ficoll Plus gradient centrifugation (GE Healthcare Life Sciences, NJ, USA). R-phycoerythrin (PE)-conjugated CD4, peridinin chlorophyll protein (PerCP)-conjugated CD8 and allophycocyanin (APC)-conjugated CD19 antibodies were purchased from BD Pharmin-gen Corp. for the identification of the CD4+
T, CD8+
T and CD19+
B lymphocyte sub-populations. Peripheral blood mono-cytes were analyzed by excluding lymphomono-cytes using their forward-and side-scatter properties [7].
Flow cytometric analysis of the expression of NOD2 in T, B lymphocytes, monocytes and DCs
The expression of NOD2 of different immune cell types of SLE patients and control subjects was investigated by flow cytometry (BD FACSCalibur, BD Biosciences Corp, CA, USA) as previously described [7]. Serum-blocked PBMCs were fixed and permeabi-lised using Fix/Perm solution (BD Biosciences, Mississauga, ON, Canada) for the intracellular staining of NOD2. Unconjugated mouse anti-NOD2 antibody (Bio-legend Corp, CA, USA), corresponding mouse IgG1, k isotypic control antibody (BD Pharmingen Corp., San Diego, CA, USA), together with a fluorescein iso-thiocyanate (FITC)-conjugated goat anti-mouse IgG (H+L) secondary antibodies (Zymed Laboratories, Inc., CA, USA), were used for intracellular staining. The expression of NOD2 in final cell suspension with 10,000 events was assessed using flow cytometry and the results were expressed as mean fluorescence intensity (MFI).
Ex vivoinduction of cytokines by NOD2 ligand
Aliquots of 16105 cells resuspended PBMCs in culture
medium RPMI1640 supplemented with 10% fetal calf serum (Gibco Laboratories) were dispensed in each well of a 96-well plate (Nalge Nunc International, IL, USA). The culture medium used was free of detectable endotoxin (,0.1 EU/ml) and all other solutions were prepared using pyrogen-free water and sterile polypropylene plastic ware. The cells were then incubated with or without NOD2 ligand muramyl dipeptide (MDP) (Invivogen Corp, San Diego, CA, USA) at 0.5mg/ml for 24 h at 37uC in a 5% CO2 atmosphere. The cell-free supernatant was harvested and stored at 270uC for subsequent assays of cytokines and chemokines.
Assay of the induction of human cytokines by NOD2 stimulation
The basal concentration and induction of cytokines including interleukin (IL)-1b, tumour necrosis factor (TNF)-a, IL-6, IL-8 and IL-10 were measured simultaneously using human inflam-matory cytokine Cytometric Bead Array (BD Pharmingen Corp., San Diego, CA, USA) using flow cytometry (FACSCalibur, BD Biosciences). Supernatant samples were analyzed using a multi-fluorescence BD FACSCaliburTM flow cytometer with BD CellQuestTM software and BDTM CBA software. The relative percentage inductions of cytokines compared with medium control was calculated based on the percentage difference of induction in medium and after NOD2 ligand stimulation. Relative induction of cytokine (%) was calculated by the equation, (induction of cytokine by NOD2 ligand activation -induction of cytokine of medium control)/-induction of cytokine of medium control6100%.
Statistical analysis
Results were expressed as mean6standard (SD) for normally distributed data. Non-normally distributed data were expressed as median (interquartile range, IQR). Chi-squared tests were used for categorical variables. For continuous variables, Student’st-test and Mann-Whitney U tests were used, where appropriate. Association between the potential explanatory variables and NOD2 expression were tested using Chi-square tests for categorical variables and Person or Spearman correlation for continuous variables with normal and skewed distribution, respectively. Variables with p value ,0.05 in the univariate analysis were entered into linear regression analysis (stepwise, forward). Variables that were skewed were logarithmically
transformed before entering the regression analysis. All hypoth-eses were 2-tailed, andpvalues,0.05 were consider significant. Analyses were performed using SPSS for Windows, version 13.0 (SPSS Inc., Chicago, IL, USA).
Results
Characteristics of SLE patients and control subjects
Forty-seven female Chinese SLE patients were recruited and divided into 1 of 3 SLE groups according to the current disease activity and the use of immunosuppressants as listed before (Group 1, 2 and 3: n = 17, 13 and 17 respectively). Thirty-one age-matched (36612 years) female healthy Chinese volunteers were recruited as controls. Demographics and clinical characteristics were summarized in Table 1. The mean disease duration among the three SLE groups was similar. Group 1 had low cumulative inflammatory burden as indicated by a significantly lower damage index (SLICC) and a significantly lower prevalence of major organ involvement compared to Groups 2 and 3, and a low disease activity not requiring immunosuppressants. Current disease activity as reflected by the SLEDAI scores were significantly higher in Group 3 compared to Groups 1 and 2 according to the study design, and all patients in Group 3 had a recent flare of disease activity. Serologically, Group 3 patients had a significantly lower level of C3 and C4, and a higher prevalence of elevated anti-dsDNA antibody levels compared with Group 1. Clinical manifestations at the time of study included neuropsychiatric (4/ 47, 9%), nephritis (27/47, 57%), serositis (4/47, 9%), haemato-logical (14/47, 30%) and arthritis (18/47, 38%). Cutaneous manifestations included discoid rash (3/47, 6%), malar rash (11/ 17, 23%), photosensitivity (7/47, 15%) and oral ulcers (3/47, 6%). Group 3 patients had a significantly higher prevalence of nephritis (17/17, 100%) and hematological involvement (9/17, 53%), as well as a significantly higher proportion of patients who had received MMF.
Protein expression of NOD2 in T and B lymphocytes, monocytes and DCs
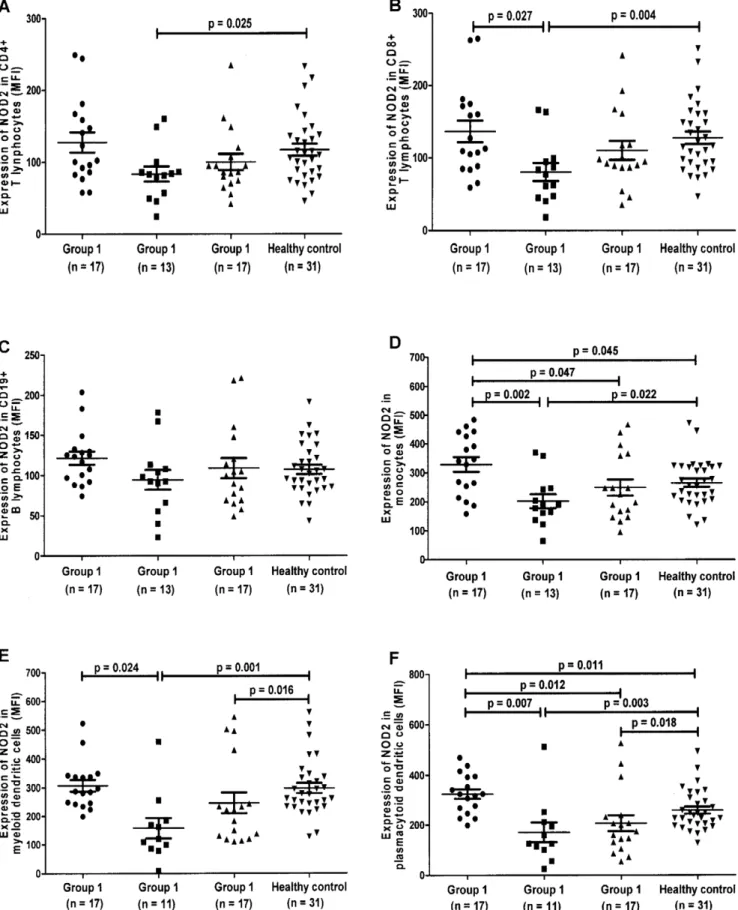
The differential protein expression of intracellular pathogen recognition receptor NOD2 in (A) CD4+ T, (B) CD8+ T, (C) CD19+B, (D) Monocytes, (E) mDCs and (F) pDCs of SLE patients and HCs by flow cytometry were shown in scatter plots as average mean fluorescence intensity (MFI) (Figure 1).
Effects of SLE on NOD2 expression compared to healthy controls
NOD2 expression in monocytes (Figure 1D, p= 0.045) and pDCs (Figure 1F,p= 0.011) were significantly increased in SLE patients with inactive disease who were not receiving immuno-suppressive treatment (Group 1) when compared to HCs.
Effects of immunosuppressants on NOD2 expression in SLE compared to healthy controls
For SLE patients who had been on immunosuppressants, NOD2 expression was significantly decreased in mDCs (Figure 1E,
p= 0.016) and pDCs (Figure 1F,p= 0.018) of patients with active disease (Group 3) when compared to HCs. Similarly, significantly decreased NOD2 expression was observed in CD4+ T lympho-cytes (Figure 1A, p= 0.025), CD8+ T lymphocytes (Figure 1B,
p= 0.004), monocytes (Figure 1D, p= 0.022), mDCs (Figure 1E,
Table 1.Demographic and clinical characteristics of patients with systemic lupus erythematosus.
SLE patients (n = 47)
Group 1 (n = 17)
Group 2 (n = 13)
Group 3 (n = 17)
Demographic characteristics
Sex (female/male) 17/0 13/0 17/0
Age at study, mean6s.d. (range), year 42615 (12–63) 44610 (26–65) 36612 (19–59)
Clinical features
SLE duration, mean6s.d. (range), year 965 (0–18) 867 (0–27) 866 (0–21)
SLICC 0 (0–0)&, * 1 (0–2) 0 (0–4)
SLEDAI score 0 (0–1)*** 0 (0–2)##
6 (4–11) Flare333
, no. (%) 0/17 (0%)*** 0/17 (0%)###
17/17 (100%) Serological features
Serum complement C3, g/l 0.8 (0.8–1.1)** 0.7 (0.6–1.0)#
0.6 (0.4–0.8)
Serum complement C4, g/l 0.2 (0.2–0.3)** 0.2 (0.2–0.3)#
0.1 (0.1–0.2) Elevated anti-dsDNA (.100 IU/ml), no. (%) 0/17 (0%)&&, *** 7/13 (54%) 14/17 (82%)
Anti-dsDNA titer, IU/ml n.a. 3416239 (150–840) 3836271 (115–1000)
Number of major organ involvement, n. (%) 5/17 (29%)&&&, ** 11/13 (85%) 17/17 (100%)
0 12/17 (71%)&&&, ** 2/13 (15%) 0/17 (0%)
1 5/17 (29%) 7/13 (54%)#
2/17 (12%)
$2 0/17 (0%)&, *** 4/13 (31%)##
15/17 (88%) Clinical manifestation, n. (%)
Neuropsychiatric 4/47 (9%)
0/17 (0%) 1/13 (8%) 3/17 (18%)
Nephritis 27/47 (57%)
2/17 (12%)&&, *** 8/13 (62%)##
17/17 (100%)
Serositis 4/47 (9%)
0/17 (0%) 1/13 (%) 3/17 (18%)
Hematologic 18/47 (38%)
3/17 (18%)* 6/13 (46%) 9/17 (53%)
Immunosuppressive therapy ever, n (%) n.a. 13/13 (100%) 17/17(100%)
Prednisolone n.a. 12/13 (92%) 16/17 (94%)
Hydroxychloroquine n.a. 10/13 (77%) 13/17 (76%)
Azathioprine n.a. 10/13 (77%) 10/17 (59%)
Cyclophosphamide (oral or IV) n.a. 7/13 (54%) 4/17 (24%)
Cyclosporin A n.a. 1/13 (8%) 2/17 (12%)
Mycophenolate mofetil n.a. 1/13 (8%)# 7/17 (41%)
Values are median (interquartile range, IQR) unless stated otherwise; s.d., standard deviation; n.a., not applicable. SLE, systemic lupus erythematosus; Group 1) Patients with inactive disease (SLEDAI,4) who were never treated with immunosuppressants since the diagnosis or within the past 10 years, whichever longer; Group 2) Patients with inactive disease (SLEDAI,4) who had received or are currently on immunosuppressants; Group 3) Patients with active disease (SLEDAI.4) who had received or are currently on immunosuppressants. SLEDAI, systemic lupus erythematosus disease activity index; SLICC, Systemic Lupus International Collaborating Clinics Score;
3
‘‘Never’’ refers to SLE patients never be given treatment of immunosuppressants [prednisolone, hydroxychloroquine, azathioprine, cyclophosphamide (oral or IV), cyclosporin A and mycophenolate mofetil] since the diagnosis of SLE or within recent 10 years;
33
‘‘Ever’’ refer to use of immunosuppressants since the diagnosis of SLE. 333
‘‘Flare’’ is defined as increase in the SLEDAI score by 3 or more; &p
,0.05, &&p
,0.01, &&&p
,0.001, comparing between Group 1 and Group 2; *p,0.05,
**p,0.01,
***p,0.001, comparing between Group 1 and Group 3; #p
,0.05, ##p
,0.01, ###
Figure 1. Expression of intracellular NOD2 in CD4+T, CD8+ T, CD19+B lymphocytes, monocytes, myeloid dendritic cells and
plasmacytoid dendritic cells using flow cytometry. Group 1) Patients with inactive disease (SLEDAI ,4) who were never treated with
immunosuppressants since the diagnosis or within the past 10 years, whichever longer; Group 2) Patients with inactive disease (SLEDAI,4) who had
received or are currently on immunosuppressants; Group 3) Patients with active disease (SLEDAI .4) who had received or are currently on
immunosuppressants. The differential protein expression of intracellular pathogen recognition receptor NOD2 in (A) CD4+T lymphocytes, (B) CD8+T
lymphocytes, (C) CD19+B lymphocytes, (D) Monocytes, (E) myeloid dendritic cells (F) plasmacytoid dendritic cells of SLE patients and healthy controls
Effects of immunosuppressants on NOD2 expression in SLE
For SLE patients with inactive disease (Groups 1 and 2), the expression of NOD2 were found to be significantly lower in CD8+
T (Figure 1B,p= 0.027), monocytes (Figure 1D,p= 0.002), mDCs (Figure 1E,p= 0.024), pDCs (Figure 1F,p= 0.007) in the group treated with immunosuppressants (Group 2) when compared to the non-treated group (Group 1). Moreover, NOD2 expression was decreased significantly in monocytes (Figure 1D, p= 0.047) and pDCs (Figure 1F, p= 0.012) in SLE patients with active disease despite on immunosuppressive treatment (Group 3) compared with those with inactive disease who were not receiving immunosuppressive treatment (Group 1). However, there was no significant difference in NOD2 expression between SLE patients on immunosuppressants with (Group 3) and without (Group 2) active disease (Figure 1A–F) (allp.0.05).
Associations between clinical demographic variables, the use of immunosuppressants and the expression of NOD2
Tables 2, 3 and 4 summarized the association between clinical and treatment variables and the expression of NOD2 in the univariate analysis (Table 2: continuous variables, Table 3 and 4: categorical variables). There were positive correlations between disease duration and the expression of NOD2 in CD8+T, CD19+
B and monocytes (all p,0.01) (Table 2). Significantly increased NOD2 expression in CD19+B was found in patients with more than one major organ involvement compared with those without major organ involvement (118651 MFI vs 93631 MFI,p,0.05) (Table 3).
With regard to the role of immunosuppressants, the expression of NOD2 was significantly lower in CD4+ T, CD8+ T lymphocytes, monocytes, mDCs and pDCs of SLE patients ever treated with immunosuppressants when compared to those without immunosuppressants (Tables 3 and 4). Prednisolone use was associated with a significantly decreased expression of NOD2 in monocytes, mDCs and pDCs compared to the prednisolone naı¨ve group (Table 4). Significantly decreased expression of NOD2 was found in patients treated with HCQ and AZA in pDCs compared with those who never been treated with HCQ and AZA (p,0.01) (Table 4). NOD2 expression in the monocytes was significantly lower in patients treated with CYC compared to the CYC naı¨ve group (p,0.05). No differences were found in NOD2 expression between these patients who had or had not been treated with cyclosporin A or MMF (allp.0.05).
Risk factors associated with NOD2 expression in SLE
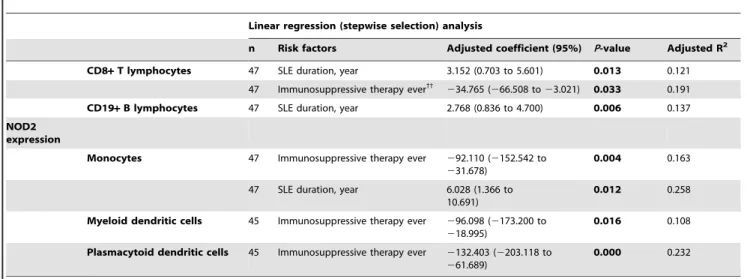
In order to address whether the clinical characteristics; use of immunosuppressive therapy ever; current and cumulative dose of immunosuppressants and are independent predictors affecting the expression of NOD2, all of the potential explanatory variables with ap-value less than 0.05 identified in the univariate analysis [including disease duration, major organ involvement ($1), current and cumulative dose of AZA, immunosuppressive therapy (prednisolone, HCQ, AZA and CYC) ever] were analyzed using linear regression analysis (Table 5). Ever use of immunosuppres-sive therapy was as an independent explanatory variable for downregulating the expression of NOD2 in CD8+ T [Adjusted coefficient (95%): 234.765 (266.508 to 23.021); Adjusted R2: 0.191], monocytes [Adjusted coefficient (95%): 292.110 (2152.542 to231.678); Adjusted R2: 0.163], mDCs [Adjusted coefficient (95%):296.098 (2173.200 to218.995); Adjusted R2: 0.108] and pDCs [Adjusted coefficient (95%): 2132.403 (2203.118 to 261.689); Adjusted R2: 0.232] (all p,0.05). On
the other hand, a longer disease duration was an independent risk factor for upregulating the expression of NOD2 in CD8+ T [Adjusted coefficient (95%): 3.152 (0.703 to 5.601); Adjusted R2: 0.121], CD19+ B [Adjusted coefficient (95%): 2.768 (0.836 to 4.700); Adjusted R2: 0.137] and monocytes [Adjusted coefficient (95%): 6.028 (1.366 to 10.691); Adjusted R2: 0.258] (all p,0.05) (Table 5).
Effects of NOD2 agonist (MDP) on the induction of cytokines from PBMC
In order to examine whether the NOD2 expression was functional, we exposed PBMC to specific NOD2 ligand MDP and investigated the ex vivo induction of cytokines using flow cytometry. As shown in Table 6, the basal productions of cytokines (IL-6, IL-8 and IL-10) were significantly increased in Group 1 and Group 3 compared with HCs (allp,0.05). Basal concentration of IL-10 was significantly higher in Group 2 compared to HCs, albeit significantly lower than Group 1.
As shown in Table 6, the relative induction (%) of cytokines (IL-1band IL-10) upon NOD2 ligand (MDP) stimulation from PBMC was significantly increased Group 1 compared with HCs (p,0.05). The relative induction (%) of IL-1b in response to MDP was increased in Group 3 compared to HCs (p,0.05). An observable diminished relative induction (%) of IL-10 was observed in Group 2 compared to Group 1 and HCs (p,0.05). No significant differences were observed for the relative induction (%) of TNF-a, IL-6 and IL-8 from PBMCs upon the activation by NOD2 ligand between the four groups (allp.0.05).
Discussion
Bacterial (Staphylococcus aureus, Streptococcal pneumonia, Escherichia coli andPseudomonas aeruginosa) [30] and viral infections (cytomeg-alovirus, Epstein-Barr virus, parvovirus B19 and papillomavirus) have been suggested to be pathogenic triggers for the development or exacerbation of SLE either through persistent infection or the presence of remnants of pathogens [31,32]. Recognition of these microorganisms is mediated, at least in part, by TLRs, and TLR-induced pathways are responsible for the induction of proin-flammatory mediators [33,34]. In addition to TLRs,Pseudomonas aeruginosa and Streptococcal pneumonia can also be recognized by NOD1 and NOD2, respectively [35]. Activation of NOD1 and NOD2 has been shown to stimulate the cytokine production and neutrophil recruitment [36], and mediate TLR-induced cytokine production [5,15], respectively. Apart from the putative link between the genetic variants of NOD2 and SLE [18,19,20,21,22,23], little is known about the expression and function of NOD2 in SLE.
patients, and NOD2 activation in synovial fibroblasts leads to the expression of proinflammatory cytokines and matrix-degrading enzymes via p38 mitogen-activated protein kinases (MAPK) and NF-kB signaling pathways [6]. In agreement with previous studies, we observed a significantly higher expression of NOD2 in monocytes and pDCs in immunosuppressive therapy naı¨ve SLE patients (Group 1) compared with HCs. Inflammatory burden as reflected by the disease duration played a role as an independent explanatory variable for upregulating the expression of NOD2 in monocytes.
Cytokines play an important and diverse role in the pathogen-esis of SLE, and their balance determines disease activity [41,42]. Proinflammatory cytokines such as IL-1b, IL-6, IL-8 and TNF-a
are found to possess potent stimulatory effects on T, B lymphocytes, natural killer (NK) cells, and neutrophils in increasing the biosynthesis of prostaglandins and acute-phase proteins [43], whereas Th2 cells produce anti-inflammatory cytokine, IL-10, to modulate immunity to extracellular parasites [44]. Elevated basal production of cytokines including TNF-a, IL-6, IL-8 and IL-10, both in serum and culture, has been reported in
SLE patients compared with healthy controls [45,46,47]. Our results concurred with previous studies showing that the basal production of cytokines (IL-6, IL-8 and IL-10) was significantly increased in immunosuppressive naı¨ve patients (Group 1) and patients with active disease despite immunosuppressive therapy (Group 3) compared with HCs, implying that the imbalance between proinflammatory (IL-6 and IL-8) and anti-inflammatory (IL-10) cytokines may trigger the inflammatory process in SLE.
In order to confirm whether the NOD2 protein was functional, NOD2 agonist (MDP)-stimulated production of pro- and anti-inflammatory cytokines from SLE patients and HCs were measured. Production of IL-1bhas been reported upon stimula-tion with MDP [48,49], while IL-1bblockade profoundly inhibits MDP-induced cytokine production in macrophage, demonstrating a key role of IL-1b in NOD2-mediated inflammation[49]. Consistent to the previous finding, upon stimulation with NOD2 agonist, our data showed an observable increased relative induction (%) of IL-1b upon MDP stimulation in SLE patients (Groups 1 and 3) compared to controls. IL-1 is one of the most pleiotropic pro-inflammatory and immunostimulatory cytokines.
Table 2.Univariate analysis: Person or Spearman’s correlation between the expression of NOD2 and clinical demographic variables in SLE patients (continuous variables).
NOD2 expression
CD4+T lymphocytes
CD8+T
lymphocytes CD19+B Monocytes mDC pDC
n r n r n r n r n r n r
Clinical characteristics
SLE duration, year 47 0.287 47 0.423** 47 0.486** 47 0.466** 45 0.255 45 0.132
SLEDAI score 47 0.184 47 0.115 47 0.265 47 0.221 45 0.245 45 0.319
Serum C3, g/l 47 0.067 47 0.067 47 0.115 47 0.201 45 0.046 45 0.168
Serum C4, g/l 47 0.077 47 0.058 47 0.071 47 0.108 45 20.019 45 0.095
Anti-dsDNA titer, IU/ml 21 0.221 21 20.131 21 20.400 21 20.378 20 20.031 20 20.076 Immunosuppressive therapy
Prednisolone
Current dose, mg 29 20.125 29 20.047 29 20.043 29 20.019 27 0.206 27 20.095
Cumulative dose, g 29 0.018 29 20.096 29 0.156 29 20.105 27 20.017 27 20.015
Hydroxychloroquine
Current dose, mg 19 0.223 19 0.280 19 0.109 19 0.351 18 0.586 18 0.177
Cumulative dose, g 23 0.320 23 0.008 23 0.045 23 0.058 22 0.203 22 0.001
Azathioprine
Current dose, mg 7 20.532 7 20.808* 7
20.315 7 20.611 6 20.440 6 20.371
Cumulative dose, g 20 20.147 20 20.087 20 20.138 20 20.045 18 20.560* 18 0.041 Cyclophosphamide (oral or IV)
Current dose, mg 6 20.949 6 20.633 6 20.633 0 20.633 6 20.791 6 20.649
Cumulative dose, g 11 0.529 11 0.242 11 0.295 11 20.258 9 0.333 9 20.171
Cyclosporin A
Current dose, mg 1 n.a. 1 n.a. 1 n.a. 1 n.a. 1 n.a. 1 n.a.
Cumulative dose, g 3 n.a. 3 n.a. 3 n.a. n.a. 3 n.a. 3 n.a.
Mycophenolate mofetil
Current dose, mg 0 n.a. 0 n.a. 0 n.a. 0 n.a. 0 n.a. 0 n.a.
Cumulative dose, g 8 20.667 8 0.238 8 0.143 8 20.489 8 20.119 8 20.289
mDC, myeloid dendritic cells; pDC, plasmacytoid dendritic cells;r= Person or Spearman’s correlation coefficient; *p,0.05,
**p,0.01.
Overproduction of IL-1 has been shown to be involved in the pathogenicity of various autoimmune inflammatory diseases, including SLE. In an experimental model, mice deficient in IL-1b developed lower levels of anti-dsDNA antibodies, milder disease manifestations and reduced cytokine cascade that is the characteristics of overt experimental SLE [50]. Spontaneous release of IL-1 from SLE monocytes has been reported as increased in many, but not all studies [41,51,52]. Therefore, the proinflammatory state resulting from the increased expression of NOD2 in the immunosuppressive naive SLE patients, together with previous reports regarding the increase in the expression of TLRs [7], underscores the importance of the activation of innate immune mechanisms in SLE. Data from our group as well as others provided evidence which may suggest that certain bacterial/viral components from an initial infection may lead to the activation of innate immune receptors, which provokes an inflammatory reaction and contribute towards the initiation of the pathogenic process in SLE. Further functional, signaling and genetic work will need to be performed to investigate whether higher level of cytokines are a result of NOD2-mediated flare in SLE, or whether the pro- or anti-inflammatory cytokines play a role in initiating and perpatuating the NOD2-mediated inflam-matory process.
We have demonstrated that immunosuppressive therapy may play a role as an independent explanatory variable associated with the decreased expressions of NOD2 in CD8+ T, monocytes, mDCs and pDCs. Emerging evidence has reported that derivatives
and small molecule analogues of chloroquine and quinacrine suppress the over-activation of immune response.[53,54] These anti-malarial agents[55] (chloroquine, HCQ and quinacrine) used for the treatment of immune-mediated inflammatory disorders (IMID) such as SLE, are antagonists of TLR-9 and to a lesser extent, TLR-7 and -8 [54]. Similarly, high dose glucocorticoster-oids could also reduce thein vivoTLR responses by 70–90% [56]. The effects of TLR antagonists on NOD2 expression in SLE patients have not been well elucidated, nonetheless, a synergistic effect of NODs and TLRs has been reported in other diseases [6,57,58]. Whether immunosuppressive therapy may have a direct effect on downregulating the expression of NOD2 in SLE patients, or indirectly through the interaction between NOD2 and TLRs in SLE patients need further investigation.
In the present study, the basal concentration of IL-10 was significantly lower in patients with inactive disease receiving immunosuppressive therapy compared to those without immuno-suppressants. Furthermore, the use of immunosuppressant was associated with an observable diminished relative induction (%) of IL-10 upon stimulaiton with MDP in SLE patients with inactive disease. IL-10 is an important immunoregulatory cytokine that inhibits T cell function by suppressing the expression of proinflammatory cytokines such as TNF-a, IL-1, IL-6, IL-8, and
IL-12 [59–60]. It also inhibits antigen presenting cells by downregulating major histocompatibility complex class II (MHC-II) and B7 expression [61]. In addition to these inhibitory actions, IL-10 promotes B-cell-mediated functions, enhancing
Table 3.Univariate analysis: the relationship between clinical characteristics, the use of drugs ever and the expression of NOD2 in SLE patients (categorical variables).
NOD2 expression
CD4+T lymphocytes CD8+T lymphocytes CD19+B lymphocytes
Yes No Yes No Yes No
n n n n n n
Clinical characteristics
Flare3
17 100646 30 109654 17 110653 30 112660 17 109652 30 110640 Elevated anti-dsDNA
(.100 IU/ml)
21 93644 26 116655 21 100653 26 121660 21 102649 26 116640
Major organ involvement$1 32 103641 15 111669 32 109648 15 111669 32 118651* 15 93631 Clinical manifestations
Neuropsychiatric 4 110686 43 105648 4 113689 43 111656 4 112676 43 109641
Nephritis 27 99641 20 114662 27 104649 20 122667 27 109646 20 110643
Serositis 4 136667 43 103649 4 134673 43 110656 4 147657 43 106642
Hematologic 18 114647 29 101654 18 119650 29 107662 18 126648 29 99639
Immunosuppressive therapy ever33
30 93643* 17 128
658 30 98651* 17 136
661 30 103648 17 122634
Prednisolone 29 95641 18 122661 29 100650 18 130660 29 106647 18 116640
Hydroxychloroquine 23 100646 24 111656 23 105655 24 118660 23 110656 24 109635 Azathioprine 20 103643 27 108657 20 105653 27 117661 20 112643 27 108646 Cyclophosphamide
(oral or IV)
11 95635 36 109655 11 95640 36 117661 11 104632 36 110647
Cyclosporin A 3 75610 44 108652 3 96619 44 113659 3 98619 44 110645
Mycophenolate mofetil 8 96638 39 107653 8 121649 39 110659 8 113651 39 109643 3
‘‘Flare’’ is defined as increase in the SLEDAI score by 3 or more; 33
‘‘Ever’’ refers to use of immunosuppressants [prednisolone, hydroxychloroquine, azathioprine, cyclophosphamide (oral or IV), cyclosporin A and mycophenolate mofetil] since the diagnosis of SLE;
*p,0.05.
Table 4.Univariate analysis: the relationship between clinical characteristics, the use of drugs ever and the expression of NOD2 in SLE patients (categorical variables).
NOD2 expression
Monocytes Myeloid dendritic cells Plasmacytoid dendritic cells
Yes No Yes No Yes No
n n n n n n
Clinical characteristics
Flare3
17 2496114 30 2746115 17 2466150 28 2496122 17 2076132 28 2656126 Elevated anti-dsDNA
(.100 IU/ml)
21 2346117 26 2906107 20 2266147 25 2656118 20 2106140 25 2716120
Major organ involvement
$1
32 2416104 15 3166121 30 2406146 14 264698 30 2326137 14 2896117
Clinical manifestations
Neuropsychiatric 4 2286155 43 1686111 4 2216184 41 2506128 4 2396140 41 2436131 Nephritis 27 2376106 20 3026117 25 2326141 20 2696104 25 2226135 20 2796119 Serositis 4 2906130 43 2636114 4 3336219 41 2396121 4 2096169 41 2466128 Hematologic 18 2946118 29 2476110 18 2806161 27 2266105 18 2526154 27 2376114 Immunosuppressive
therapy ever33 30 2296104
** 17 329
6105 28 2116143*** 17 308
683 28 1926130*** 17 325 679
Prednisolone 29 2326105* 18 318
6114 27 2126146** 18 301
686 27 1936133*** 18 318 683
Hydroxychloroquine 23 2476111 24 117624 22 2306154 23 2646106 22 2016143** 23 283 6104
Azathioprine 20 231699 27 2916120 18 2236156 27 2646113 18 1996133* 27 272 6122
Cyclophosphamide (oral or IV)
11 198677* 36 285
6177 9 2016102 36 2596137 9 1866100 36 2576134
Cyclosporin A 3 185658 44 2706115 3 169650 42 2536134 3 125647 42 2516130 Mycophenolate mofetil 8 2726133 39 2646112 8 2696129 37 2436134 8 2526142 37 2416130 3
‘‘Flare’’ is defined as increase in the SLEDAI score by 3 or more; 33
‘‘Ever’’ refers to the use of immunosuppressants [prednisolone, hydroxychloroquine, azathioprine, cyclophosphamide (oral or IV), cyclosporin A and mycophenolate mofetil) since the diagnosis of SLE;
*p,0.05, **p,0.01, ***p,0.001.
doi:10.1371/journal.pone.0023855.t004
Table 5.Independent risk factors associated with the expression of NOD2 in T and B lymphocytes, monocytes and DCs of SLE patients.
Linear regression (stepwise selection) analysis
n Risk factors Adjusted coefficient (95%) P-value Adjusted R2
CD8+T lymphocytes 47 SLE duration, year 3.152 (0.703 to 5.601) 0.013 0.121 47 Immunosuppressive therapy ever33
234.765 (266.508 to23.021) 0.033 0.191 CD19+B lymphocytes 47 SLE duration, year 2.768 (0.836 to 4.700) 0.006 0.137 NOD2
expression
Monocytes 47 Immunosuppressive therapy ever 292.110 (2152.542 to
231.678)
0.004 0.163
47 SLE duration, year 6.028 (1.366 to 10.691)
0.012 0.258
Myeloid dendritic cells 45 Immunosuppressive therapy ever 296.098 (2173.200 to
218.995)
0.016 0.108
Plasmacytoid dendritic cells 45 Immunosuppressive therapy ever 2132.403 (2203.118 to
261.689)
0.000 0.232
33
‘‘Ever’’ refers to the use of immunosuppressants [prednisolone, hydroxychloroquine, azathioprine, cyclophosphamide (oral or IV), cyclosporin A and mycophenolate mofetil] since the diagnosis of SLE.
survival, proliferation, differentiation and antibody production [62]. Hence, increased production of IL-10 could thus explain B cell hyperactivity and autoantibody production, two main features of the immune dysregulation in SLE. In fact, elevated levels of this molecule have been currently reported in SLE patients, frequently associated with the indicators of disease activity [63,64]. NOD2 mutation in CD patients results in the suppression of the production of IL-10 [65]. Here, we hypothesize that part of the beneficial effect of immunosuppressive therapy may be mediated by the downregulation of NOD2, resulting in a redution of the basal and MDP induced production of IL-10 in SLE patients. Further studies exploring the mechanisms of how immunosup-pressant regulate NOD2 expresssion and function in SLE will be warranted.
Failure to induce an effective cellular immune response because of inefficient activation of innate immunity and ineffective priming of the adaptive immune response in patients with lupus may lead to an increased prevalence as well as persistence of any infection. In patients with CD, dysfunctional NOD2 variants in the intestinal epithelial and phagocytic cells results in the deficiencies in epithelial-barrier function which subsequently lead to increased
bacterial invasion and inflammation at intestinal sites. Other study has demonstrated that NOD2-deficient mice infected orally with
L. monocytogeneshad a significantly greater bacterial burden in liver and spleen than wild-type mice [66]. NOD2-deficient mice have impaired resistance to mycobacterium tuberculosis infection through defective innate and adaptive immunity [67]. Our group also reported a higher prevalence of mycobacterial tuberculosis infection in patients with SLE [68], and there are several reports suggesting that mycobacterium tuberculosis infection precipitates SLE in patients from endemic areas [69]. Whether decreased NOD2 expression may contribute towards the induction and reactivation of chronic inflammation by mycobacterial infection in patients with SLE deserves further study. On the other hand, apart from the direct modulating effects, the use of immuno-suppressive agents may increase the risk of infections in SLE patients. Viral infections have been reported to down-regulate innate immune receptors in the host resulting in persistent infection, e.g. human papillomavirus virus (HPV) type 16 infection has been reported to down-regulate TLR 9 pathway promoting persistent infection in the host [70]. Similarly, chronic hepatitis C infection leads to a decrease in expression and functional
Table 6.Ex vivobasal production and relative induction of cytokines from NOD2 ligand activated PBMC in various groups.
Cytokines n
Basal production (IQR) (pg/105PBMCs) (Medium)
Relative induction (%) (IQR) (pg/105PBMCs)
(MDP)
Group 1 16 3.7 (2.9 to 4.4) 212.0 (135.2 to 296.7)D
IL-1b SLE Group 2 9 3.5 (3.3 to 3.7) 173.4 (156.8 to 244.1)
Group 3 11 3.3 (3.1 to 3.7) 217.2 (137.8 to 240.9)1
Healthy control 23 3.5 (3.1 to 4.1) 153.9 (106.6 to 192.6)
Group 1 16 3.0 (2.6 to 3.7) 24.2 (21.0 to 33.8)
TNF-a SLE Group 2 9 2.6 (2.2 to 3.1) 19.6 (12.2 to 30.6)
Group 3 11 2.9 (2.3 to 3.7) 23.5 (19.1 to 32.1)
Healthy control 23 2.6 (2.0 to 3.2) 19.4 (16.9 to 25.2) Group 1 16 12.2 (7.5 to 15.8)D
18.9 (12.8 to 33.5)
IL-6 SLE Group 2 9 10.8 (8.0 to 13.7) 12.1 (5.6 to 20.3)
Group 3 11 11.3 (9.1 to 16.4)11
23.3 (19.9 to 44.3) Healthy control 23 8.1 (5.3 to 10.8) 18.3 (14.7 to 19.6)
Group 1 16 929.8 (463 to 1263)D
258.1 (216.9 to 298.5)
IL-8 SLE Group 2 9 608.2 (407.9 to 809.7) 217.2 (137.8 to 240.9)
Group 3 11 727.2 (388.9 to 729.8)1
212.0 (135.2 to 296.7) Healthy control 23 552.8 (388.9 to 729.8) 192.4 (117.1 to 219.3)
Group 1 16 6.8 (4.3 to 14.0)&,DDD 57.4 (38.9 to 81.1)&&,D
IL-10 SLE Group 2 9 4.8 (3.8 to 5.3)WW
20.9 (14.4 to 38.5)W
Group 3 11 5.2 (5.0 to 5.6)11
40.5 (27.0 to 59.1)
Healthy control 23 2.4 (2.3 to 2.8) 33.6 (19.4 to 46.8)
Culture supernatant was obtained from PBMCs cultured with medium or NOD2 ligand (Muramyl dipeptide, MDP) for 24 hours. The basal production (pg/ml) and relative induction (%) of cytokines (IL-1b, TNF-a, IL-6, IL-8 and IL-10) by PBMCs were analyzed by flow cytometry. Numerical data are expressed as median (interquartile range, IQR). Group 1) Patients with inactive disease (SLEDAI,4) who were never treated with immunosuppressants since the diagnosis or within the past 10 years, whichever longer; Group 2) Patients with inactive disease (SLEDAI,4) who had received or are currently on immunosuppressants; Group 3) Patients with active disease (SLEDAI
.4) who had received or are currently on immunosuppressants. &p
,0.05, comparing between Group 1 and Group 2;
Dp ,0.05,
DDDp
,0.001, comparing between Group 1 with healthy control subjects;
W
p,0.05,
WWp
,0.01, comparing between Group 2 with healthy control subjects; 1
p,0.05, 11
impairment of TLR2 [71]. Whether bacteria could also make use of this immune evasion strategy in order to escape NOD2 recognition in patients with SLE would deserve further studies.
The main limitation of this study is that we only studied the function of NOD2 in the PBMCs. Further studies of the differential function of NOD in different immune cell types, detailed cellular regulatory mechanisms of NOD2 activation and the interaction among NOD2, TLRs and the effects of the pro-and anti-inflammatory cytokines in SLE would be worth studying. Although our findings have speculated that the immunosuppres-sive therapy may be as important factor in down-regulating the expression of NOD2, we did not explore the drug effect on different cell types bothin vivoandin vitro. It would be of interest to further explore the mechanism in regulating NOD2 expression and function by immunosuppressive agents including predniso-lone, TLR antagonists and other immunosuppressive therapies in SLE. Furthermore, a future prospective study with a larger sample size followed for a longer period of time is warranted to study the risk factors affecting the expression of NOD2 in SLE patients.
In conclusion, exposure to bacterial conserved molecular pattern may increase the expression of NOD2 in the monocytes
of immunosuppressant naı¨ve patients, which can subsequently lead to aberrant activation of PBMCs, resulting in the production of proinflammatory cytokines, implicating the innate immune response for extracellular pathogens in the immunopathological mechanisms in SLE. On the other hand, immunosuppressive therapies may downregulate the NOD2 expression in CD8+ T lymphocytes, monocytes, mDCs and pDCs in SLE patients which subsequently reduce IL-10 production, contributing towards the regulation of immunopathological mechanisms of SLE, at the expense of increasing the risk of concurrent bacterial infection.
Acknowledgments
The authors are grateful to Ms Lorraine L Tseung for her efforts into the logistics of this project.
Author Contributions
Conceived and designed the experiments: CKW LST CCS EKL. Performed the experiments: SLY CKW PTY DPC. Analyzed the data: SLY CKW PTY DPC. Contributed reagents/materials/analysis tools: CKW SLY PTY DPC. Wrote the paper: LST CKW SLY.
References
1. Mok CC, Lau CS (2003) Pathogenesis of systemic lupus erythematosus. J Clin Pathol 56: 481–490.
2. Verdolini R, Bugatti L, Giangiacomi M, Nicolini M, Filosa G, et al. (2002) Systemic lupus erythematosus induced by Epstein-Barr virus infection. Br J Dermatol 146: 877–881.
3. Tomita H, Yamada M, Sekigawa I, Yoshiike T, Iida N, et al. (2003) Systemic lupus erythematosus-like autoimmune abnormalities induced by bacterial infection. Clin Exp Rheumatol 21: 497–499.
4. Lerner MR, Andrews NC, Miller G, Steitz JA (1981) Two small RNAs encoded by Epstein-Barr virus and complexed with protein are precipitated by antibodies from patients with systemic lupus erythematosus. Proc Natl Acad Sci U S A 78: 805–809. 5. Fukata M, Vamadevan AS, Abreu MT (2009) Toll-like receptors (TLRs) and Nod-like receptors (NLRs) in inflammatory disorders. Semin Immunol 21: 242–253.
6. Ospelt C, Brentano F, Jungel A, Rengel Y, Kolling C, et al. (2009) Expression, regulation, and signaling of the pattern-recognition receptor nucleotide-binding oligomerization domain 2 in rheumatoid arthritis synovial fibroblasts. Arthritis Rheum 60: 355–363.
7. Wong CK, Wong PT, Tam LS, Li EK, Chen DP, et al. (2009) Activation profile of Toll-like receptors of peripheral blood lymphocytes in patients with systemic lupus erythematosus. Clin Exp Immunol 159: 11–22.
8. Marshak-Rothstein A (2006) Toll-like receptors in systemic autoimmune disease. Nat Rev Immunol 6: 823–835.
9. Werling D, Jungi TW (2003) TOLL-like receptors linking innate and adaptive immune response. Vet Immunol Immunopathol 91: 1–12.
10. Komatsuda A, Wakui H, Iwamoto K, Ozawa M, Togashi M, et al. (2008) Up-regulated expression of Toll-like receptors mRNAs in peripheral blood mononuclear cells from patients with systemic lupus erythematosus. Clin Exp Immunol 152: 482–487.
11. Creagh EM, O’Neill LA (2006) TLRs, NLRs and RLRs: a trinity of pathogen sensors that co-operate in innate immunity. Trends Immunol 27: 352–357. 12. Inohara, Chamaillard, McDonald C, Nunez G (2005) NOD-LRR proteins: role
in host-microbial interactions and inflammatory disease. Annu Rev Biochem 74: 355–383.
13. Kufer TA, Fritz JH, Philpott DJ (2005) NACHT-LRR proteins (NLRs) in bacterial infection and immunity. Trends Microbiol 13: 381–388.
14. Koval’chuk DV, Khoreva MV, Nikonova AS (2011) [Recognition receptors of innate immunity (NLR, RLr, and CLR)]. Zh Mikrobiol Epidemiol Immunobiol. pp 93–100.
15. Kanneganti TD, Lamkanfi M, Nunez G (2007) Intracellular NOD-like receptors in host defense and disease. Immunity 27: 549–559.
16. Joosten LA, Heinhuis B, Abdollahi-Roodsaz S, Ferwerda G, Lebourhis L, et al. (2008) Differential function of the NACHT-LRR (NLR) members Nod1 and Nod2 in arthritis. Proc Natl Acad Sci U S A 105: 9017–9022.
17. Strober W, Murray PJ, Kitani A, Watanabe T (2006) Signalling pathways and molecular interactions of NOD1 and NOD2. Nat Rev Immunol 6: 9–20. 18. Ferreiros-Vidal I, Garcia-Meijide J, Carreira P, Barros F, Carracedo A, et al.
(2003) The three most common CARD15 mutations associated with Crohn’s disease and the chromosome 16 susceptibility locus for systemic lupus erythematosus. Rheumatology (Oxford) 42: 570–574.
19. Hitotsumatsu O, Ahmad RC, Tavares R, Wang M, Philpott D, et al. (2008) The ubiquitin-editing enzyme A20 restricts nucleotide-binding oligomerization domain containing 2-triggered signals. Immunity 28: 381–390.
20. Graham RR, Cotsapas C, Davies L, Hackett R, Lessard CJ, et al. (2008) Genetic variants near TNFAIP3 on 6q23 are associated with systemic lupus erythematosus. Nat Genet 40: 1059–1061.
21. Musone SL, Taylor KE, Lu TT, Nititham J, Ferreira RC, et al. (2008) Multiple polymorphisms in the TNFAIP3 region are independently associated with systemic lupus erythematosus. Nat Genet 40: 1062–1064.
22. Han JW, Zheng HF, Cui Y, Sun LD, Ye DQ, et al. (2009) Genome-wide association study in a Chinese Han population identifies nine new susceptibility loci for systemic lupus erythematosus. Nat Genet 41: 1234–1237.
23. Adrianto I, Wen F, Templeton A, Wiley G, King JB, et al. (2011) Association of a functional variant downstream of TNFAIP3 with systemic lupus erythema-tosus. Nat Genet 43: 253–258.
24. Hochberg MC (1997) Updating the American College of Rheumatology revised criteria for the classification of systemic lupus erythematosus. Arthritis Rheum 40: 1725.
25. Bombardier C, Gladman DD, Urowitz MB, Caron D, Chang CH (1992) Derivation of the SLEDAI. A disease activity index for lupus patients. The Committee on Prognosis Studies in SLE. Arthritis Rheum 35: 630–640. 26. Gladman DD, Urowitz MB, Goldsmith CH, Fortin P, Ginzler E, et al. (1997)
The reliability of the Systemic Lupus International Collaborating Clinics/ American College of Rheumatology Damage Index in patients with systemic lupus erythematosus. Arthritis Rheum 40: 809–813.
27. Schiffenbauer J, Simon LS (2004) Randomized controlled trials in systemic lupus erythematosus: what has been done and what do we need to do? Lupus 13: 398–405.
28. Petri M, Genovese M, Engle E, Hochberg M (1991) Definition, incidence, and clinical description of flare in systemic lupus erythematosus. A prospective cohort study. Arthritis Rheum 34: 937–944.
29. Lun SW, Wong CK, Ko FW, Hui DS, Lam CW (2009) Expression and functional analysis of toll-like receptors of peripheral blood cells in asthmatic patients: implication for immunopathological mechanism in asthma. J Clin Immunol 29: 330–342.
30. Zandman-Goddard G, Shoenfeld Y (2003) SLE and infections. Clin Rev Allergy Immunol 25: 29–40.
31. Tam LS, Chan AY, Chan PK, Chang AR, Li EK (2004) Increased prevalence of squamous intraepithelial lesions in systemic lupus erythematosus: association with human papillomavirus infection. Arthritis Rheum 50: 3619–3625. 32. Zandman-Goddard G, Shoenfeld Y (2005) Infections and SLE. Autoimmunity
38: 473–485.
33. Means TK, Wang S, Lien E, Yoshimura A, Golenbock DT, et al. (1999) Human toll-like receptors mediate cellular activation by Mycobacterium tuberculosis. J Immunol 163: 3920–3927.
34. Netea MG, Kullberg BJ, Galama JM, Stalenhoef AF, Dinarello CA, et al. (2002) Non-LPS components of Chlamydia pneumoniae stimulate cytokine production through Toll-like receptor 2-dependent pathways. Eur J Immunol 32: 1188–1195.
35. Travassos LH, Carneiro LA, Girardin SE, Boneca IG, Lemos R, et al. (2005) Nod1 participates in the innate immune response to Pseudomonas aeruginosa. J Biol Chem 280: 36714–36718.
37. Shin JN, Eissa NT (2010) Autophagy gets the ‘NOD’ to enhance bacterial handling and antigen presentation. Immunol Cell Biol 88: 343–345. 38. Petterson T, Jendholm J, Mansson A, Bjartell A, Riesbeck K, et al. (2011) Effects
of NOD-like receptors in human B lymphocytes and crosstalk between NOD1/ NOD2 and Toll-like receptors. J Leukoc Biol 89: 177–187.
39. Lecat A, Piette J, Legrand-Poels S (2010) The protein Nod2: an innate receptor more complex than previously assumed. Biochem Pharmacol 80: 2021–2031. 40. van Beelen AJ, Zelinkova Z, Taanman-Kueter EW, Muller FJ, Hommes DW,
et al. (2007) Stimulation of the intracellular bacterial sensor NOD2 programs dendritic cells to promote interleukin-17 production in human memory T cells. Immunity 27: 660–669.
41. Dean GS, Tyrrell-Price J, Crawley E, Isenberg DA (2000) Cytokines and systemic lupus erythematosus. Ann Rheum Dis 59: 243–251.
42. Doria A, Ghirardello A, Iaccarino L, Zampieri S, Punzi L, et al. (2004) Pregnancy, cytokines, and disease activity in systemic lupus erythematosus. Arthritis Rheum 51: 989–995.
43. Brennan FM, Feldmann M (1996) Cytokines in autoimmunity. Curr Opin Immunol 8: 872–877.
44. Nicholson LB, Kuchroo VK (1996) Manipulation of the Th1/Th2 balance in autoimmune disease. Curr Opin Immunol 8: 837–842.
45. Sabry A, Sheashaa H, El-Husseini A, Mahmoud K, Eldahshan KF, et al. (2006) Proinflammatory cytokines (TNF-alpha and IL-6) in Egyptian patients with SLE: its correlation with disease activity. Cytokine 35: 148–153.
46. Beebe AM, Cua DJ, de Waal Malefyt R (2002) The role of interleukin-10 in autoimmune disease: systemic lupus erythematosus (SLE) and multiple sclerosis (MS). Cytokine Growth Factor Rev 13: 403–412.
47. Al-Mutairi S, Al-Awadhi A, Raghupathy R, Al-Khawari H, Sada P, et al. (2007) Lupus patients with pulmonary involvement have a pro-inflammatory cytokines profile. Rheumatol Int 27: 621–630.
48. Rosenzweig HL, Martin TM, Planck SR, Galster K, Jann MM, et al. (2008) Activation of NOD2 in vivo induces IL-1beta production in the eye via caspase-1 but results in ocular inflammation independently of IL-caspase-1 signaling. J Leukoc Biol 84: 529–536.
49. Hedl M, Abraham C (2011) Distinct roles for Nod2 and autocrine IL-1{beta} in MDP-induced MAPK activation and cytokine secretion in human macrophages. J Biol Chem.
50. Voronov E, Dayan M, Zinger H, Gayvoronsky L, Lin JP, et al. (2006) IL-1 beta-deficient mice are resistant to induction of experimental SLE. Eur Cytokine Netw 17: 109–116.
51. Segal R, Bermas BL, Dayan M, Kalush F, Shearer GM, et al. (1997) Kinetics of cytokine production in experimental systemic lupus erythematosus: involvement of T helper cell 1/T helper cell 2-type cytokines in disease. J Immunol 158: 3009–3016.
52. Handwerger BS, Rus V, da Silva L, Via CS (1994) The role of cytokines in the immunopathogenesis of lupus. Springer Semin Immunopathol 16: 153–180. 53. Macfarlane DE, Manzel L (1998) Antagonism of immunostimulatory
CpG-oligodeoxynucleotides by quinacrine, chloroquine, and structurally related compounds. J Immunol 160: 1122–1131.
54. Sun S, Rao NL, Venable J, Thurmond R, Karlsson L (2007) TLR7/9 antagonists as therapeutics for immune-mediated inflammatory disorders. Inflamm Allergy Drug Targets 6: 223–235.
55. Van Beek MJ, Piette WW (2001) Antimalarials. Dermatol Clin 19: 147–160, ix.
56. Khan N, Summers CW, Helbert MR, Arkwright PD (2010) Effects of age, gender, and immunosuppressive agents on in vivo toll-like receptor pathway responses. Hum Immunol 71: 372–376.
57. Netea MG, Ferwerda G, de Jong DJ, Jansen T, Jacobs L, et al. (2005) Nucleotide-binding oligomerization domain-2 modulates specific TLR pathways for the induction of cytokine release. J Immunol 174: 6518–6523.
58. van Heel DA, Ghosh S, Butler M, Hunt KA, Lundberg AM, et al. (2005) Muramyl dipeptide and toll-like receptor sensitivity in NOD2-associated Crohn’s disease. Lancet 365: 1794–1796.
59. Fiorentino DF, Bond MW, Mosmann TR (1989) Two types of mouse T helper cell. IV. Th2 clones secrete a factor that inhibits cytokine production by Th1 clones. J Exp Med 170: 2081–2095.
60. de Waal Malefyt R, Haanen J, Spits H, Roncarolo MG, te Velde A, et al. (1991) Interleukin 10 (IL-10) and viral IL-10 strongly reduce antigen-specific human T cell proliferation by diminishing the antigen-presenting capacity of monocytes via downregulation of class II major histocompatibility complex expression. J Exp Med 174: 915–924.
61. Ding L, Linsley PS, Huang LY, Germain RN, Shevach EM (1993) IL-10 inhibits macrophage costimulatory activity by selectively inhibiting the up-regulation of B7 expression. J Immunol 151: 1224–1234.
62. Rousset F, Garcia E, Defrance T, Peronne C, Vezzio N, et al. (1992) Interleukin 10 is a potent growth and differentiation factor for activated human B lymphocytes. Proc Natl Acad Sci U S A 89: 1890–1893.
63. Houssiau FA, Lefebvre C, Vanden Berghe M, Lambert M, Devogelaer JP, et al. (1995) Serum interleukin 10 titers in systemic lupus erythematosus reflect disease activity. Lupus 4: 393–395.
64. Lacki JK, Samborski W, Mackiewicz SH (1997) Interleukin-10 and interleukin-6 in lupus erythematosus and rheumatoid arthritis, correlations with acute phase proteins. Clin Rheumatol 16: 275–278.
65. Noguchi E, Homma Y, Kang X, Netea MG, Ma X (2009) A Crohn’s disease-associated NOD2 mutation suppresses transcription of human IL10 by inhibiting activity of the nuclear ribonucleoprotein hnRNP-A1. Nat Immunol 10: 471–479.
66. Kobayashi KS, Chamaillard M, Ogura Y, Henegariu O, Inohara N, et al. (2005) Nod2-dependent regulation of innate and adaptive immunity in the intestinal tract. Science 307: 731–734.
67. Divangahi M, Mostowy S, Coulombe F, Kozak R, Guillot L, et al. (2008) NOD2-deficient mice have impaired resistance to Mycobacterium tuberculosis infection through defective innate and adaptive immunity. J Immunol 181: 7157–7165.
68. Tam LS, Li EK, Wong SM, Szeto CC (2002) Risk factors and clinical features for tuberculosis among patients with systemic lupus erythematosus in Hong Kong. Scand J Rheumatol 31: 296–300.
69. Ribeiro FM, Szyper-Kravitz M, Klumb EM, Lannes G, Ribeiro FR, et al. (2010) Can lupus flares be associated with tuberculosis infection? Clin Rev Allergy Immunol 38: 163–168.
70. Hasan UA, Bates E, Takeshita F, Biliato A, Accardi R, et al. (2007) TLR9 expression and function is abolished by the cervical cancer-associated human papillomavirus type 16. J Immunol 178: 3186–3197.