-31-
Abstract — Topic classification of texts is one of the most interesting challenges in Natural Language Processing (NLP). Topic classifiers commonly use a bag-of-words approach, in which the classifier uses (and is trained with) selected terms from the input texts. In this work we present techniques based on graph similarity to classify short texts by topic. In our classifier we build graphs from the input texts, and then use properties of these graphs to classify them. We have tested the resulting algorithm by classifying Twitter messages in Spanish among a predefined set of topics, achieving more than 70% accuracy.
Keywords — Topic classification, text classification, graphs, natural language processing
I. INTRODUCTION
opic classification of texts is one of the most interesting challenges in Natural Language Processing (NLP). In the field of the happiness research it is important to combine sentiment analysis with topic classification techniques, in order to determine the reasons why a subject expresses happiness or sadness. The problem is to assign to every input text to be classified one topic chosen from a collection of predefined topics. Topic classifiers have commonly used a bag-of-words approach, in which the classifier uses (and is trained with) selected terms from the input texts. In these types of approaches the biggest issue is that the set of potential terms used is huge, and has to be reduced to have a practical classifier. Hence, the preprocessing of the texts and the selection of the most important terms to be used becomes fundamental.
In this work, we present classification techniques that are not based on the bag-of-words paradigm. Instead, they generates graphs from the texts, and use graph similarity to classify them by topic. The resulting classifier uses much fewer attributes than bag-of-words classical classifiers.
A prototype classifier was developed using the techniques proposed here, and was used to participate in the topic classification challenge of the Workshop on Sentiment
Partially funded by the SOCAM research project, Spanish Ministry of
Industry, Energy and Tourism.
Analysis at SEPLN - 2013, known as TASS 2013 (Taller de Análisis de Sentimientos en SEPLN 2013). As in previous years, the challenge organizers prepared and made available a data set for evaluation. For topic classification, a set of Twitter messages (tweets) in Spanish were provided. Some of these tweets had been previously classified among predefined categories (politics, economy, music, sports, etc.), and the rest was to be classified by the systems developed by the challenge participants. The classifier we developed ended in 3rd position (with respect to the F1 characteristic), very close to the systems that ended first and second, which used classical techniques.
Additionally, we have also tested different configurations of our classifier using the whole data set of tweets provided by the TASS organizers (including the ones used for evaluation), and found that our classifier achieves accuracies above 70%, using very few attributes. In the classifier developed and tested in this work, we have also explored pre-processing alternatives, such as simple Named-Entity Recognition, Thesauri and specific dictionaries (e.g., SMS abbreviations) to account for the special medium Twitter is. We believe that thorough work on this pre-made knowledge data bases could greatly improve the results of the classification.
The rest of the paper is structured as follows. We revise graph-based approaches for NLP in Section II. In Section III we describe the basic techniques used by our classifier, while in Section IV we describe how these techniques have been transformed into an operational system. In Section V we present the evaluation results that have been obtained and discuss their significance and implications.
II. STATE OF THE ART
The great representational power of graphs, in terms of element relationships, and the extensive mathematical work in graph theory, have been useful for text processing. Graph techniques have been successfully exploited for many tasks such as text summarization and information retrieval.
In fact, a number of scientific works use graph techniques for text summarization of big documents, such as [2] or [16]. Similarly, the TextRank method [10], which is the application
T
Graph-based Techniques for Topic
Classification of Tweets in Spanish
Héctor Cordobés¹, Antonio Fernández Anta¹, Luis F. Chiroque¹,
Fernando Pérez², Teófilo Redondo³ and Agustín Santos¹
1. IMDEA Networks Institute, Madrid, Spain
2. U-Tad, Madrid, Spain
3. Factory Holding Company 25, Madrid, Spain
4. Universidad Carlos III de Madrid, Spain
-32- of the well-known PageRank metric [3] to text graphs, has been used with remarkable success [7] to extract good representatives in text-related graphs by using a random-walk approach. The method is based on the assumption that well-connected nodes (e.g., terms or sentences), would be good representatives of a graph. These works also use an additional set of techniques in order to exploit the relation between sentences in the same document. For this matter, methods such as tf-idf [14], combined with mutual information, information gain, Helmholtz principle [4], and other weighting mechanisms, have been developed to fine-tune the importance of the terms, mainly towards a subsequent bag-of-words scheme. For example, for classification tasks, it is common to describe documents within a Vector Space Model (VSM), and classify them with Rocchio or SMO classifiers, in which each feature is a weighted term. These methods relay in calculating centroid representatives of the text to summarize. Unfortunately, they may sometimes fall in a multi-centroid problem, for which good decision borders determination can be difficult to solve.
In this work, we propose a system where very short text classification is possible by using a vector classification model for which the features are not terms, but graph metrics, thus significantly reducing the training and exploitation computational requirements, while retaining reasonable accuracy. As mentioned, this work makes use of the TASS2013 corpus, managed by SEPLN (Spanish Society for Natural Language Processing) for its TASS sentiment classification challenge. This corpus is in Spanish, which prevents us from using well-known baselines for the English language, such as Reuters-21578 [9]. Instead, we will compare ourselves with other participants in the same task.
Nevertheless, this work is a first step in the application of graph techniques to topic classification of short texts, so it must be taken as a proof of concept. More advanced techniques can be used in conjunction with this classification scheme, such as PoS tagging and dependency trees [17], or sophisticated text normalization [13].
III. BASIC GRAPH-BASED CLASSIFICATION TECHNIQUES
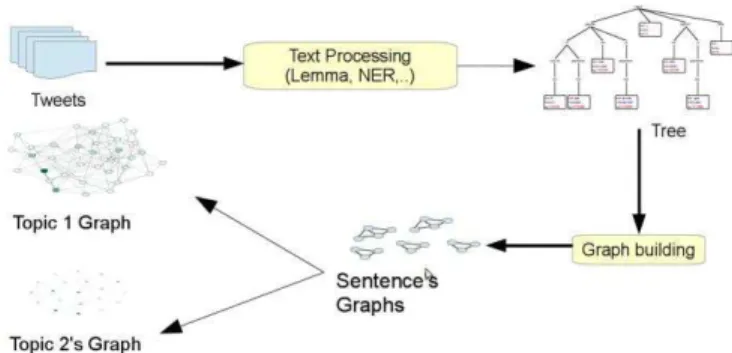
The basic principle for all our techniques is that every piece of text (tweets in this case, and in general a sentence) can be represented as a graph. Essentially, for a given text our proposal uses the words in the text as graph vertices (we usually work only with the word lemmas, and optionally with named entities), and creates weighted edges between the words. We have considered different ways of assessing weights on the edges. A simple option is that the weight represents the frequency with which both words occur together in the text. Another more sophisticated (and complex) choice is that this frequency is weighted by the distance between the words in the syntactic tree of the text. There are other alternatives for building the graph that we deem of great interest in future work (especially those based in directed graphs).
Knowing how to build a graph for each tweet, the first hypothesis for our system is that graphs belonging to the same topic have a common representative structure (topic reference graph). For the text classification, we look for the similarities between the graph generated for a given text and different topic reference graphs. Hence, our work uses a technique of graph similarity in order to detect the topic of a piece of text.
Hence, for our experiments, we have built a reference graph for each topic. This graph is the union of all the graphs generated from all the texts of the same topic. In the resulting reference graph, the weights of the same edge in different graphs are added. This decision is based on the second hypothesis of our work, that is, all words relate to each other with different intensities depending on the topic. For instance, when the topic is Politics, the words Presidencia and Congreso will show a strong relationship. These same words may not appear or have a weak relationship in other topics (e.g., Football). Therefore, the reference (union) graph created for every topic is expected to be very different. The overall process of building the reference graphs is shown in fig. 1.
Hence, using a pre-classified set of tweets for training, our system builds the reference graph for each of the different topics. When a new tweet needs to be classified, its graph is generated. Then, we search for the reference graph with the highest similarity with the tweet graph we want to classify. Fig. 2 shows this process.
The basic mechanism previously described opens up a wide spectrum of choices and approaches that can be combined in multiple ways. The first step in the mechanism is to build the graph for the tweet. As we have already mentioned, in our Fig. 1: Graph building process
-33- work we have explored several options for selecting nodes and assigning weights to the edges. Similarly, we have used several criteria to measure the similarity of a given graph to a reference graph. In the following sections we go into greater detail about the methods we have employed.
IV. IMPLEMENTING THE CLASSIFIER
In this section we describe how the classifier has been developed, and particularly how the techniques described in the previous section have been implemented. In Section 4.1 we describe the preprocessing that all the tweets go through before using them to build the associated graphs. Section 4.2 describes how the reference graphs get built. Finally, in Section 4.3 we describe how the topic of a new tweet is identified.
A. Preprocessing of the Text
As a step prior to building and analysing the graphs, we run a preprocessing phase on the texts. This is a typical step in many natural language processing techniques. In this phase, the text is corrected, analysed, and separated into simple elements. In our work we have used the Hunspell dictionaries to obtain an orthographically correct text. We have also used the dictionary of SMS abbreviations and symbols (SMS dictionary) that we already used in the system we developed for TASS 2012 [5]. In addition, we have used Freeling [12] for word lemmatization, taking always into account the automatic disambiguation of lemmas according to the syntactic function. Freeling is also used to parse the syntactic tree of the tweets, which is used for calculating the distances between words. These distances will be used in the following sections.
Another step in the preprocessing phase has been identifying the Named Entities (Named Entity Recognition or NER process). The objective in this step has been to have mechanisms available in order to unify in a single term collections of words that refer to the same concept (e.g., Real Madrid, Real Madrid C.F.). To this end, and as a proof of concept, we have used a small manually-created catalog of slightly less than 100 entity names, with several variations for each one. For the creation of the catalog, the texts in the training set have been separated into n-grams, with no limit as to their length, using the technique described in [11]. After the extraction of statistically significant n-grams, the catalog was manually extended both in similar concepts (for instance, the name of a media provider) and in the different ways these concepts may be present.
For the NER we have used a search in the catalog for every single occurrence of the n-gram in the text in order to verify if it refers to one of the entities in the catalog. If so, the n-gram gets substituted by a given canonical name. For instance, the bigram Mariano Rajoy has been considered as one such entity, in this case with canonical name mariano_rajoy_brey. The whole process has been executed as an experiment, and we believe that broadening its use and having a more complete catalog could improve significantly the quality of the results.
In summary, the preprocessing of each tweet goes through the following phases: first, all URL's are deleted from the tweet; second, using the SMS dictionary, the abbreviations and symbols present are replaced by their textual equivalent; third, orthography is corrected using the Hunspell dictionaries; fourth, the tweet language is detected using Cybozy Labs Language Detection Library [15] and, if it is not Spanish, it is discarded; fifth, NER is applied, substituting the entities found for their canonical name (this phase can be removed at will to check how effective it is in the overall result); sixth, lemmatization is performed using Freeling; seventh and last, all the stop words are removed.
B. Reference Graphs
The key process to build a reference graph per topic is the process of building a graph for each text, since the reference graph is the union of these graphs. We have tried several options to build text graphs, described below, some of them very involved. The differences are on the set of nodes included in the graph or the way weights are assigned to the edges of the graph.
The simplest option considered for building text graphs has been using as nodes of the graph the words of the text (or the named entities, if used). Then, two nodes are connected with an edge whose weight is the product of their respective number of appearances in the text. (For instance, if in a text the word concierto appears twice and the word guitarra appears three times, the nodes of these two words are connected with a link of weight 6.) The reference graph obtained with this option has as nodes all the words that appear in the tweets of the topic, and the weight of a link between two words is the number of instances of both words occurring together in the same tweet.
A second option explored assigns to the link between two words a weight that is inversely proportional to the distance between the two words in the text. The intuition is that two words occurring together in a text have larger affinity, and hence should have a stronger link, than words occurring at opposite ends in a sentence. This distance is derived from the syntactic parsed tree as produced by Freeling. To calculate the distance between two words we count the number of jumps in the parsed tree from one word to the other. Our experiments revealed that the results obtained with this option are similar to those with the previous one. Hence, this option was discarded, due to the additional complexity.
-34- improvement either.
As mentioned, none of the options explored was sensibly better that the first option, which is also the simplest one. Hence, this is the type of text graph that is considered in the rest of the paper. However, we think that the use of weights based on distance and synonyms must be addressed in future work since we expect that the augmented graph obtained can improve the reference graphs, and consequently yield a higher rate of successful classifications. In fact, other works such as [1] have already benefited from using thesaurus information.
C. Text Classification
We describe now how the classification of an input text has been done. One of the main questions in our approach is related with the problem of detecting graph similarity. Electing the measure of similarity is a complex decision since there are a great variety of measures and it is not clear which one would be the most appropriate for our problem. In our work we have used several measures, but all of them use the subgraphs of the reference graphs obtained after filtering out the words that do not occur in the text to be classified. That is, for each reference graph we have extracted the words occurring in the text, and we keep the links between them (i.e., we obtain the subgraph induced by the words of the text). Thus, for each topic we obtain a topic subgraph that can even be empty if no word in the text is found within the reference graph.
The following step is to determine one or several topology measures that, when applied to the topic subgraphs, would allow us to choose the topic(s) of the text. We have used two large types of measures: those based in node metrics and those based in relations metrics. The node metrics have mainly been just two: PageRank [3] and HITS [8]. For the computation of these metrics we have used the variants for undirected graphs with weighted links, and applied them to the topic reference graphs. As a result, each node of the reference graph is assigned a measure (its PageRank or HITS values).
Unfortunately, the size of the reference graphs is heavily influenced (biased) by the training set (i.e., number of tweets for each topic), and the centrality measure assigned to the nodes are influenced by the size of the graph. Hence, we attempt to compensate this deviation by means of a normalization of the centrality measures. Following a simple hypothesis, we assume that, given equal representation, the values for the centrality measures would decrease according to the number of graph nodes. Hence, we have normalized the number depending on the size of the reference graph of a given topic. On the other hand, since these values are also dependent on the graph topology in an unpredictable way, we have tried using non-linear operations (particularly, powers like 0.5 or 1/3), in order to give more representation capability to the system.
Then, once the topic subgraph has been extracted for a text, the topic is assigned a value that is the sum of the measures of the nodes of the subgraph (for instance, the normalized sum of PageRank for all the nodes in the subgraph). Computing this value is fast and simple from the precomputed reference
graphs. These centrality measures (PageRank and HITS) have been very useful in determining the text topic, as we show later in Section V (see Table I). We observed no big differences between using PageRank and HITS.
As a first approach the value assigned to each topic could be directly used for classification. After adding up the centrality measures for each word in a topic subgraph, the text is classified to the topic with the highest value. With this methodology we achieve nearly a 60% of correct classifications. However, using more sophisticated classifiers (provided in Weka) we achieve a higher rate of accuracy, as we show below.
In addition to the centrality measures, our work has also contemplated links measures. Since every link has a weight, we can compute metrics using those values. We have tried several techniques, but all of them are based on the density of the topic subgraphs (a weighted sum of the links weights). This technique by itself has not rendered better results, but during the evaluation with the training set the technique has proved to be fundamental when combined with the other techniques described before.
In order to combine all the measures described, we have used classifiers included in the Weka system [6]. Each tweet was represented by a vector formed by all the available metrics (PageRank's sum, HITS' sum, graph density, etc.) for every topic reference graph. All in all we have a vector with up to 70 numeric values at our disposal. Of all the classification methods available in Weka, we found that the family of Logistic produced a higher rate of correct classifications. Especially the Logistic MultiClass Classifier method, appeared to give better results in a consistent way over the training set. Hence, all the results shown below use this classifier.
V. RESULTS AND DISCUSSION
We have evaluated our system with different configurations. In all the runs we have trained Weka with the full training set of TASS 2013 (approximately 7,000 tweets) and we have assessed the resulting model with slightly less than the 60,000 tweets of the test set (leaving out some tweets we could not obtain). Weka's algorithm in use has always been SimpleLogistic, as mentioned above.
In Table I we show the results in all the runs. The column “Configuration” shows the text attributes used: PageRank (PR), HITS, graph density (GD), and the modifications applied. These attributes have been generated for every single tweet both during training and evaluation. The column NER shows whether entity recognition has been used or not. As mentioned before, we have disabled this feature in some runs to measure the variation in results. The column “Accuracy” shows in percentage how the system identifies a tweet as belonging to one given topic, according to the evaluation data supplied. Experiment 1 shows the configuration submitted to the TASS 2013 contest.
-35- classifier used in experiment 1. Note that some tweets belong to more than one category, so for the sake of clarity we have expressed both the occurrence rate, and a normalized occurrence rate. This latter is intended to express the occurrence rate as though the sum of occurrences was 100%.
We present the results by category instead of showing a confusion matrix, because the possibility of finding several categories for one tweet would make the latter large and unintuitive. In Table III the success rate must be interpreted as the proportion of the tagged predictions within the category whose tweet belongs, at least, to that category.
TABLE I
Experiment Configuration NER Accuracy (%)
1
PR0.5, PR, PR², HITS0.5, HITS, HITS, GD
Yes 71.90
2 PR
0.5, PR, PR²,
HITS0.5, HITS, HITS² Yes 71.62
3 PR
0.5, PR, PR²,
HITS0.5, HITS, HITS² No 71.38
4 PR Yes 69.78
5 PR0.5 No 69.45
6 PR0.5 Yes 71.64
7 PR1/3 Yes 71.58
8 PR0.1 Yes 69.04
9 HITS Yes 69.75
10 HITS0.5 Yes 71.32
11 HITS1/3 Yes 71.35
12 HITS0.1 Yes 68.88
TABLE II
Topic Tweets Occurrence (%) Normalized occurrence (%)
movies 596 1.0 0.9
sports 135 0.2 0.2
economy 2549 4.2 3.7
entertainment 5421 8.9 7.8
football 823 1.4 1.2
literature 93 0.2 0.2
music 1498 2.5 2.1
other 28191 46.4 40.5
politics 30067 49.5 43.2
technology 287 0.5 0.4
From the results presented we think that the centrality metric used (PageRank or HITS) does not incur significant difference. On the contrary, the use of a specific normalization may represent a significant improvement (around 2%, for instance, between Experiments 4 and 6). This, together with the good results achieved by using centrality metrics, leads us to believe that choosing an appropriate normalization is of paramount importance for the improvement of results, or in any case, using a metric capable of taking all the factors (size, topology, etc.) into account. We believe that this is an interesting area for future research.
During the execution of the experiments we have detected sensitivity to the available vocabulary. Topics with very few tweets tended to be ignored, such as the case of Technology, because the generated reference graphs are not representative enough. One possible future work could focus on evaluating the sensitivity with larger training sets, and thus determining and measuring how important this effect may be.
TABLE III
Topic Predictions Ratio vs. total Accuracy rate
movies 460 0.77 43.26
sports 67 0.11 47.76
economy 612 1.03 50.16
entertainment 6919 11.66 38.98
football 420 0.71 52.62
literature 60 0.10 25.00
music 1095 1.84 51.60
other 19753 33.29 77.00
politics 29890 50.38 78.27
technology 58 0.10 32.76
In a similar way, this sensitivity could be tested enlarging the NER collection dictionary, so that it can represent in greater detail the topics that the system handles. Maybe given the very limited size of the dictionary used (less than 100 entity names), the impact in the results is not very significant, although consistent (around 0.3%). We should also consider that the NER rate is about 18.3% (occurring rate per tweet) and, as the corpus tweets have been selected, not many different NE recognitions have occurred. Thus we may hypothesize that the impact could be greater within more heterogeneous corpora and bigger dictionaries. This topic is worth to be explored further.
-36- The automatic evaluation of the predictive models in Weka is limited because it cannot take more than one prediction per vector, whereas the tweet labelling may include more than one topic per tweet. It is quite possible that a classifier that allows more than one topic per tweet would achieve better results.
Concerning the results for individual categories (Table III), the system appears quite biased towards the main categories (politics and other), as they account for 46.4% and 49.5% respectively of the original tweets. In these cases the system achieves roughly a 78% of correct classification. However, the remaining categories show a rather poor behaviour, many below a mere 50%. Of particular note is the case of entertainment, with a success rate of only 38%, even though it is the third category in the total number of tweets.
We think that an additional experiment with more accurate training could reveal if this behaviour is due to an unbalanced training or to the actual design of the system. Since the number of training texts in some categories (for instance, literature) is rather scarce, we think that a far more complete training set than that currently available would be needed.
REFERENCES
[1] Aseervatham, Sujeevan. 2007. Apprentissage à base de Noyaux Sémantiques pour le traitement de données textuelles. Ph.D. thesis, Université Paris-Nord-Paris XIII.
[2] Blanco, Roi and Christina Lioma. 2012. Graph-based term weighting for information retrieval. Information retrieval, 15(1):54-92.
[3] Brin, Sergey and Lawrence Page. 1998. The anatomy of a large-scale hypertextual web search engine. Comput. Netw. ISDN Syst., 30(1-7):107-117, April.
[4] Dadachev, Boris, Alexander Balinsky, Helen Balinsky, and Steven Simske. 2012. On the helmholtz principle for data mining. In Emerging Security Technologies (EST), 2012 Third International Conference on, pages 99-102. IEEE.
[5] Fernández Anta, Antonio, Luis Núñez Chiroque, Philippe Morere, and Agustín Santos. 2013. Sentiment analysis and topic detection of Spanish tweets: A comparative study of of NLP techniques. Procesamiento del Lenguaje Natural, 50:45-52.
[6] Hall, Mark, Eibe Frank, Geoffrey Holmes, Bernhard Pfahringer, Peter Reutemann, and Ian H. Witten. 2009. The WEKA data mining software: an update. SIGKDD Explorations, 11(1):10-18.
[7] Hassan, Samer, Rada Mihalcea, and Carmen Banea. 2007. Random walk term weighting for improved text classification. International Journal of Semantic Computing, 1(04):421-439.
[8] Kleinberg, Jon M. 1999. Authoritative sources in a hyperlinked environment. J. ACM, 46(5):604-632, September.
[9] Lewis, David D. 1997. Reuters-21578 text categorization test collection.
[10] Mihalcea, R. and P. Tarau. 2004. TextRank: Bringing order into texts. In Proceedings of EMNLP-04and the 2004 Conference on Empirical Methods in Natural Language Processing, July.
[11] Nagao, Makoto and Shinsuke Mori. 1994. A new method of n-gram statistics for large number of n and automatic extraction of words and phrases from large text data of Japanese. In Proceedings of the 15th conference on Computational Linguistics, COLING 1994, Volume 1, pages 611-615. Association for Computational Linguistics.
[12] Padró, Lluís, Samuel Reese, Eneko Agirre, and Aitor Soroa. 2010. Semantic services in freeling 2.1: Wordnet and ukb. In Principles, Construction, and Application of Multilingual Wordnets, pages 99-105, Pushpak Bhattacharyya, Christiane Fellbaum, and Piek Vossen, editors, Mumbai, India, February. Global Wordnet Conference 2010, Narosa Publishing House.
[13] Porta, Jordi and José Luis Sancho. 2013. Word normalization in twitter using finite-state transducers. Proc. of the Tweet Normalization Workshop at SEPLN 2013. IV Congreso Espa nol de Informática.
[14] Salton, Gerard and Michael J McGill. 1983. Introduction to moderm information retrieval.
[15] Shuyo, Nakatani. 2010. Language detection library for java. http://code.google.com/p/language-detection/.
[16] Thakkar, Khushboo S, Rajiv V Dharaskar, and MB Chandak. 2010. Graph-based algorithms for text summarization. In Emerging Trends in Engineering and Technology (ICETET), 2010 3rd International Conference on, pages 516-519. IEEE.
[17] Vilares, David, Miguel A. Alonso, and Carlos Gómez-Rodríguez. 2013. Una aproximación supervisada para la minería de opiniones sobre tuits en español en base a conocimiento lingüístico. Procesamiento del Lenguaje Natural, 51:127-134.
Héctor Cordobés obtained his MSc in
Telecommunications in 2003 from Universidad Carlos III. From that year he worked for Motorola, participating in international projects such as Motorola Soft Switch IMS solution, High-Availability Computing Platform or Kreatel IPTV, as Systems Engineer and Developer. In 2013 he joined IMDEA Networks as a Research Engineer and he is currently studying a Research Master in Multimedia and Communications in Universidad Carlos III.
Antonio Fernández Anta(M’98–SM’02) is a Research
Professor at Institute IMDEA Networks. Previously he was a Full Professor at the Universidad Rey Juan Carlos (URJC) in Madrid, where he has been on the Faculty since 1998. He was before on the Faculty of the Universidad Politécnica de Madrid, where we received an award for his research productivity. He has been a postdoc at the Massachusetts Institute of Technology from 1995 to 1997. He has almost 20 years of research experience, with a steady productivity of more than 5 papers per year on average. He has published in top conferences and journals like INFOCOM, STOC, FOCS, PODC, DISC, Journal of the ACM, SIAM Journal on Computing, or IEEE Transactions on Computers. He is vice chair of the Steering Committee of DISC and has served in the TPC of numerous conferences and workshops. He is a senior member of the IEEE since 2002 and of the ACM since 2007. Antonio Fernández Anta received his M.Sc. and Ph.D. degrees in Computer Science from the University of Louisiana in 1992 and 1994, respectively. He completed his undergraduate studies (Licenciado and Diplomado en Informática) at the Universidad Politécnica de Madrid, Spain, in 1988 and 1991 respectively, having received awards at the university and national level for his academic performance.
Luis F. Chiroque obtained his B.Sc. degree in
Telematics Engineering from the Polytechnic University of Madrid. Currently, he is studying a Master's Degree in Mathematical Engineering at University Carlos III of Madrid and he is a PhD student at IMDEA Networks, where he previously worked in the SOCAM project. His main research interest areas are graph theory, social networks and big data.
Teófilo Redondo (BArts -1985, MArts - 1986;
-37-
with SEPLN (Sociedad Española para el Procesamiento del Lenguaje Natural) since almost the beginning.
Fernando Pérez García, is a R&D project technical
director at U-tad (Universidad de Tecnología y Arte Digital). He was before at IBM, as a Data Specialist, in the Business Analytics & Optimization service line, developing Business Intelligence and Data Mining projects for main spanish banks and carriers. Fernando is an entrepreneur, Android and Graphs enthusiast. Creator of Nautka Apps, Fernando has developed applications with over 100K users, providing natural language processing technologies to final users. Fernando is the inventor of the US Patent 7289025: "Method and system for securing an electronic device", on October 2007. Fernando completed his undergraduate studies (Licenciado en Informática) at the Universidad Pontificia de Salamanca in 1997.
Agustín Santos, PhD in Computer Science from