ISSN 1549-3636
© 2011 Science Publications
Corresponding Author: Mutasem Khalil Alsmadi, Center for Artificial Intelligence Technology,
Faculty of Information Science and Technology, University Kebangsaan Malaysia, Bangi, Selangor, Malaysia
Fish Classification Based on Robust Features Extraction From
Color Signature Using Back-Propagation Classifier
Mutasem Khalil Alsmadi,
Khairuddin Bin Omar, Shahrul Azman Mohd Noah
Center for Artificial Intelligence Technology, Faculty of Information Science and Technology, Universiti Kebangsaan Malaysia, Bangi, Selangor, Malaysia
Abstract: Problem statement: Image recognition was a challenging problem researchers had been research into this area for so long especially in the recent years, due to distortion, noise, segmentation errors, overlap and occlusion of objects in digital images. In our study, there are many fields concern with pattern recognition, for example, fingerprint verification, face recognition, iris discrimination, chromosome shape discrimination, optical character recognition, texture discrimination and speech recognition, the subject of pattern recognition appears. A system for recognizing isolated pattern of interest may be as an approach for dealing with such application. Scientists and engineers with interests in image processing and pattern recognition have developed various approaches to deal with digital image recognition problems such as, neural network, contour matching and statistics. Approach: In this study, our aim was to recognize an isolated pattern of interest (fish) in the image based robust features extraction. Where depend on color signatures that are extracted by RGB color space, color histogram and gray level co-occurrence matrix. Results: We presented a system prototype for dealing with such problem. The system started by acquiring an image containing pattern of fish, then the image segmentation was performed relying on color signature. Our system has been applied on 20 different fish families, each family has a different number of fish types and our sample consists of distinct 610 of fish images. These images are divided into two datasets: 400 training images and 210 testing images. An overall accuracy was obtained using back-propagation classifier was 84% on the test dataset used. Conclusion: We developed a classifier for fish images recognition. We efficiently have chosen an image segmentation method to fit our demands. Our classifier successfully design and implement a decision which performed efficiently without any problems. Eventually, the classifier was able to categorize the given fish into its cluster and categorize the clustered fish into its poison or non-poison fish and categorizes the non-poison and non-non-poison fish into its family.
Key words: Neural network, image segmentation, RGB color space, color histogram, image analysis, color signature, digital image recognition, poison and non-poison fish, Back-Propagation Classifier (BPC), Grey Level Co-occurrence Matrix (GLCM)
INTRODUCTION
Recently, a lot of works was done by depending on the computer; In order to let the processing time to be reduced and to provide more results that are accurate, for example, depending on different types of data, such as digital image and characters and digits. In order to automate systems that deal with numbers such as Fingerprint verification, face recognition, iris discrimination, chromosome shape discrimination, optical character recognition, texture discrimination and speech recognition. And an automatic fish image recognition system is proposed in this study. Digital image recognition has been extremely found and
an image consisting pattern of fish, then, the image will be processed into several phases such as pre processing and feature extraction before recognizing the pattern of fish. The Back-Propagation Classifier (BPC) used for the recognition phase.
Problem statement: The problem statement of this study extracted from the previous studies, several efforts have been devoted to the recognition of digital image but so far it is still an unresolved problem. Due to distortion, noise, segmentation errors, overlap and occlusion of objects in color images (Bai et al., 2008; Kim and Hong, 2009; Turabieh et al., 2006). Recognition and classification as a technique gained a lot of attention in the last years wherever many scientists utilize these techniques in order to enhance the scientific fields. Fish recognition and classification still active area in the agriculture domain and considered as a potential research in utilizing the existing technology for encouraging and pushing the agriculture researches a head. Although advancements have been made in the areas of developing real time data collection and on improving range resolutions (Patrick et al., 1992; Nery et al., 2006; Alsmadi et al., 2010), existing systems are still limited in their ability to detect or classify fish, despite the widespread development in the world of computers and software. There are many of people die every day because they do not have the ability to distinguish between poison fish and non- poison. Object classification problem lies at the core of the task of estimating the prevalence of each fish species. Solution to the automatic classification of the fish should address the following issues as appropriate:
• Arbitrary fish size and orientation; fish size and orientation are unknown a priori and can be totally arbitrary;
• Feature variability; some features may present large differences among different fish species • Environmental changes; variations in illumination
parameters, such as power and color and water characteristics, such as turbidity, temperature, not uncommon. The environment can be either outdoor or indoor
• Poor image quality; image acquisition process can be affected by noise from various sources as well as by distortions and aberrations in the optical system
• Segmentation failures; due to its inherent difficulty, segmentation may become unreliable or fail completely
And the vast majority of research-based classification of fish points out that the basic problem in
the classification of fish; they typically use small groups of features without previous thorough analysis of the individual impacts of each factor in the classification accuracy (Alsmadi et al., 2009; Lee et al., 2008; Tsai and Lee, 2002; Alsmadi et al., 2010).
(CV) map and then find its representative vector based on the concept of force equilibrium. After rotating the representative vector into the canonical orientation, every unknown object can be compared with the model objects efficiently. An image-processing algorithm developed by Zion et al. (1999) and Shutler and Nixon (2001), has been used for discrimination between images of three fish species for use on freshwater fish farms. Zernike velocity moments were developed by (Dudani et al., 2000), to describe an object using not only its shape, but also its motion throughout an image as claimed by (Mercimekm et al., 2005).Classification is the final stage of any image-processing system where each unknown pattern is assigned to a category. The degree of difficulty of the classification problem depends on the variability in feature values for objects in the same category, relative to the difference between feature values for objects in different categories. Mercimekm et al. (2005) and Gupta et al. (2007) and Lee et al. have proposed shape analysis of images of fish to deal with the fish classification problem. A new shape analysis algorithm was developed for removing edge noise and redundant data point such as short straight line. A curvature function analysis was used to locate critical landmark points. The fish contour segments of interest patterns were then extracted based on landmark points for species classification, which were done by comparing individual contour segments to the curves in the database. Regarding the feature extraction process, the authors tackled in their research the following features: fish contour extraction; fish detection and tracking; shape measurement and descriptions (i.e., shape characters (features), anal and caudal fin and size); data reduction; landmark points; landmark points statistics (i.e., curve segment of interest). In their study, they have chosen nine species of fishes that have similar shape characters and the total of features was nine features. Also, they recommended that the decision tree is considered as a suitable method to obtain high accurate results of fish images based on the common characters used, such as: caudal, anal and adipose fin. Furthermore, the authors claimed that the number of shape characters needed to be used and how to use them depending on the number of species and what kind of species are required by the system to be classified. Their experiments conducted 22 fish images that belong to 9 species, where the detection percentage of the classification process was 90%.
MATERIALSANDMETHODS
This study had focused on 610 images of fish which collected from Global Information System (GIS) on Fishes (fish-base) and department of fisheries Malaysia ministry of agricultural and Agro-based
industry in putrajaya, Malaysia region currently, the database contains 610 of fish images. Data acquired on 22th August, 2008, are used.
Image segmentation: Image segmentation is crucially significant for the successfulness recognition of the image, it is still a dream for the computer to outperform human natural ability for visual interpretation and thus feature extraction still remains a challenging task in various realms of computer vision and image analysis. The image segmentation based on color signatures described in this study.
Color is an important dimension of human visual perception that allows discrimination and recognition of visual information (Smith, 2002). Color features are relatively easy to extract and match and have been found to be effective for recognize and searching of color images in image databases. One of the main aspects of color feature extraction is the choice of a color space. A color space is a multidimensional space in which the different dimensions represent the different components of color. Most color spaces are three dimensional.
According to studies of fish classification (Nery et al., 2006) and fish biological (Keenleyside, 1979), dorsum and ventral colorations constitute very important features that might be used to discriminate different fish species.
Grey level co-occurrence matrix: The Grey Level Co-Occurrence Matrix (GLCM) (also called the Grey Tone Spatial Dependency Matrix) is a tabulation of how often different combinations of pixel brightness values (gray levels) occur in an image. The GLCM described here is used for a series of “second order” texture calculations. First order texture measures do not consider pixel neighbor relationships, while Second order measures consider the relationship between groups of two (usually neighboring) pixels in the original image. Third and higher order textures measures (considering the relationships among three or more pixels) are theoretically possible but not commonly implemented due to calculation time and interpretation difficulty. In our study we employed the second order textures measures (Benco and Hudec, 2007), but to extracted the statistical features from color histogram relying on color signature of fish images.
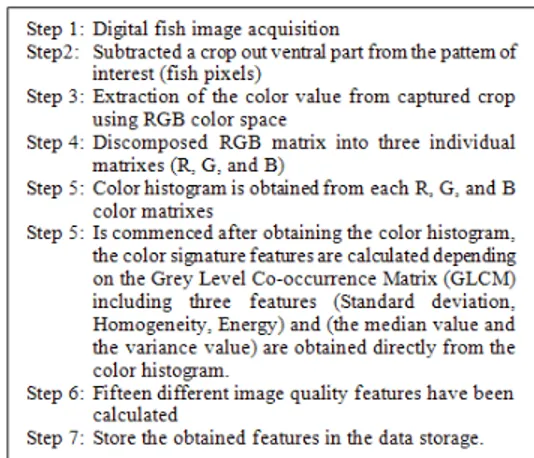
study and typically this study is dealing with digital images. The second step subtracted a crop out ventral part from the pattern of interest (fish). The third step is the extraction of the color value from captured crop using RGB color space, which is represented as vectors in the form of 3D-RGB color space. Since the color histogram technique just deals with 2D matrix. Therefore, the RGB matrix has been discomposed into three individual matrixes (R, G and B) as shown in Fig. 2.
The fourth step, the color histogram is obtained from each R, G and B color matrixes. The fifth step is commenced after obtaining the color histogram, the color signature features are calculated depending on the Grey Level Co-occurrence Matrix (GLCM) including three features. Furthermore, the median value and the variance value are obtained directly from the color histogram.
Fig. 1: The pseudo code of the extracted features from color signature color signature
Fig. 2: Extracted features model from color signature
The extracted features by GLCM’s through color histogram were standard deviation, homogeneity and energy. The final step is to store the obtained features from color signature. The pseudo code of the extracted features from color signature is shown in Fig. 1.
Eventually, fifteen color signature features have been calculated from the color histogram. Where those fifteen features are divided into 3 groups covering all three individual color histogram matrixes (R, G and B), each matrix contains 5 common features with different values. Figure 2 illustrates the complete process of features extraction based on the color signature.
Neural network model: The multilayer feed forward neural network model with Back-Propagation Classifier (BPC) for training is employed for classification task as shows in Fig. 3, which illustrates our implemented neural network contains three layers which are the input layer, the hidden layer and the output layer. The number of neurons is varied from layer to another (except The output layer consist of 20 neurons since we need to classify 20 fish families [1, 2,…, 20], each of which correspond to one of the possible family’s that might be considered) in order to determine the suitable number of neurons for both input and hidden layers, therefore, obtaining high accurate results.
The developed Back-Propagation Classifier (BPC) is trained with Termination Error (TE) 0.01 in 411 epochs the value of learning constant (Learning Rate LR) used is 0.1. In our experiment we built the neural network with number of input features, three layers and different numbers of neurons in order to achieve our goal. The following Table 1 shows the number of input features and number of neurons for each layer that determined experimentally.
Neural network models have been successfully applied in a number of research works in different domains. For example, (Haidar at al.2008) applied a
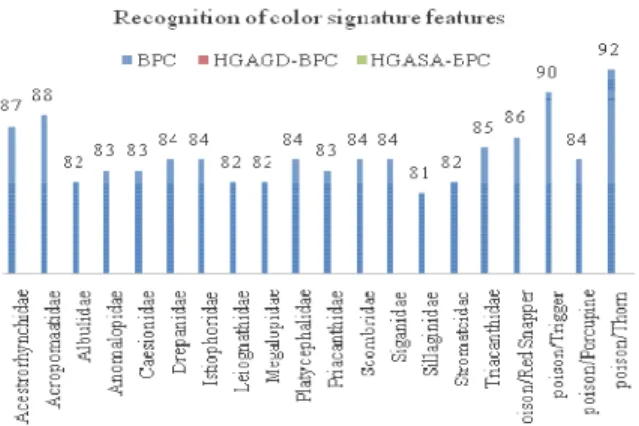
Fig. 4: Illustrates the accuracy of recognition test results for each fish family based on the color signature
Table 1: Number input features and neurons for each layer Training
classifier NO. Neurons in layers
Back-propagation Number of --- classifier input features Layer #1 Layer #2 Layer #3
15 23 30 20
neural network for Vulnerability Assessment of Power System Using Radial Basis Function Neural Network and a New Feature Extraction Method, (Effendi et al., 2010) applied a neural network for Grading Jatropha curcas Fruits Maturity
Experiment results: As we shows in Fig. 4, the accuracy of recognition test results for each fish family (20 families) based on the color signature features, which are vary from a family to another. From the Fig. 4, the obtained results by the BPC indicate a high accuracy of each fish family’s recognition percentage, which lie between 81% as minimum percentage of accuracy and 92% as a maximum percentage of accuracy.
Some of the results obtained by the BPC (for instance) are close to the minimum percentage (e.g., Sillaginidae) are due to the color features similarities (e.g., Stromateidae). For both methods, this causes a noise identification interruption to the neural network to classify properly. However, in the other hand, some families share the same color features with each other, but each one has its own species-specific traits. This enables the neural network to recognize the respected family easier, for example, some of the poison fishes have the same color features with other non-poison fishes in the ventral part, such as the Istiophoridae and Porcupine (poison), which both families classified with the same classification accuracy equals to 84% as shows in Fig. 4.
RESULTS
The methods have been implemented in MATLAB programming language on a CPU Core 2 Duo 2.33 GHZ.
Table 2: Description of the overall accuracy of training and testing
Description Results
Overall training accuracy 86%
Overall testing accuracy 84%
We have considered different fish images families, obtained from Global Information System (GIS) on Fishes (fish-base) and department of fisheries. For experimentation purpose 610 hundred fish images families are considered, 400 fish images for training and the rest 210 for testing. Table 2 describes the overall training and testing accuracy obtained based on robust features extracted from color signatures using BPC.
In addition, the problem in fish recognition is to find meaningful features based on the image segmentation using color signature of fish images. An efficient classifier that produce better fish images recognition accuracy rate is also required. As we shown in Table 2 the overall training accuracy equals to 86% and the overall testing accuracy equals to 84%.
DISCUSSION
In previous studies such as (Nery et al., 2006) performed fish recognition based on color signatures, extracted only from the ventral part of the fish. According to studies of fish biologists and classification (Keenleyside, 1979; Nery et al., 2006), the ventral colorations constitute are very important features that might be used to discriminate different fish species.
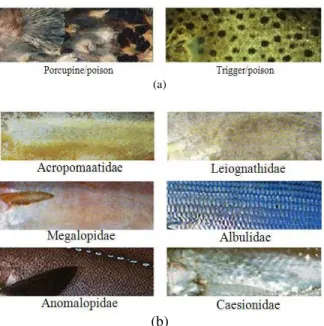
In the other hand; Colors of the ventral part fishes are the differentiation between the poison and non-poison fish families, where the non-poison fish families has many appearance different color in the ventral part as show in Fig. 5a and each color have its majority. Unlike the non-poison fish families, where they has one or two different appearance color in the ventral part of fish as show in Fig. 5b.
(a)
(b)
Fig. 5: The crop out of color signature for different fish families ((a) the poison fish and (b) the non-poison fish).
CONCLUSION
In this study, generally discussed image segmentation based on color signatures. 6 color signature features have been extracted direct from the color histogram and 9 features have been extracted using GLCM based on color histogram. In the color signature, we extracted the features based on ventral part of fish images, which play a major role in fish recognition based on color signatures, since color signatures are the differentiation between fish families, especially between the poison and non-poison fish families. This helps us to distinguish between fish families. Moreover, our study presents a novel set of features extracted from color signature. The overall accuracy for PBC was 84%.
REFERENCES
Al-Omari, S., S. Putra, S. Al-Taweel and A. Husain, 2009. Digital recognition using neural network. J. Comput. Sci., 5: 427-434. ISSN: 1549-3636 Alsmadi, M., K. Omar, S. Noah and I. Almarashdeh,
2009, Fish recognition based on the combination between robust features selection, image segmentation and geometrical parameters techniques using artificial neural network and decision tree. Int. J. Comput. Sci., Inform. Security (IJCSIS), 6: 215-221. ISSN: 1947-5500
Alsmadi, M.K., K.B. Omar, S.A. Noah and I. Almarashdeh, 2010. Fish recognition based on robust features extraction from size and shape measurements using neural network. J. Comput. Sci., 6: 1059-1065. ISSN: 1549-3636
Bai, X., X. Yang and J.L. Latecki, 2008. Detection and Recognition of Contour Parts based on Shape Similarity. Pattern Recognition, Philadelphia, USA., pp: 2189-2199.
Benco, M. and R. Hudec, 2007. Novel method for color textures features extraction based on GLCM.
Radioengineering, 16: 64-67.
http://www.radioeng.cz/fulltexts/2007/07_04_064_ 067.pdf
Chung, W. and E. Micheli-Tzanakou, 2001. Classifiers: An overview, from supervised and unsupervised pattern recognition: Feature extraction and computational intelligence. IEEE Trans. Neural Networks, 12: 371. ISBN: 0849322782
Dudani, S.A., K.J. Breeding and R.B. Mcghee, 2000. Aircraft identification by moment invariants. IEEE
Trans. Comput., 26: 39-46.
http://www.citeulike.org/user/mzabidi/article/5980 456
Effendi, Z., R. Ramli and J.A. Ghani, 2010. a back propagation neural networks for grading jatropha curcas fruits maturity. Am. J. Applied Sci., 7: 390-394. DOI: 10.3844/.2010.390.394
Gupta, S., Markey, M.K. and Bovik, A.C., 2007. Advances and Challenges in 3D and 2D+3D Human Face Recognition. In: Pattern Recognition Research Horizons, Columbus, F. (Ed.). Hauppauge, Nova Science Publishers, New York, DOI: 10.1.1.96.5003
Haidar, A.M.A., A. Mohamed and A. Hussain, 2008. vulnerability assessment of power system using radial basis function neural network and a new feature extraction method. Am. J. Applied Sci., 5: 705-713. DOI: 10.3844/.2008.705.713
Keenleyside, M.H.A., 1979. Diversity and Adaptation in Fish Behavior. Berlin Springer-Verlag, pp: 208. Kim, J.S. and K.S. Hong, 2009. Color-texture
segmentation using unsupervised graph cuts, Republic of Korea. Pattern Recog., 42: 735-750. Lee, D.J., R. Schoenberger, D. Shiozawa, X. Xu and
Mercimekm, M., K. Gulez and T.V. Mummcu, 2005. Real object recognition using moment invariants, Sadhana, Ind., 30: 765-775.
Nery, M.S., A.M. Machado, M.F.M. Campos, F.L.C.P. Dua and R. Carceroni et al., 2006. Determining the appropriate feature set for fish classification tasks. Proceedings of the XVIII Brazilian Symposium on Computer Graphics and Image Processing (SIBGRAPI’05), pp: 1530-1834.
Patrick, P.H., N. Ramani, W.G. Hanson and H. Anderson, 1992. The potential of a neural network based sonar system in classifying fish.Proceeding of the IEEE Conference on Neural Networks for Ocean
Engineering, pp: 207-213. DOI:
10.1109/ICNN.1991.163352
Petrou, M. and A. Kadyrov, 2001. Affine invariant features from the trace transform. IEEE Trans. Pattern Anal. Mach. Intell., 26: 30-44. ISSN: 0162-8828
Shutler, J.D. and M.S. Nixon, 2001. Zernike velocity moments for description and recognition of moving shapes. Proceedings of BMVC, pp: 705-714.
Smith, J.R., 2002. Color for Image Retrieval. John Wiley and Sons, Inc.
Sze, C.J., T. Hsiao-Rong and L. Hong-Yuan, 1999. Shape-based retrieval on a fish database of Taiwan. Tamkang J. Sci. Eng., 2: 163-173.
Tsai, C. and H. Lee, 2002. Binarization of color document images via luminance and saturation color features. IEEE Trans. Image Process., 11: 434-451.
Turabieh, H., M. Muhanna, A. Omar, 2006. Steganalysis of LSB encoding in digital images using GLCM and Neural Networks. http://www.uop.edu.jo/csit2006/vol1%20pdf/pg246 .pdf
Wang, X., X. Ding and C. Liu, 2005. Gabor filters-based feature extraction for character recognition. Patt. Recog., 38: 369-379. DOI: 10.1016/J.PATCOG.2004.08.004