Color Image Segmentation using Kohonen
Self-Organizing Map (SOM)
I Komang Ariana #1, Rukmi Sari Hartati *2, I Ketut Gede Darma Putra #3, Ni Kadek Ayu Wirdiani #4
#
Jimbaran, Bali, Indonesia
Information Technology Department, Faculty of Engineering, Udayana University
1
Jimbaran, Bali, Indonesia
Electrical Engineering Department, Faculty of Engineering, Udayana University
2
Abstract— Color image segmentation using Kohonen Self-Organizing Map (SOM), is proposed in this study. RGB color space is used as input in the process of clustering by SOM. Measurement of the distance between weight vector and input vector in learning and recognition stages in SOM method, uses Normalized Euclidean Distance. Then, the validity of clustering result is tested by Davies-Bouldin Index (DBI) and Validity Measure (VM) to determine the most optimal number of cluster. The clustering result, according to the most optimal number of cluster, then is processed with spatial operations. Spatial operations are used to eliminate noise and small regions which are formed from the clustering result. This system allows segmentation process become automatic and unsupervised. The segmentation results are close to human perception.
Keyword- Image Segmentation, Clustering, Self-Organizing Map, Normalized Euclidean Distance, Davies-Bouldin Index, Validity Measure
I. INTRODUCTION
Image segmentation has been widely used in image processing. Segmentation aims to get the meaningful parts in an image. Previously, image segmentation is more done in binary images and grayscale. But now, color image segmentation has an important role in many applications, such as object recognition, image classification, and etc. The aim of color image segmentation is to identify homogeneous regions in color images that are important.
Many image segmentation techniques have been developed, such as pixel-based techniques, region-based techniques, and boundary-based technique. Clustering is one of the techniques in pixel-based image segmentation. Each pixel is classified in a particular class based on certain similarity criteria. Many clustering methods have been used in image segmentation applications. One of the most commonly used is K-means clustering method [1]-[4].
One of clustering method based on artificial neural network which is the most commonly used is Self- Organizing Map (SOM). SOM studies each inputs component and then classifies the input into the corresponding class. SOM has been applied in image processing, e.g. for image compression [5], and color quantization [6]. SOM is also widely used in image segmentation applications [7]-[9]. In color image, SOM is used to perform color reduction, then followed by Simulated Annealing (SA) to obtain the results of segmentation [7]. SOM is also used for the sonar image segmentation by taking action to the existing noise [8]. Euclidean distance is commonly used to measure the distance between input vector and weight vector in SOM method [7],[8]. Mahalonobis distance has also been utilized in the measurement of the distance to the SOM method [9]. In this study, determination of the winner weight for each input, is done by calculating the distance using Normalized Euclidean Distance.
Determination of the optimal number of cluster in clustering process is also a challenge. There are many indexes to determine the cluster validity such as Dunn Index, Silhouette Index, and others. Validity Measure has been widely applied as cluster validity measurement in image segmentation application [1],[10]. In this study, the cluster validity measurement will be done in 2 ways, by Validity Measure (VM) and Davies-Bouldin Index (DBI). The validity measurement is done by forming 2 clusters to 10 clusters, then calculate the validity of each cluster. Cluster with the minimum values of DBI or VM indicates the cluster is well separated [10], it means that number of cluster is the most optimal cluster.
Image segmentation in [4] takes advantage of post-processing to improves the segmentation results obtained from the clustering process. Noise and small spatial area are removed by utilizing neighbourhood function.
uses Validity Measure (VM) and Davies-Bouldin Index (DBI). The results from these two techniques will be compared, and get the best way in determining the optimal number of the cluster. That process is very important, because it is a crucial step to get the final segmentation results. In last stage, post-processing in [4] is applied to improve the segmentation result.
II. RESEARCH METHOD
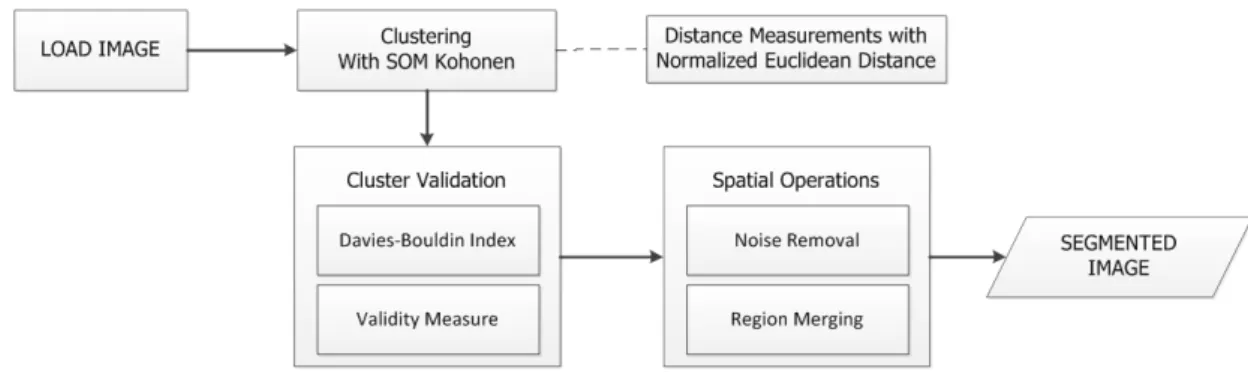
Fig. 1 shows an overview of the proposed system. Section 2 will explain each part of the image segmentation system in this study.
Fig. 1. Overview of the proposed system
A. Clustering with SOM
Clustering process in this study uses RGB color values of each pixel as an input to SOM method. Neighbourhood topology which is used in SOM method in this study, is linear array or also known as one-dimensional (1-D) topology. Computation of SOM algorithm is divided into two stages, the stage of learning, and recognition stage. SOM method in this study is adopted from the research in [8]. In this study, to determine the distance does not use Euclidean Distance, but it uses Normalized Euclidean Distance.
B. Normalized Euclidean Distance
The calculation of the Normalized Euclidean Distance is a modified form of the Euclidean Distance. Normalized Euclidean Distance of two vectors, between vector u and vector v is shown by Equation (1) [11].
where,
,
||v|| is the normalized value of vector v. Its value is expressed in Equation (3).
C. Validity Measure (VM)
VM is one of the indexes to test the validity of clustering results. VM is commonly used in application of image segmentation based on clustering [1,10]. VM is calculated using Equation (4).
where intra is intra-cluster distance, inter is inter-cluster distance, and y is a function of the number of cluster that is formed. Equation (5) is used to find the value of intra-cluster distance.
where N is total number of pixels in image, k is number of clusters, and zi is center of cluster Ci.
(1)
(2)
(3)
(4)
In addition to calculate VM, takes the minimum value of inter-cluster distance [10]. Equation (6) is used to find the inter-cluster distance.
(
z
iz
j)
inter
=
min
−
where i = 1,2 … k, and j = i+1, …, k.
y is multiplied by the quotient between distance of intra-cluster and inter-cluster. Equation (7) is used to calculate y.
1
)
1
,
2
(
.
+
=
c
N
y
where c is a constant value in range of 15 to 25, N (2,1) is a Gaussian function for the number of clusters (k). The Gaussian function is shown in Equation (8).
(
)
( ) − −=
2 2 2 22
1
,
σ µπσ
σ
µ
ke
N
VM should be minimum to obtain optimal result and achieve well-separated cluster [1]. D. Davies-Bouldin Index (DBI)
DBI was introduced in 1979 by David L. Davies and Donald W. DBI is used to evaluate the clustering results. DBI is a function to measure the ratio of the total within-cluster scatter (spread of the cluster) and the between-cluster separation (distance between between-clusters) [12]. Equation (9) is used to calculate the spread of between-cluster value.
∑
∈−
=
i C x i ii
x
z
T
S
1
where Ti is number of member in ith cluster (Ci), and ziis the ith
Distance between clusters is calculated by Euclidean distance between the center of i cluster center.
th
cluster and center of jth
j i ij
z
z
d
=
−
cluster. Equation (10) is used to calculate its distance.
Rijis ratio value between ith cluster and jth
+
=
ij j i ijd
S
S
R
cluster, which is calculated by Equation (11).
Find the maximum value of the ratio (Di), it is used to find the value of DBI. Equation (12) is used to
calculate value of Di
ij i j j
i
R
D
=
max
: ≠.
Then, DBI value is calculated by using Equation (13).
∑
==
K i iD
K
DBI
11
where K is number of cluster.
DBI with the most minimum value indicates the most optimal clustering results and achieve well-separated cluster.
E. Spatial Operations
Spatial operations are performed after the results of clustering is obtained. There are two spatial operations are applied, noise removal and region merging.
Noise and details that do not need in the results of clustering, are eliminated with a statistical filter [4]. Noise removal process is done by creating a histogram for the pixel at position (x,y) on the image which has been labelled with its cluster information. Equation (14) is used to make the histogram.
(
)
( ) ( )
1
,
|
) ' , ' ( , ' , '∑
= ∈=
z y x l y x W y x ly
x
z
H
where W(x,y) is a filter with specific radius, which the center is a pixel in position (x,y).
The new label of pixel at position (x,y) which is symbolized by ĺ(x,y), is determined by using Equation (15), as defined :
)
,
|
(
max
arg
)
,
(
'
x
y
H
z
x
y
l
=
zThe second spatial operation is region merging. Threshold value for number of pixels in a region (ThA) is determined in the amount of 0.003 times of total pixels in image. So, if the number of pixels in the region is less than ThA, it will be combined with its neighboring regions. The selected neighboring region, is selected from the maximum number of area which is neighbor with region that will be merged.
Region on this operation is based on the concept of 8-connected neighborhood. This means, the neighbors of a pixel in terms of vertical, horizontal, and diagonal.
III.RESULTS AND ANALYSIS
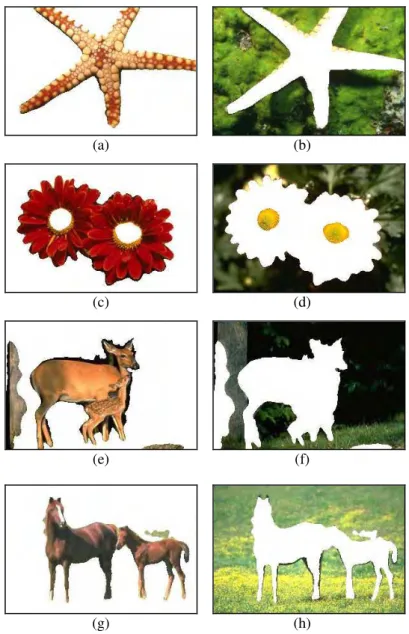
Analysis in this study uses images from the Berkeley Segmentation Dataset (BSDS) [13]. There are 4 test images, which are shown in Fig. 2.
(a) (b) (c) (d)
Fig. 2. Original test images : (a) Img01.jpg, (b) Img02.jpg, (c) Img03.jpg, (d) Img04.jpg
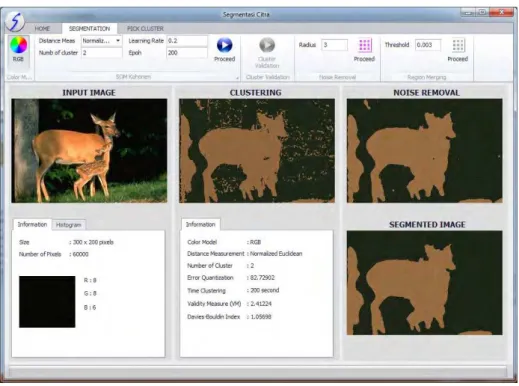
The program is made with VB .NET programming language, using Visual Studio 2012 Development Tools. The user interface of this system is shown in Fig. 3.
Fig. 3. User interface of the proposed system
Initialization of parameters on SOM and spatial operations that are used in analysis in this study, are shown in Table I.
TABLEI
Initialization of Parameters on SOM Method and Spatial Operations
No Parameter Value
1 α 0.2
2 Epoch (T) 200
3 Radius of noise filter 3
4 Threshold Region (ThA) 0.003 * total pixels
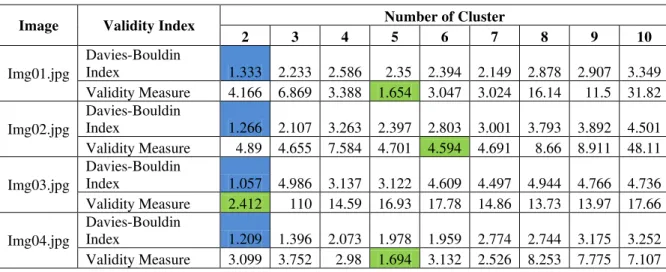
Tests are performed on each image by forming 2 until 10 clusters. From each cluster which is formed, then calculate the value of Validity Measure (VM) and Davies-Bouldin Index (DBI). Each value of VM and DBI with minimum value showed the most optimal number of cluster. Results of validity measurement for each test images, are shown in Table II.
TABLEII
Validity Measurement Results
Image Validity Index Number of Cluster
2 3 4 5 6 7 8 9 10
Img01.jpg
Davies-Bouldin
Index 1.333 2.233 2.586 2.35 2.394 2.149 2.878 2.907 3.349 Validity Measure 4.166 6.869 3.388 1.654 3.047 3.024 16.14 11.5 31.82
Img02.jpg
Davies-Bouldin
Index 1.266 2.107 3.263 2.397 2.803 3.001 3.793 3.892 4.501 Validity Measure 4.89 4.655 7.584 4.701 4.594 4.691 8.66 8.911 48.11
Img03.jpg
Davies-Bouldin
Index 1.057 4.986 3.137 3.122 4.609 4.497 4.944 4.766 4.736 Validity Measure 2.412 110 14.59 16.93 17.78 14.86 13.73 13.97 17.66
Img04.jpg
Davies-Bouldin
Index 1.209 1.396 2.073 1.978 1.959 2.774 2.744 3.175 3.252 Validity Measure 3.099 3.752 2.98 1.694 3.132 2.526 8.253 7.775 7.107
The cells with blue color in Table II show the most optimal number of cluster for all test images by Davies-Bouldin Index, and the green areas are the most optimal number of cluster by Validity Measure. From the results, the optimal clusters of all test images are shown in Table III.
TABLEIII
Optimal Cluster for All Test Images
No Image
Optimal Number of Cluster Davies-Bouldin
Index Validity Measure
1 Img01.jpg 2 5
2 Img02.jpg 2 6
3 Img03.jpg 2 2
4 Img04.jpg 2 5
The validity measurement using Davies-Bouldin Index, by average produces 2 clusters as optimal cluster. While the optimal cluster results with Validity Measure are more varied and larger than the results obtained by DBI.
Segmentation results with the optimal number of cluster obtained by DBI for each test images are shown in the Fig. 4.
(a) (b) (c)
(g) (h) (i)
(j) (k) (l)
Fig. 4. Clustering Results : (a) Img01.jpg, (d) Img02.jpg, (g) Img03.jpg, (j) Image04.jpg. Noise Removal Results : (b) Img01.jpg, (e) Img02.jpg, (h) Img03.jpg, (k) Image04.jpg. Region Merging Results : (c) Img01.jpg, (f) Img02.jpg, (i) Img03.jpg, (l) Image04.jpg
System can show the results separately, depend on its cluster. Fig. 5 show each clusters from the segmentation results obtained by DBI.
(a) (b)
(c) (d)
(e) (f)
(g) (h)
The result of image segmentation on Img01.jpg has successfully separates star fish object of other objects. For Img02.jpg, flower crown has been secured properly. Result of image segmentation for Img03.jpg with DBI, form 2 clusters as the optimal cluster, first cluster is the deer with little region from the background, and the other one is background area, like grass, leaves, and so on. The segmentation result for Img04.jpg also can successfully separates the horses of the grass.
IV.CONCLUSION
Color image segmentation with Kohonen SOM method has been created successfully. Distance measurement method with Normalized Euclidean Distance can performs color clustering well, and generates image segmentation results, which are close to human perception. With this proposed method, image segmentation process can be done automatically and unsupervised , by using cluster validity measurement.
Validity measurement of 2 indexes, Validity Measure (VM) and Davies-Bouldin Index (DBI) relatively yields distinct of optimal number of clusters. For each test images, the optimal number of clusters which are produced by DBI, on average are less than the results which are obtained by VM.
Spatial operations, which are implemented, relatively can improve the segmentation results. Noise removal step, success to eliminate the noise which is formed from the clustering results. Region merging step can eliminates unnecessary small region accurately.
REFERENCES
[1] H. Palus, M. Bogdanski, “Clustering techniques in colour image segmentation,” in Proceedings of the 4th Symposium on Methods of
Artificial Intelligence, 2003, pp. 223-226.
[2] A. Chitade, Katiyar, “Colour Based Image Segmentation using K-Means Clustering,” International Journal of Engineering Science and
Technology, vol. 2(10), pp. 5319-5325, 2010.
[3] C. Chandok, “Color Image Segmentation using K-Means Clustering,” International Journal of VLSI & Digital Signal Processing
Application, vol. 2(3), pp. 241-245, 2012.
[4] T. W. Chen, Y. L. Chen, S. Y. Chien, “Fast Image Segmentation Based on K-Means Clustering with Histograms in HSV Color
Space,” in Multimedia Signal Processing IEEE 10th Workshop, 2008, pp. 322-325.
[5] C. Amerijckx, J. D. Legat, M. Verleysen, “Image compression using self-organizing maps,” Systems Analysis Modelling Simulation,
vol. 43(11), pp. 1529-1543, 2003.
[6] J. S. Kirk, D. J. Chang, J. M. Zurada, “A Self-Organizing Map with Dynamic Architecture for Efficient Color Quantization,” in
Proceedings. IJCNN'01. International Joint Conference on, IEEE, 2001, pp. 2128-2132.
[7] G. Dong, M. Xie, “Color Clustering and Learning for Image Segmentation Based on Neural Networks,” IEEE Transactions on Neural
Networks, vol. 16(4), pp. 925-936, 2005.
[8] K. C. Yao, M. Mignotte, C. Collet, P. Galerne, G. Burel, “Unsupervised segmentation using a self-organizing map and a noise model
estimation in sonar imagery,” Pattern Recognition, vol. 33(9), pp.1575-1584, 2000.
[9] S. Paul, M. Gupta, “Image Segmentation By Self Organizing Map With Mahalanobis Distance,” International Journal of Emerging
Technology and Advanced Engineering, vol. 3(2), pp. 288-291, 2013.
[10] S. Ray, R. H. Turi, “Determination of number of clusters in k-means clustering and application in colour image segmentation,” in
Proceedings of the 4th international conference on advances in pattern recognition and digital techniques, 1999, pp. 137-143.
[11] P. Darma, Pengolahan Citra Digital, Yogyakarta, Indonesia : Andi Offset, 2010.
[12] U. Maulik, S. Bandyopadhyay, “Performance Evaluation of Some Clustering Algorithms and Validity Indices,” IEEE Transactions on
Pattern Analysis and Machine Intelligence, vol. 24(12), pp. 1650-1654, 2002.
[13] P. Arbelaez, C. Fowlkes, “Contour Detection and Hierarchical Image Segmentation,” IEEE Transactions on Pattern Analysis and