ANALYSIS OF METAL SURFACE
USING CAMERA CAPTURED LIVE
IMAGES
P.S.S.Akilashri*Head, Department of computerScience, National college, Triuchirappalli, TamilNadu, India.
akilas27@gmail.com.
Dr.E.Kirubakaran
Deputy General Manager, BHEL. Tiruchirappall, TamilNadu, India.
ekiru@bheltry.co.in. http://www.bhel.com.
Abstract:
Analyzing the metal surface plays a vital role in indentifying the cracks and other surface defects. Many metal objects, including heavy armor metals and boilers are very massive and immovable. Identifying defects on the surface of these metal bodies is a tedious and cost consuming process. The proposed metal surface analysis method takes advantages of live images captured using still cameras over the metal surface, identifies the defects easily. This method is based on the frequency domain enabled by wavelet transform followed by statistical testing of the frequency values of the metal surface image.
Keywords: metal; crack; texture.
ANALYSIS OF METAL SURFACE USING CAMERA CAPTURED LIVE IMAGES
1. Introduction
A.A.Kassim, et al. showed the statistical & structural approaches for analyzing machined surfaces. They investigated the correlation between tool - wear and quantities characterizing texture of machine surfaces. The column projection method is used for machined surfaces with highly repetitive and regular structure used for prediction of tool conditions. The run length statistics based method is fast and reliable in differentiating tool conditions [1]. Cord et al. used classification Method on Textural information for metallic surface displaying complex random pattern [2]. Tarek Elguebaly, Nizar Bauguila presented a Bayesian approach to analyze finite generalized Gaussian Mixture models which is widely used texture segmentation in signals & image processing [3]. A.S.Tolba et.al. Have proposed a system for texture feature Extraction and fusion in order to enhance the performance of the defect detection process. A multifusion technique based on PCA is used & the results showed the accuracy of 97.96[4]. Xiaoho Li et.al showed the defect characteristics, recognition and extraction algorithm (Fish evaluation Function algorithm) on armor plate image. 8-direction pixels grey value search algorithm had been used in the classification of texture regions [5]. Julien Marot et .al, used a no destruction control system to solve the defect detection in metal work pieces. Method is based on wavelet decomposition. The various tools of contour based image segmentation are combined to segment texture. Successively high and low contrast contour, Hough transform is adapted to map the processed and reference work piece without defects [6].
Jurgay celik, Tardi Jahadi presented a Multiscale texture classification using Duel- tree complex wavelet transform (DT CWI).This method used improves the ability to make better discrimination between Textures [7]. Laercio et.al. Showed the use of an hierarchical neuro fuzzy model for image classification of macroscopic rock texture. The architecture used in this model not only classifies igneous rocks but it produce more than 73% of accuracy in the validation set of the rocks [8]. Nizar Bouguila, Djemel ziou implemented an unsupervised learning algorithm for fitting a finite mixture model based on Multinormal Dirichlet distribution (MDD). The new texture model was applied to the problem of texture image data base summarization for efficient retrieval [9]. Mattee Masotti, Renato Companini used invariant texture classification method to leaner / non-leaner monotonic gray – scale transformation and 90o rotations is achieved by means of SVM classifier [10]. A.Drimbarean, P.F.Whelan examined the contribution of color to texture features by means of a comparative study. Local Linear transforms, Gaber filtering and co-occurrence approaches are the three approaches used in this method. The result was the use of color improves the performance of standard grey level texture analysis techniques [11].
P.S.S.Akilashri et al. / International Journal of Engineering Science and Technology (IJEST)
The proposed system is to analyse the metal surface live images captured using still camera is explained in this paper. The paper is categorized as six sections. The first section is the abstract, followed by the introduction. The third is the proposed system and next section explains about the results. The remaining sections states the conclusion fallowed by the list of references.
2. Proposed System
The considered live images of the metal surface are taken against metal surface of variety of object. These images are mainly subjected to two different operations in the proposed analysis system. The first step is to pre- process and the second step is to identity the textural edges. The image of the metal surface has many features that need to be treated as such and all the information present in the image are analysed.
In the pre-processing of the metal surface image, the image taken is a raw colour image, which is converted into a monochrome image. The conversion of color image to a monochrome image is done by utilising the HIS colour model. (Fig 1)
Fig 1.
In the HSI model the I value is taken as the grey level value to the monochrome image. This implies the intensity of the image and that gives better information about the surface texture. The Monochrome image is processed further with one level smoothing by Gaussian smoothing. This removes minor noises present in the metal surface image. Smoothing here is made effective, because the input considered is the live raw image taken over the metal surface. These images commonly have some minor noise, which are removed by the Gaussian smoothing.
The smoothened monochrome image (I) of the metal surface is converted to frequency domain (F) by applying one-level haar wavelet transform. The result of the one-level haar wavelet, produce four quadrants that are refined as subbands. Each band refers to each information in the image. These four bands are named as A, B,C,D as shown in the fig 2.
Fig 2
P.S.S.Akilashri et al. / International Journal of Engineering Science and Technology (IJEST)
For every four pixels in the image I, the bands A, B, C, D will have a value in each correspondingly. Say the first set of four pixels in I is termed as which is given by
I1=
Where the four quadrants will have the corresponding values as i1= =
I F
Similarly for each 4 x 4 block in the (I).We have a F-block, which contain at least one values from each quadrants of F i.e., A,B,C and D.
Now, null hypothesis is performed with the Bartlett’s Test, by the formula given below (1). Considering the bands B, C, D as variances, the text is performed for homogeneity
= ∑
∑ (1)
N = ∑ and = ∑ 1
Here is the variance, in our case. B,C and D values for each I block. K is the number of variance and it’s three, as we consider only three values of the quadrants. The Bartlett’s test is performed for these values of B, C,D of in I. The resultant value is compared against the critical value. ,K-1With significance level of 0.05. If the selected block of I passes the test, then block is marked with 1 else 0. The same process is repeated for all the blocks in the image I. The resultant is a binary image that hold the information about the block that passed and failed the test.
3. Result and Discussion
Aiming to indentify the problems that occur on the surface of heavy metal instrument, resulted in the proposed mechanism. To facilitate the problem and its solutions, we further proceed the discussion session based on the known problem on the metal surfaces. They are surface crack, corrosion, etc. The considered images are taken against various metal objects, under various defects and non-defective conditions using still camera. These images are sized to 1024X1024 pixels, resolution.
Each live image captured using still cameras over the metal surface is converted from color to monochrome using the HSI color model.This image is smoothened using Gaussian smoothing filter. Then the smoothened image is transformed using one level haar wavelet. Null hypothesis test is performed using the bartlett’s test on each subband value of the transformed image.
a. Input Image b.Wavelet output c.Result image
Fig 3.
The block that passes the null hypothesis marked as 1 and the one fails with 0.The result is a binary image .The resultant binary image has the information about the texture outline and edges that hides between the texture. The methodology does not directly identify pure edges instead of the edges that correspond to the various defects on the considered metal surface image. The response of the proposed statistical system on the defects like crack and corrosion are well distinguished in the resultant image.
P.S.S.Akilashri et al. / International Journal of Engineering Science and Technology (IJEST)
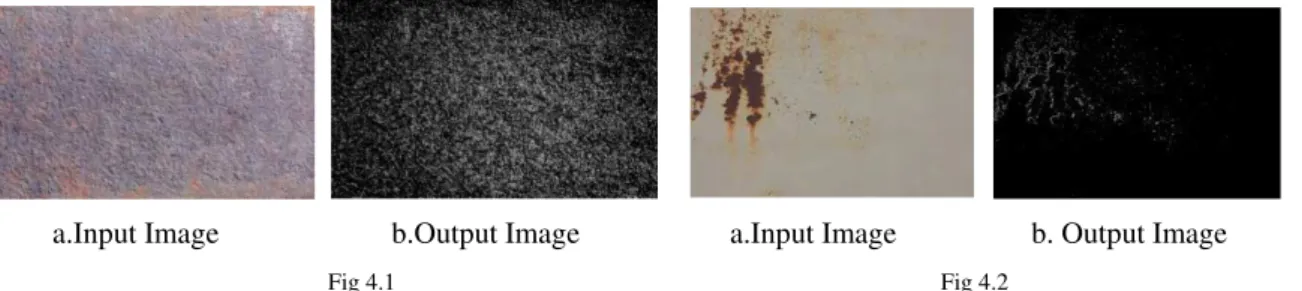
a.Input Image b.Output Image a.Input Image b. Output Image
Fig 4.1 Fig 4.2
The input images have the corrosion effect both as a whole and as a partial corrosion on its surface. The input image of Fig 4.1(a) has the corrosion whole through its surface and it is affect with pores in its surface due to corrosion. The processed output image Fig 4.1(b) shows the impact all over the image indicating the defects. The defect regions are highlighted all over the image , which failed the null hypothesis.
Another considered image Fig 4.2(a) for partial corrosion, produced output by the proposed system which shows the default regions only on the affected area of the metal image. The considered image has corrosion only on the selected regions and the remaining regions are clear and defect free. The processed output Fig 4.2(b) does not have any impact on the clear region expect the region that shows corrosion.
The next problem of the crack that includes the surface impression .of other metal elements due to collision during the industrial application shows a good results in the proposed system
a. Input Image b.Output Image
Fig 5.
In fig-5(a) the crack and the impression are present all through the metal surface. The crack present in the metal surface sheets and the impression are present as the effect of the collisions of other metal instruments on the metal surface., The processed output image shown in the fig-5(b) has positive region whenever the defect are present. It considers the crack as well as the impression in the image that are identified by the null hypothesis test.
4. Conclusion
To replace the human inspection, we propose a visual analysis approach in identifying the cracks and corrosion of live images captured using still cameras over the metal surfaces. We analysis the known problem on the metal surface crack and corrosion using frequency domain, enabled by wavelet transformation fallowed by statistical testing. The statistical testing confirms the validity of our approach. In future we can estimate the nature of the crack and corrosion over the metal surface.
References
[1] A.A.Kassim, M.A., Mannan, Zhu Mian “Texture analysis methods for tool condition monitoring,” Elsevier, B.V. 2006.
[2] Cord, F.Bachb, D.Jeulin, “Texture Classification by statistical learning from morphological image processing – application to metallic surfaces,” The Royal Microscopical Society., 2010.
[3] Tarek Elguebaly, Nizar Bouguila” Bayesian learning of finite generalized Gaucsian mixture models on images,” Elsevier, 2010. [4] A.S.Tolba , H.A.Khan, Hazem.M,Raafat, “Automated Visual Inspection of flat surface products using Features Fusion” IEEE, 2009. [5] Xiaohao Li, Ying Huang, Qunchao Zhao, “Recognition & Extraction Algorithm Design for Defect characterstics of Arm plate Flaw
detection Image,” IEEE, 2010.
[6] Julien Marot, Salah Bourenname, Klaus Spinnler, “ Metal Surface Control System Based on Successive Contour Estimation, “ IEEE,2010.
[7] Jurgay Celik, Tardi Tjahjadi, “Multiscale Texture Classification using dual free complex wavelet transform, “Elsevier B.V., 2008. [8] Laercio B.Gonclaves, Fabiana.R.Leta, Segiode.C.Valente, “Macroscopic Rock Texture Image Classification using an Hierarchical
Neuro Fuzzy System,” IEEE-2009..,
[9] Nizar Bauguila, Djemel Ziou, “ Unsupervised learing of a finite discrete mixture. Applciations to texture modeling and image databases summarization,” Science Direct, 2007.
[10] Matteo Masotti, Renato Campanini, “ Texture Classification using invariant ranklet features,” Science Direct ,2008. [11] Dirmbarean, P.F.Whelan, “Experiments in colour texture Analysis,” Elsevier, 2001.
P.S.S.Akilashri et al. / International Journal of Engineering Science and Technology (IJEST)