Integrated Metabolo-Transcriptomics
Reveals Fusarium Head Blight Candidate
Resistance Genes in Wheat QTL-Fhb2
Dhananjay Dhokane1, Shailesh Karre1, Ajjamada C. Kushalappa1*, Curt McCartney2
1Department of Plant Science, Macdonald Campus, McGill University, 21,111 Lakeshore Road, Sainte-Anne-de-Bellevue, Quebec, H9X 3V9, Canada,2Agriculture and Agri-Food Canada, 195 Dafoe Road, Winnipeg, Manitoba, R3T 2M9, Canada
Abstract
Background
Fusarium head blight (FHB) caused byFusarium graminearumnot only causes severe losses in yield, but also reduces quality of wheat grain by accumulating mycotoxins. Breed-ing for host plant resistance is considered as the best strategy to manage FHB. Resistance in wheat to FHB is quantitative in nature, involving cumulative effects of many genes gov-erning resistance. The poor understanding of genetics and lack of precise phenotyping has hindered the development of FHB resistant cultivars. Though more than 100 QTLs impart-ing FHB resistance have been reported, none discovered the specific genes localized within the QTL region, nor the underlying mechanisms of resistance.
Findings
In our study recombinant inbred lines (RILs) carrying resistant (R-RIL) and susceptible (S-RIL) alleles of QTL-Fhb2 were subjected to metabolome and transcriptome profiling to dis-cover the candidate genes. Metabolome profiling detected a higher abundance of metabo-lites belonging to phenylpropanoid, lignin, glycerophospholipid, flavonoid, fatty acid, and terpenoid biosynthetic pathways in R-RIL than in S-RIL. Transcriptome analysis revealed up-regulation of several receptor kinases, transcription factors, signaling, mycotoxin detoxi-fication and resistance related genes. The dissection of QTL-Fhb2 using flanking marker sequences, integrating metabolomic and transcriptomic datasets, identified 4-Coumarate: CoA ligase (4CL), callose synthase (CS), basic Helix Loop Helix (bHLH041) transcription factor, glutathione S-transferase (GST), ABC transporter-4 (ABC4) and cinnamyl alcohol dehydrogenase (CAD) as putative resistance genes localized within the QTL-Fhb2 region.
Conclusion
Some of the identified genes within the QTL region are associated with structural resistance through cell wall reinforcement, reducing the spread of pathogen through rachis within a spike and few other genes that detoxify DON, the virulence factor, thus eventually reducing a11111
OPEN ACCESS
Citation:Dhokane D, Karre S, Kushalappa AC, McCartney C (2016) Integrated Metabolo-Transcriptomics Reveals Fusarium Head Blight Candidate Resistance Genes in Wheat QTL-Fhb2. PLoS ONE 11(5): e0155851. doi:10.1371/journal. pone.0155851
Editor:JaeHyuk Yu, The University of Wisconsin -Madison, UNITED STATES
Received:February 2, 2016
Accepted:May 5, 2016
Published:May 27, 2016
Copyright:© 2016 Dhokane et al. This is an open access article distributed under the terms of the
Creative Commons Attribution License, which permits unrestricted use, distribution, and reproduction in any medium, provided the original author and source are credited.
Data Availability Statement:All relevant data are within the paper and its Supporting Information files.
disease severity. In conclusion, we report that the wheat resistance QTL-Fhb2 is associated with high rachis resistance through additive resistance effects of genes, based on cell wall enforcement and detoxification of DON. Following further functional characterization and validation, these resistance genes can be used to replace the genes in susceptible commer-cial cultivars, if nonfunctional, based on genome editing to improve FHB resistance.
Introduction
Crop plants in natural environment significantly suffer from several devastating diseases, lead-ing to severe economic losses. Plants resist pathogens through both constitutive or pre-existlead-ing
and induced orde-novosynthesized metabolites and proteins, following pathogen invasion [1].
These resistance metabolites and proteins may be either structural or biochemical. The consti-tutive structural barriers include thick cuticles [2] and cell walls [3], and the resistance bio-chemicals include preformed antimicrobial or toxic secondary metabolites and proteins called phytoanticipins [1,4]. Phytoanticipins are constitutively synthesized secondary plant metabo-lites that provide defense at the outer layers in plants. These may be stored in nontoxic forms, but are released in active forms upon pathogen attack, with simple hydrolysis, as antimicrobial compounds [5]. The induced biochemicals, also known as phytoalexins, include hundreds of resistance metabolites, monomers and polymers, produced following pathogen invasion [6,7]. The induced biochemicals can also be proteins, also known as pathogenesis related (PR) pro-teins [3,8]. The induced structural barriers include formation and deposition of cell wall enforcing compounds such as hydroxycinnamic acid amides (HCAAs) which contain the path-ogen to initial infection site [6].
Resistance in plants against pathogen attack has been considered to be qualitative or
hyper-sensitive response, and quantitative or reduced susceptibility [9,10]. But the distinction
between them are not always clear, rather they are shades of gray [11]. Recently a novel unify-ing concept of resistance has been proposed and the resistance has been defined as the reduced
susceptibility. The resistance is controlled by hierarchies ofRgenes, with regulatory and
resis-tance related (RR) metabolite and protein biosynthetic roles [12]. The resisresis-tance is mainly due to resistance related (RR) metabolites and RR proteins, due to their antimicrobial or cell wall reinforcement properties. These RR metabolites and RR proteins can be constitutive (RRC) or induced (RRI) [13]. The pathogens, following inoculation, produce elicitors that are recognized by the membrane localized receptors called elicitor recognition receptors (ELRRs), encoded by
RELRRgenes, which then trigger downstream genes to induce elicitor triggered immunity
(ELTI), the first line of defense [9–12]. Specialized pathogens enter into the cell, produce
effec-tors by avirulence (AVR) genes, which in turn are recognized by the host effector recognition
receptors (ERRs), encoded byRERRgenes, to induce effector triggered immunity (ETI), the
sec-ond line of defense [9–12]. Both ELTI and ETI result in hypersensitive response, thus
consid-ered to be qualitative resistance [12]. The ETI is considconsid-ered to be due toRERRgenes, and
because of simple inheritance it has been extensively used in developing resistant plants. How-ever, this resistance often breaks down because these genes are only receptor genes, and thus, their association with downstream resistance genes must be confirmed in a given cultivar [12,14]. The resistance is mainly due to RR metabolites and RR proteins, which are either con-stitutively produced (RRC) or induced (RRI), following pathogen invasion [13].
Wheat [Triticum aestivumL. (2n = 6x = 42)] is the second most important cereal crop with
multi-utilitarian value, feeding 40% of the world’s population. Fusarium head blight (FHB)
caused byFusarium graminearumSchwabe [telomorph:Gibberella zeaeSchw. (Petch)] is one of the most devastating and alarming diseases of wheat ruining harvests, in many wheat pro-ducing regions of the world, including Canada [15,16]. The accumulation of mycotoxins such as deoxynivalenol (DON) and nivalenol (NIV) is of major concern due to their detrimental effects on humans and animals [17]. The development of FHB resistant cultivars is considered to be the best way to manage this disease and the accumulation of mycotoxins in grains, as it is the most efficient, economic, and ecofriendly approach to manage FHB [15].
FHB resistance is quantitative in nature, involving several genes, each with small or large effects, and the phenotype is the result of their additive effects. Three different types of FHB resistance in wheat have been recognized and used in breeding: (i) resistance to initial infection or spikelet resistance (type-I), (ii) resistance to spread within the spike or rachis resistance (type-II), and (iii) resistance to mycotoxin accumulation in grains (type-III) [18]. The develop-ment of resistant cultivars is very challenging because of limited understanding of genetics of resistance and lack of cost-effective means to phenotype [19]. The screening is generally done based on spray inoculation which leads to high experimental errors, leading to inconsistent ranking of genotypes over years. Inoculation under controlled conditions can significantly reduce the experimental error and can enable quantification of both spikelet and rachis resis-tance [20].
More than 100 quantitative trait loci (QTLs) for FHB resistance have been identified in wheat [21]. The FHB resistant QTLs, with major and/or minor effects, have been mapped on all the wheat chromosomes, except on 7D [21]. Major QTLs on chromosome 3B (QTL-Fhb1) [22], 6B (QTL-Fhb2) [23] and 2D (QTL-2DL) [16], exhibit rachis resistance, and on chromo-somes 5A (QTL-Fhb5) [22] and 4B (QTL-Fhb4) [16] confer spikelet resistance. The transfer of resistant QTLs based on marker assisted breeding is not very practical because these QTLs, in general, contain undesirable genes that are also transferred due to linkage drag.
The QTL-Fhb2 localized on the short arm of chromosome 6B is the second major QTL con-ferring rachis resistance [23]. The QTL-Fhb2 has been mapped as a Mendelian factor, spanning a region of 4.2 cM flanked by two simple sequence repeat (SSR) markers, GWM-133 and GWM-644, using recombinant inbred (RIL) population derived from a cross between BW278 (resistant parent) and AC foremost (susceptible parent), and the QTL explained 24.1% of resis-tance to FHB [23]. Resistant parent BW278 is a descendant of Sumai-3, a Chinese bread wheat cultivar which possesses high level of rachis resistance [22]. Similarly, the QTL-Fhb2 was mapped on 6BS using double haploid population, which conferred 21% resistance to FHB [24]. Both the studies reported high levels of rachis resistance, but no study has reported the specific genes localized in the QTL-Fhb2 region conferring resistance, nor the mechanisms of resis-tance. As the QTL regions contain several genes, the dissection and functional characterization of each gene localized in the QTL region on genomic scale is a very challenging task, especially in wheat which possesses a highly complex genome and lacks a complete genome sequence [25]. Therefore, genes in the QTL regions and the resistance mechanisms governed by them are not studied in detail. Even though significant attempts have been made to identify candi-date genes localized within the QTL-Fhb1 [6,26], QTL-Fhb5 [27], so far no FHB resistance gene has been identified and validated.
Technological advancements in genome sequencing and integration of omics platforms have offered novel insights to explore the regulation of metabolic pathways and their
biosyn-thetic genes underlying disease resistance mechanisms [6,28–30]. Metabolomics is a potential
post-genomics tool to elucidate the host biochemical responses under biotic stress, to identify
the candidateRgenes, and to validate gene functions [6,31–33]. Non-targeted metabolomics
has been applied to reveal the host biochemical mechanisms of quantitative resistance in crop
Phytophthora infestans[28–30,33]. Non-targeted metabolic profiling of wheat near isogenic lines (NILs) with FHB resistant QTL-Fhb1 revealed deposition of HCCAs in the cell wall that reduced further spread of pathogen within rachis, thus imparting resistance [6]. Higher abun-dance of several resistance metabolites belonging to phenylpropanoids, flavonoids, fatty acids,
and terpenoids that inhibited the growth ofF.graminearumand trichothecene biosynthesis
was identified in barley againstF.graminearum[35,38]. Metabolic profiling of resistant and
susceptible potato cultivars against late blight identified phenylpropanoids and their
biosyn-thetic genes regulated byStWRKY1[28].
The transcriptome is highly active and instantly changes with response to cellular
perturba-tions. The study of wheat transcriptome underFusariumstress revealed the expressed genes
following FHB infection [39,40]. QTL-Fhb1 specific RNA-seq of Wangshuibai and its mutant NAUH117 (lacking a chromosome region including QTL-Fhb1 segment), revealed association
ofPR5,PR14, ABC transporter and jasmonic acid pathway genes in FHB resistance in wheat
[39]. Transcriptome analysis using RNA-seq in maize uponFusarium verticillioidesinoculation
revealed the involvement of shikimate, flavonoid, lignin and terpenoid biosynthetic pathways
in imparting FHB resistance [40]. A lipid transfer protein (LTP) was found to be constitutively
more abundant in NIL carrying QTL-Fhb5, based on microarray [27]. QTL-specific microar-ray analysis of Sumai-3 and two susceptible NILs showed up-regulation of 25 genes and the
genes encoding PR proteins, likeβ-1-3 glucanase (PR-2), thaumatin like proteins (PR-5) and
wheatwins (PR-4) were significantly over-expressed in genotypes containing Sumai-3 3BS
region [41]. Microarray analysis of near isogenic lines carrying QTL-3BS, showed the up-regu-lation of genes involved in cell wall biogenesis upon fusarium infection [42]. A gene UDP-gly-cosyltransferase was reported to be highly over-expressed in NILs harboring two QTL-Fhb1 and QTL-Fhb5, based on microarray analysis, which has a major role in the detoxification of deoxynivalenol [42].
Considering this background, RILs carrying resistant and susceptible alleles of genes
in QTL-Fhb2 were subjected to metabolome and transcriptome profiling uponF.
grami-nearuminoculation. Our study is the first report that revealed six putative resistance genes
localized within the QTL-Fhb2 region and also the plausible association of cell wall enforcing metabolites, explaining the underlying mechanisms of resistance, based on the integration of metabolomics and transcriptomics. The application of these genes, following validation, is discussed.
Results
Disease severity of RILs
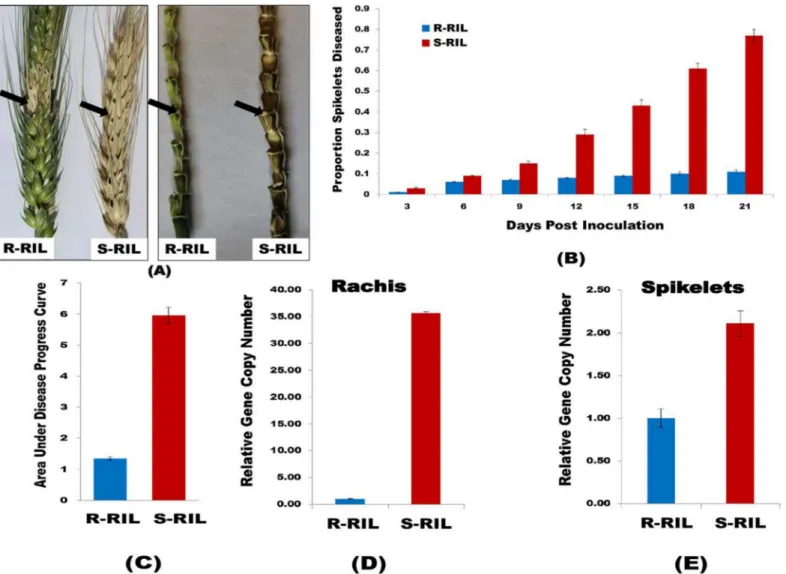
Spikelets showing necrotic lesions and bleaching symptoms were considered as diseased. The diseased symptoms were visible at 3 dpi as small, tiny necrotic spots on the inoculated pair of spikelets. The numbers of spikelets diseased in R-RIL were very few; the fungus was able to col-onize only spikelets adjacent to the inoculated pair of spikelet, not further, even at 21 dpi. On other hand, in S-RIL the fungus was able to spread through rachis making the whole spike dis-eased at 21 dpi (Fig 1A). The rachis was lush green in R-RIL without any disease symptoms in rest of the spikelets, unlike in S-RIL where both rachis and spikelets were diseased showing blackish brown discoloration with necrotic lesions. This clearly demonstrated that the QTL imparts high rachis resistance as the fungus was unable to spread through rachis in R-RIL. The PSD in S-RIL was highly significant than in R-RIL (Fig 1B). The AUDPC calculated from PSD
was significantly higher (P<0.001) in S-RIL (AUDPC = 5.95) than in R-RIL (AUDPC = 1.34)
Quantity of fungal biomass in RILs
The quantity of fungal biomass, quantified as relative copy number ofTri6gene, was highly
sig-nificant in rachis of S-RIL as compared to R-RIL (Fig 1D). The reduced amount of fungal bio-mass in rachis of R-RIL, due to reduced ability of the pathogen to colonize the rachis, clearly
demonstrates the role of QTL-Fhb2 in the R-RIL. Whereas, in the S-RIL theTri6gene copy
number was high, as the fungus was able to move through the rachis to the adjacent spikelets,
meaning absence of rachis resistance. The relative gene copy number ofTri6was also
calcu-lated for the spikelets collected from both R-RIL and S-RIL, and it was found that theTri6gene
copy number was also significantly higher in S-RIL than in R-RIL, but the fold change was
Fig 1. Phenotyping of RILs.(A). Spike and rachis of R-RIL and S-RIL, 21 dpi withF.graminearumspore suspension. A single alternate pair of spikelets in a spike was inoculated; black arrows indicate the site of inoculation. The spike and rachis in R-RIL shows only necrotic spots or diseased symptoms limited to the inoculated spikelet, while in S-RIL both spikelet and rachis are entirely diseased. (B). Proportion of Spikelets Diseased (PSD). A single pair of spikelets of a spike was inoculated in both the RILs and the proportion of spikelets diseased was recorded at 3 days intervals until 21 days, from which the PSD was calculated. The bar graph shows high PSD in S-RIL as compared to R-RIL. (C). The bar graph shows area under disease progress curve (AUDPC) calculated from PSD, significantly higher in S-RIL. (D) and (E). Fungal Biomass quantification in RILs. Three alternate pair of spikelets were inoculated withF.graminearumspore suspension and samples were collected at 7 dpi. The total genomic DNA was extracted and the relative gene copy number ofTri6was estimated using 2−ΔΔC
Tmethod. (D). Shows the relative gene copy number ofTri6in rachis tissues; (E). Shows the relative gene copy number ofTri6in spikelet tissues. In both graphs, the gene copy number ofTri6is significantly higher in S-RIL as compared to R-RIL.
comparatively lower in spikelets than in rachis (Fig 1E). These results clearly demonstrate that the resistant alleles of genes in QTL-Fhb2 impart high rachis resistance.
Resistance related induced (RRI) metabolites associated with
QTL-Fhb2
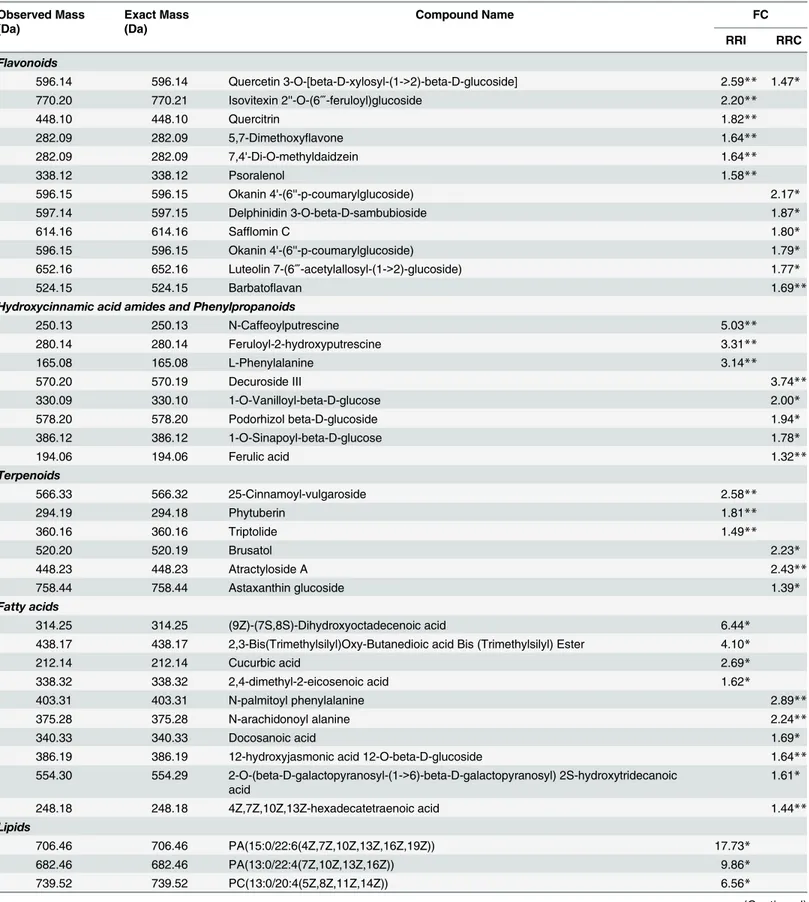
A total of 546 RRI metabolites were differentially accumulated, of which 41 had relatively high fold change in R-RIL (S1 Table). The RRI metabolites accumulated in higher abundance mainly belonged to phenylpropanoid, flavonoid, lignin, lipid, fatty acid, and terpenoid class of
compounds (Table 1;S2 Table;Fig 2A). Metabolites belonging to lipids, in particular, the
glycerophospholipids such as, phosphatidic acid (FC = 17.72 & 9.86), phosphatidylcholine (FC = 6.56), phosphatidylinositol (FC = 5.77) were significantly higher in abundance (Table 1). Metabolites belonging to phenylpropanoid biosynthetic pathway, in particular hydroxycin-namic acids (HCAs) such as N-caffeoylputrescine (FC = 5.03) and feruloyl-2-hydroxyputres-cine (FC = 3.33) were found to be higher in abundance. Metabolites belonging to flavonoid
biosynthetic pathway such as quercetin 3-O-[beta-D-xylosyl-(1->2)-beta-D-glucoside]
(FC = 2.59), isovitexin 2''-O-(6‴-feruloyl) glucoside (FC = 2.20), quercitrin (FC = 1.82),
5,7-dimethoxyflavone (FC = 1.64) were few among many that were found in higher abundance. Seven metabolites belonging to fatty acids class of compounds such as 9Z)-(7S, 8S)-Dihydrox-yoctadecenoic acid (FC = 6.44), 2,3-Bis (Trimethylsilyl) Oxy-Butanedioic acid Bis (Trimethyl-silyl) Ester (FC = 4.10), and cucurbic acid (FC = 2.69). Delcosine (FC = 1.59) an alkaloid was also high in abundance. The compounds identified are known to be involved either in cell wall reinforcement or act as antifungal, antibacterial and antimicrobial compounds, depicting role in FHB resistance.
Resistance related constitutive (RRC) metabolites associated with
QTL-Fhb2
A total of 550 RRC metabolites were differentially accumulated, of which 57 were putatively
identified (S1 Table). These metabolites belonged to different chemical groups (Table 1;S2
Table;Fig 2B):Flavonoids (13): okanin 4'-(6''-p-coumarylglucoside) (FC = 2.17), delphinidin
3-O-beta-D-sambubioside (FC = 1.87), safflomin C (FC = 1.80);Phenylpropanoids (5):
decuroside III (FC = 3.74), 1-O-vanilloyl-beta-D-glucose (FC = 2.0), podorhizol beta-D-glu-coside (FC = 1.94), 1-O-sinapoyl-beta-D-glucose (FC = 1.78) and ferulic acid (FC = 1.32);
Fatty acids (9): N-palmitoyl phenylalanine (FC = 2.89), N-arachidonoyl alanine (FC = 2.24),
and docosanoic acid (FC = 1.69);Terpenoids (3): brusatol (FC = 2.23), atractyloside-A
(FC = 2.43), astaxanthin glucoside (FC = 1.39);Glycerophospholipids (22): phosphatidic acid
(FC = 5.81), phosphatidylinositol (FC = 3.30), and phosphatidylcholine (FC = 3.26). These high fold change constitutive (RRC) and induced (RRI) metabolites, mainly belonged to phe-nylpropanoid (hydroxycinnamic acids), flavonoid, glycerophospholipid, and fatty acid classes of compounds, are considered to be responsible for FHB resistance.
Comparative transcriptome of RILs based on RNA-seq
Whole transcriptome analysis (RNA-seq) was done with two genotypes, viz, R-RIL and S-RIL, across four treatments (RP, RM, SP, SM) with three biological replicates for each, collected at 48 hpi. The assembly of sequences, from the 12 sequenced samples, were compared and anno-tated. Transcriptome analysis using RNA-seq generated 155012 and 165036 transcripts in R-RIL and S- RIL, respectively. The number of transcripts up-regulated and down-regulated in
Table 1. High fold change resistance related induced (RRI) and resistance related constitutive (RRC) metabolites identified uponF.graminearum
and mock inoculation of RILs carrying resistant and susceptible alleles of QTL-Fhb2. Observed Mass
(Da)
Exact Mass (Da)
Compound Name FC
RRI RRC
Flavonoids
596.14 596.14 Quercetin 3-O-[beta-D-xylosyl-(1->2)-beta-D-glucoside] 2.59** 1.47*
770.20 770.21 Isovitexin 2''-O-(6‴-feruloyl)glucoside 2.20**
448.10 448.10 Quercitrin 1.82**
282.09 282.09 5,7-Dimethoxyflavone 1.64**
282.09 282.09 7,4'-Di-O-methyldaidzein 1.64**
338.12 338.12 Psoralenol 1.58**
596.15 596.15 Okanin 4'-(6''-p-coumarylglucoside) 2.17*
597.14 597.15 Delphinidin 3-O-beta-D-sambubioside 1.87*
614.16 614.16 Safflomin C 1.80*
596.15 596.15 Okanin 4'-(6''-p-coumarylglucoside) 1.79*
652.16 652.16 Luteolin 7-(6‴-acetylallosyl-(1->2)-glucoside) 1.77*
524.15 524.15 Barbatoflavan 1.69**
Hydroxycinnamic acid amides and Phenylpropanoids
250.13 250.13 N-Caffeoylputrescine 5.03**
280.14 280.14 Feruloyl-2-hydroxyputrescine 3.31**
165.08 165.08 L-Phenylalanine 3.14**
570.20 570.19 Decuroside III 3.74**
330.09 330.10 1-O-Vanilloyl-beta-D-glucose 2.00*
578.20 578.20 Podorhizol beta-D-glucoside 1.94*
386.12 386.12 1-O-Sinapoyl-beta-D-glucose 1.78*
194.06 194.06 Ferulic acid 1.32**
Terpenoids
566.33 566.32 25-Cinnamoyl-vulgaroside 2.58**
294.19 294.18 Phytuberin 1.81**
360.16 360.16 Triptolide 1.49**
520.20 520.19 Brusatol 2.23*
448.23 448.23 Atractyloside A 2.43**
758.44 758.44 Astaxanthin glucoside 1.39*
Fatty acids
314.25 314.25 (9Z)-(7S,8S)-Dihydroxyoctadecenoic acid 6.44*
438.17 438.17 2,3-Bis(Trimethylsilyl)Oxy-Butanedioic acid Bis (Trimethylsilyl) Ester 4.10*
212.14 212.14 Cucurbic acid 2.69*
338.32 338.32 2,4-dimethyl-2-eicosenoic acid 1.62*
403.31 403.31 N-palmitoyl phenylalanine 2.89**
375.28 375.28 N-arachidonoyl alanine 2.24**
340.33 340.33 Docosanoic acid 1.69*
386.19 386.19 12-hydroxyjasmonic acid 12-O-beta-D-glucoside 1.64**
554.30 554.29 2-O-(beta-D-galactopyranosyl-(1->6)-beta-D-galactopyranosyl) 2S-hydroxytridecanoic acid
1.61*
248.18 248.18 4Z,7Z,10Z,13Z-hexadecatetraenoic acid 1.44**
Lipids
706.46 706.46 PA(15:0/22:6(4Z,7Z,10Z,13Z,16Z,19Z)) 17.73*
682.46 682.46 PA(13:0/22:4(7Z,10Z,13Z,16Z)) 9.86*
739.52 739.52 PC(13:0/20:4(5Z,8Z,11Z,14Z)) 6.56*
up-regulated in R-RIL and S-RIL based on their involvement in biological processes, molecular functions and cellular component in which they are localized (S1 Fig). The majority of the tran-scripts depicted their involvement in biological processes such as translation, transcription, response to oxidative stress, lipid metabolism, photosynthesis, DNA repair, protein folding, carbohydrate metabolic processes, trans-membrane transport, suggesting the involvement of various pathways and/or interactions in disease resistance. Differential gene expression (DGEs) analysis classified transcripts as differentially expressed with Log2FC values, or
Table 1. (Continued)
Observed Mass (Da)
Exact Mass (Da)
Compound Name FC
RRI RRC
834.53 834.53 PI(15:1(9Z)/19:1(9Z)) 5.77*
739.52 739.52 PE(16:0/20:4(5Z,8Z,11Z,14Z)) 5.27*
706.46 706.46 PA(15:0/22:6(4Z,7Z,10Z,13Z,16Z,19Z)) 5.81*
686.49 686.49 DG(20:5(5Z,8Z,11Z,14Z,17Z)/22:6(4Z,7Z,10Z,13Z,16Z,19Z)/0:0)[iso] 5.44**
854.50 854.49 PI(16:1(9Z)/20:5(5Z,8Z,11Z,14Z,17Z)) 3.30**
Alkaloids
452.26 453.27 Delcosine 1.59**
Fold change (FC) was calculated based on relative intensity of metabolites: RRC = RM/SM and RRI = (RP/RM)/(SP/SM), where RM = Resistant Mock; SM = Susceptible Mock; RP = Resistant Pathogen; RM = Resistant Mock.
Note:
**significant atP<0.01;
*significant atP<0.05; the significance of RRI was based on RP>RM and SP>SM.
doi:10.1371/journal.pone.0155851.t001
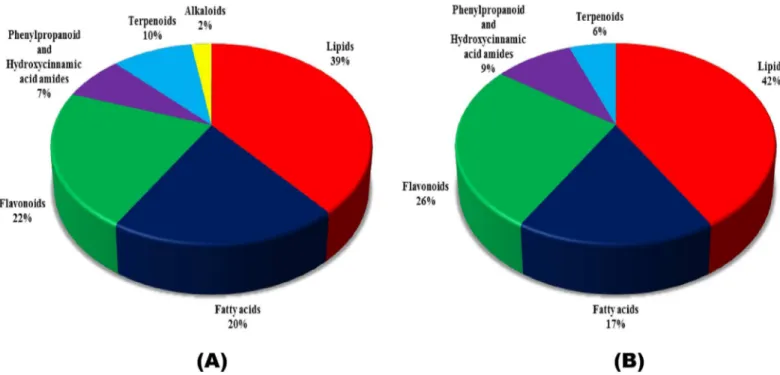
Fig 2. Classification of metabolites detected at 72 hours postFusarium graminearumand water inoculations.Resistant Related Induced (RRI) and Resistant Related Constitutive (RRC) metabolites identified in the study were classified according to their chemical groups. (A) Pie chart shows RRI and (B) shows RRC metabolites classified into various chemical groups.
transcripts expressed only in either of the genotypes or expressed only upon pathogen
inocula-tion with FPKM values (Table 2;S2 Table). The differentially expressed transcripts (highly
up-regulated and highly down-up-regulated) in R-RIL and S-RIL are shown in the form of heat maps with the respective gene IDs (Fig 3B). Pathway analysis of transcripts showed that majority of transcripts belonged to phenylpropanoid, flavonoid, fatty acid, oxylipin/jasmonic acid, and phospholipid pathways.
Genotype-specific transcriptional changes in response to
F
.
graminearum
The genotype-specific transcriptional modulations are clear indications from the gene ontology classification (S1 Fig), showing the differences in the functional categories of the transcripts in each RIL. The R-RIL dataset, in particular, upon pathogen treatment are considered best to identify the transcripts that would possibly be involved in imparting FHB resistance. Neverthe-less, in S-RIL pathogen inoculated dataset, the transcripts down-regulated were not overlooked. The transcripts up-regulated in R-RIL were further classified according to their involvement in various biosynthetic pathways or regulators of gene expression (transcription factors, protein kinases, and secondary messengers) or transcripts belonging to RR-proteins involved in DON
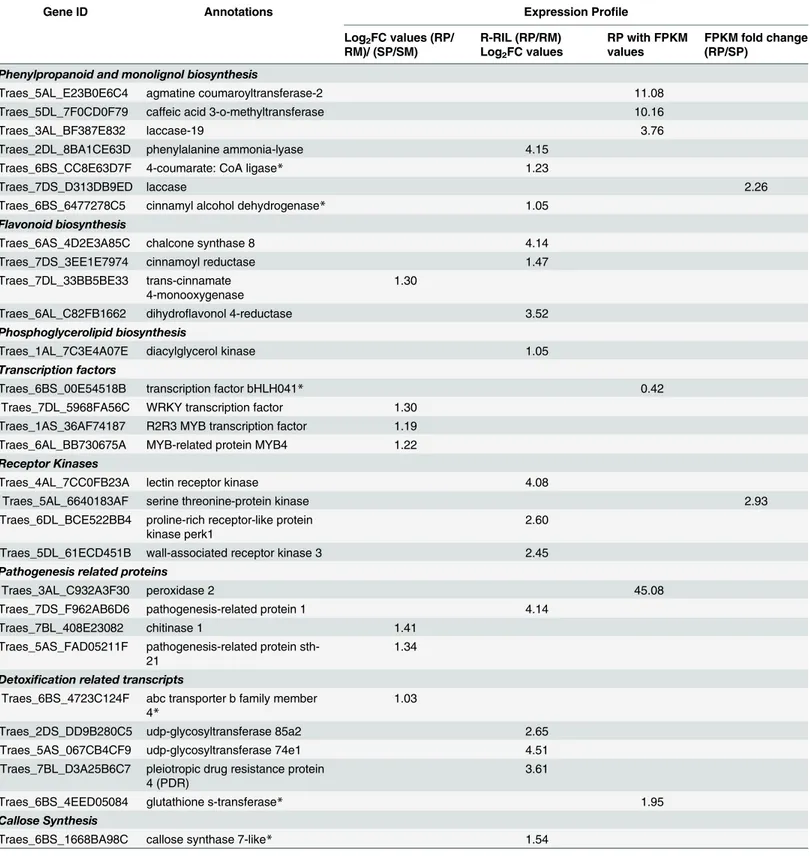
detoxification (Table 2). The transcription factorbHLH041(FPKM = 0.42) was detected only
in RP, suggesting its role in FHB defense. Apart frombHLH, transcription regulatory genes
likeWRKY,R2R3 MYBandMYB-4were up-regulated in R-RIL (Table 2). The transcripts
belonging to phenylpropanoid pathway genes such as agmatine coumaroyltransferase-2
(ACT, FPKM = 11.08), caffeic acid 3-o-methyltransferase (CoMT, FPKM = 10.16), laccase
(FPKM = 3.19) were detected only in RP, while phenylalanine ammonia-lyase (PAL,
FC = 4.15) and 4-coumarate: CoA ligase (4CL, FC = 1.23) were detected only in R-RIL.
Cinna-myl alcohol dehydrogenase (CAD) was detected in both the RP and SP, with higher expression
Fig 3. Differentially expressed transcripts in RILs.(A). Venn diagram showing number of transcripts detected as up and down-regulated (P<0.01) in
R-RIL and S-RIL, 48 hours postFusarium graminearuminoculation. (B). Heat Maps showing differentially expressed transcripts in R-RIL and S-RIL upon
Fusarium graminearumand mock inoculations. They show transcripts differentially expressed transcripts between resistant mock (RM) and resistant pathogen (RP) and between susceptible mock (SM) and susceptible pathogen (SP), respectively.
Table 2. Differentially expressed transcripts in R-RIL and S-RIL uponFusarium graminearumand mock inoculation at 48 hpi.The differential expressions are in log2FC values for the resistant genotype and in FPKM values following pathogen inoculation. The up-regulated transcripts were classified according to their biosynthetic pathways. The transcripts localized within QTL-Fhb2 are marked with an asterisk (*).
Gene ID Annotations Expression Profile
Log2FC values (RP/
RM)/ (SP/SM)
R-RIL (RP/RM) Log2FC values
RP with FPKM values
FPKM fold change (RP/SP)
Phenylpropanoid and monolignol biosynthesis
Traes_5AL_E23B0E6C4 agmatine coumaroyltransferase-2 11.08
Traes_5DL_7F0CD0F79 caffeic acid 3-o-methyltransferase 10.16
Traes_3AL_BF387E832 laccase-19 3.76
Traes_2DL_8BA1CE63D phenylalanine ammonia-lyase 4.15
Traes_6BS_CC8E63D7F 4-coumarate: CoA ligase* 1.23
Traes_7DS_D313DB9ED laccase 2.26
Traes_6BS_6477278C5 cinnamyl alcohol dehydrogenase* 1.05
Flavonoid biosynthesis
Traes_6AS_4D2E3A85C chalcone synthase 8 4.14
Traes_7DS_3EE1E7974 cinnamoyl reductase 1.47
Traes_7DL_33BB5BE33 trans-cinnamate 4-monooxygenase
1.30
Traes_6AL_C82FB1662 dihydroflavonol 4-reductase 3.52
Phosphoglycerolipid biosynthesis
Traes_1AL_7C3E4A07E diacylglycerol kinase 1.05
Transcription factors
Traes_6BS_00E54518B transcription factor bHLH041* 0.42
Traes_7DL_5968FA56C WRKY transcription factor 1.30 Traes_1AS_36AF74187 R2R3 MYB transcription factor 1.19 Traes_6AL_BB730675A MYB-related protein MYB4 1.22
Receptor Kinases
Traes_4AL_7CC0FB23A lectin receptor kinase 4.08
Traes_5AL_6640183AF serine threonine-protein kinase 2.93
Traes_6DL_BCE522BB4 proline-rich receptor-like protein kinase perk1
2.60
Traes_5DL_61ECD451B wall-associated receptor kinase 3 2.45
Pathogenesis related proteins
Traes_3AL_C932A3F30 peroxidase 2 45.08
Traes_7DS_F962AB6D6 pathogenesis-related protein 1 4.14
Traes_7BL_408E23082 chitinase 1 1.41
Traes_5AS_FAD05211F pathogenesis-related protein sth-21
1.34
Detoxification related transcripts
Traes_6BS_4723C124F abc transporter b family member 4*
1.03
Traes_2DS_DD9B280C5 udp-glycosyltransferase 85a2 2.65
Traes_5AS_067CB4CF9 udp-glycosyltransferase 74e1 4.51
Traes_7BL_D3A25B6C7 pleiotropic drug resistance protein 4 (PDR)
3.61
Traes_6BS_4EED05084 glutathione s-transferase* 1.95
Callose Synthesis
Traes_6BS_1668BA98C callose synthase 7-like* 1.54
RP = Resistant pathogen, RM = Resistant Mock, SP = Susceptible pathogen, SM = Susceptible Mock. FPKM = Fragment per kilobase of transcript per million mapped reads.
in RP. Chalcone synthase 8 (CS8), cinnamoyl reductase (CR), and dihydroflavonol 4-reductase
(DHFR) genes of flavonoid biosynthetic pathway were up-regulated in RP. Receptors kinases
like lectin receptor kinase (LRK, FC = 4.08), proline-rich receptor-like protein kinase perk
(FC = 2.60), wall-associated receptor kinase 3 (WAK3, FC = 2.45) were also up-regulated in
RP. Transcripts belonging to PR protein, peroxidase 2 (PR2, FPKM = 45.08) was detected only
in RP. Several other PR proteins such asPR1,PR2, and chitinases were also up-regulated in RP.
Transcripts involved in the detoxification were highly up-regulated in RP such as, UDP-glyco-syltransferases, multidrug resistance proteins, pleiotropic drug resistance proteins, ABC
trans-porters and glutathione S- transferases (Table 2;S2 Table). All the transcripts up-regulated
in resistant genotype were reported to be involved in FHB resistance, thus implicating the involvement of a hierarchy of genes and/or interactions in imparting FHB resistance in wheat.
Genetic controls underlying QTL-Fhb2
The markers flanking the QTL were sequenced and the region (sequence) within the two flank-ing markers was considered as QTL-Fhb2 region usflank-ing wheat survey sequence available (http:// wheat-urgi.versailles.inra.fr/). The transcripts aligning to the 6BS reference genome were pulled out separately and furthermore, the transcripts aligning to the sequence within the flanking marker co-ordinates were considered as genes localized within QTL-Fhb2 region. Based on high FC metabolites and transcripts in R-RIL we were able to localize six putative candidate genes within the QTL-Fhb2 region that were associated with biotic stress resistance functions (Fig 4).
The putative candidate genes localized within the region were:4CL,bHLH041TF,GST,ABC-4,
CS, andCAD. The expression values for these genes localized within the QTL-Fhb2 region are
presented inTable 2(transcripts marked with asterisk ()). The list of all the genes localized
within the QTL-Fhb2 region is provided inS3 Table.
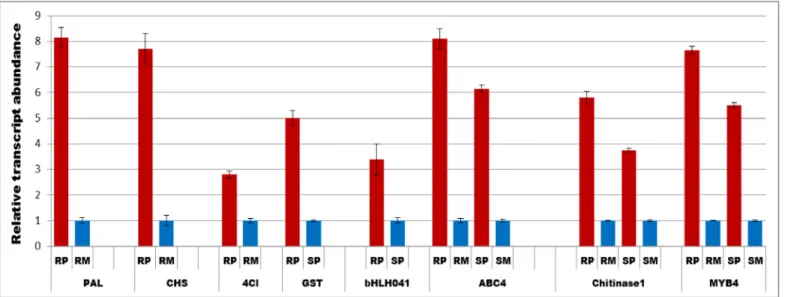
Confirmation of gene expression based on qRT-PCR
To validate the RNA-seq data a qRT-PCR analysis was carried out for a few selected genes,
such as,4CL,bHLH041,ABC-4,GST,chitinase1,CHS,PALandMYB4. The expression values
obtained from qRT-PCR analysis for the selected genes were similar to RNA-seq confirming the reproducibility of transcriptome data (Fig 5).
Discussion
Resistance in wheat against FHB is quantitative and more than 100 QTLs with major or minor effects have been identified and mapped on all wheat chromosomes, expect on 7D. However, the genetic controls underlying these resistant QTLs are yet to be revealed. These QTL regions, even when they are fine mapped, contain several genes, including those conferring resistance. Identification of candidate genes and their resistance functions are crucial to map the hierar-chical network of genes involved in the biosynthesis of a given or set of RR metabolite(s),
which directly suppresses the pathogen progress. TheRgenes biosynthesizing these RR
metab-olites are regulated by otherRgenes; thus the functional hierarchy must be confirmed before
an individual gene can be transferred to a susceptible genotype [12]. Also these specific candi-date genes can be transferred without linkage drag effects based on genome editing tools. In
view of this, an attempt was made to dissect one of the major FHB resistant QTL-Fhb2 to
Metabolic profiling identified potential FHB resistance biomarkers
Non-targeted metabolic profiling of genotypes with contrasting levels of FHB resistance identified several RR metabolites, highly accumulated, in different metabolic pathways such as glycerophospholipid, phenylpropanoid (HCAAs), flavonoid, fatty acid and terpenoid. Glycerophospholipids like phosphatidic acid (PA) (FC = 17.72), phosphatidylcholine (FC = 6.56), phosphatidylinositol (FC = 5.77) are known to be deposited to enforce cell walls. Furthermore, these are also known to perceive and transmit signals activating downstream
genes eventually regulatingRgenes to biosynthesize RR metabolites and RR proteins [43].
These compounds are either converted into bioactive lipids (components of lipid bilayer of cell membrane) or stay as soluble molecules (messengers), further binding to the downstream mitogen activated protein kinases (MAPK), further affecting the enzymatic activities, vesicle trafficking and ion fluxes [43]. PA acid is an important secondary messenger in plant stress signaling [44]. These stresses involve pathogen attack, salinity, cold, drought, heat and wounding. In regard to pathogen response, PA acid has been shown to accumulate in
Fig 4. Wheat chromosome 6B, depicting the physical location of QTL-Fhb2 (marked red), on short arm of the chromosome 6B, flanked by two SSR markers GWM-133 and GWM-644 (marked blue).The genes localized within the QTL locus were identified using metabolo-transcriptomics approach, which are shown within two arrow marks, marked purple in text. The corresponding gene Ids are given in parenthesis.
response to various elicitors such as xylanase, flagellin, and chitosan [45]. Interestingly, a gene diacylglycerol kinase (DGK) that catalyzes the conversion of structural lipids (PC, PE, PS) into PA was upregulated in our study. This clearly illustrates that the early membrane modifications and their involvement in further activating defense responses are very crucial.
Rachis resistance in wheat is mainly due to the deposition of HCCAs [6]. In our study, we detected a higher abundance of two HCCAs in particular, N-Caffeoylputrescine (FC = 5.03)
and Feruloyl-2-hydroxyputrescine (FC = 3.31) uponF.graminearuminoculation. Suberin, a
complex, intractable biopolymer, with polyaromatic domain of HCCAs, is deposited apoplasti-cally between the primary cell wall and plasma membrane to enforce cell walls [46]. Once, the
cell walls are thickened the pathogen won’t be able to spread within the spike, through the
rachis, thus imparting high levels of rachis resistance. Resistance in NIL carrying resistant alleles of QTL-Fhb1 was reported to be due to the deposition coumaroylputrescine, feruloylpu-trescine, coumaroylagmatine, cinnamoylserotonin, feruloylagmatine, p-coumaroylserotonin [6]. HCCAs such as feruloylputrescine, p-coumaroyltyramine, N-feruloyltyramine, 4-coumar-oyl-3-hydroxyagmatine, feruloylagmatine, 4- coumaroylagmatine, terrestriamide, and feruloyl-serotonin were reported to impart late blight resistance in potato [30,33]. HCCAs imparted
resistance in tomato againstPseudomonas syringae[47], in maize againstF.graminearum[48],
in onion againstBotrytis allii[49]. These HCCAs are not only involved in cell wall thickening,
but also they possess antioxidant, antiviral, antibacterial and antifungal activities [47]. Silencing
ofSt-WRKY1reduced not only HCAAs, but also increased susceptibility of potato to late
blight, thus confirming the role of HCAAs in resistance. These HCCAs can be used as markers
to screen FHB resistance genotypes, because RR metabolites being the end products ofRgene
function, guarantee resistance [14].
Apart from HCCAs, we also have identified several flavonoids with high abundance, as RRI
and RRC metabolites, such as, quercetin 3-O-[beta-D-xylosyl-(1->2)-beta-D-glucoside],
isovi-texin 2''-O-(6‴-feruloyl) glucoside, quercitrin, 5,7-dimethoxyflavone,
7,4'-di-O-methyldaid-zein, psoralenol, fisetinidol-4beta-ol 3,4,7,3',4'-pentamethyl ether, glyceollin I, and
3,7-di-O-Fig 5. Quantitative Real time PCR (qRT-PCR) showing transcript abundances of selected genes at 48 h postF.graminearumand water inoculation.The relative transcript abundance were calculated compared to mock treatments and for transcripts which were only expressed in pathogen treated treatments, susceptible pathogen was used to compare the abundance in resistant pathogen. RP = Resistant pathogen, RM = Resistant mock, SP = Susceptible pathogen and SM = Susceptible mock. PAL-Phenylammonia lyase, CHS = chalcone synthase, 4Cl = 4 coumarate CoA-ligase, GST = Glutathione S-transferase, bHLH041 = basic helix loop helix transcription factor, ABC4 = ABC transporter4.
methylquercetin. The growth ofFusariumand macroconidia formation is completely inhibited
by dihydroxyquercetin [50], and of the fungusNeurospora crassaby quercetin 3-methyl ether
and its conjugated glucosides [51]. The deposition of flavonoid conjugates (of glucoside and methoxy) was higher in rachis tissues of NIL carrying resistance alleles of genes in QTL-Fhb1 [6]. The involvement of both preformed and induced flavonoids in plant defense against patho-gens, herbivores, and environmental stress is well documented [52]. In resistant barley several
flavonoids were accumulated in high abundance uponF.graminearuminoculation [35,38].
We detected high fold accumulation of preformed and induced free fatty acids such as dihy-droxyoctadecenoic acid, 2,3-bis(trimethylsilyl)oxy-butanedioic acid bis (trimethylsilyl) ester, cucurbic acid, 2,4-dimethyl-2-eicosenoic acid, N-palmitoyl phenylalanine, and N-arachidonoyl alanine. Fatty acids are not only part of structural constituents, but also act as secondary mes-sengers and regulators of signal transducing molecules or transcription factors [53]. Arachi-donic acid acts as an elicitor in plant defense response to phytopathogens [54]. Several free
fatty acids were accumulated in barley uponF.graminearuminvasion [38]. The antifungal
capabilities of octadecenoic, tetradecanoic, docosanoic, butenoic acid have been reported [55]. Hence, these fatty acids may be crucial components of FHB resistance in wheat, not only acting as physical barriers, but also as antimicrobials.
Transcriptome changes provided key insights to genetic reprogramming
upon pathogen invasion
Transcripts belonging to phenylpropanoid and flavonoid pathways, including receptor kinases, transcription factors, detoxification, and signaling genes were highly regulated, following path-ogen inoculation (Table 2). The elicitors produced by pathpath-ogen are perceived by plant mem-brane receptors. In our study, we found higher transcript abundances of lectin receptor kinase
(LRK), serine threonine-protein kinase (STPK), proline-rich receptor-like protein kinase
(PERK1), and wall-associated receptor kinase 3 (WAK3). The role of LRKs [56],STPKs[57],
andWAKs[58] in plant defense is well documented. The overexpression ofWAK1in
Arabi-dopsis thalianaconferred higher resistance toBotrytis cinerea[58]. The resistance to fungal
pathogenMagnaporthe griseawas due to a G-type lectin receptor kinase (Pi-d2)in rice [59].
These receptor kinases transduce signals downstream, activating several groups of TFs. The
TFs belonging tobHLH,WRKYandMYBgroups were up-regulated, depicting their
involve-ment in regulating downstreamRgenes that biosynthesize RR metabolites and proteins. In our
study, the phenylpropanoid pathway genes, such as, agmatine coumaroyltransferase (ACT),
caffeic acid 3-o-methyltransferase (CoMT), laccase, phenylalanine ammonia-lyase (PAL),
4-coumarate CoA ligase (4CL), and cinnamyl alcohol dehydrogenase (CAD) were highly
expressed in R-RIL.PAL, a hub gene, that biosynthesizes precursor for phenylpropanoid
bio-synthetic pathway, was highly up-regulated in Sumai-3 uponF.graminearuminvasion [41].
ACTwhich is localized within wheat FHB resistant QTL-2DL imparts high rachis resistance by
cell wall thickening [60].4CLis an importantRgene for both lignin and flavonoid biosynthesis,
and was induced in cucumber against powdery mildew [61], cotton against wilt fungus
Verticil-lium dahlia[62], and potato againstPhytophthora infestans[30]. Laccase and peroxidase
(POD) involved in lignin biosynthesis were up-regulated in our study, emphasizing an
increased lignification of cell walls around infection site in R-RIL. In our study, theperoxidase
was highly expressed in RP (FPKM = 45.08). The involvement ofPODin the defense responses
of wheat toFginfection has been reported [39]. Genes involved in flavonoid biosynthesis like
chalcone synthase8 (CHS8), cinnamoyl reductase (CR) and dihydroflavonol 4-reductase
(DHFR) were detected only in R-RIL. The disruption of flavonoid pathway significantly
Septoria triticiwas due to a higher accumulation ofCHStranscripts [63]. RR proteins restrict
the spread of pathogens. In our study, we detected several PR proteins such aschitinase,
peroxi-dase, andPR1with higher expressions. Chitinases are very important in plant defense against
many fungal pathogens, as they degrade the fungal cell walls, which are primarily made up of chitin. Expression of barley class-II chitinase gene in wheat conferred high level of resistance
againstF.graminearumunder greenhouse and field conditions [64]. Expression of rice
chiti-nase enhanced resistance againstMagnaporthe griseain rice [65],Uncinula necatorin Italian
ryegrass [66], andPuccinia coronatain grapevine [67].
Mycotoxins produced byFg, such as trichothecenes, play a major role in pathogenesis,
espe-cially DON, a well-known virulence factor. Therefore, the resistance to DON is crucial to
confer enhanced FHB resistance [68]. MutantFgstrains (unable to produce DON) showed
reduced FHB severity [69]. In previous studies, it has been reported that DON is converted into less toxic DON-3-O-glucoside (D3G) [70,71]. However, several genes are involved in DON reduction in plants, such as multidrug-resistant protein, multidrug resistance-associated protein, UDP-glycosyltransferase and ABC transporters were detected with higher transcript
abundances uponFginoculation in wheat cv. Nobeokabouzu-komugi [17]. The accumulation
of glutathione S-transferase (TaGSTF5) in wheat resistant cv. Ning7840 uponFginvasion was
significantly higher [72]. Similarly, in our study we found higher expressions of ABC trans-porter b family member 4, UDP-glycosyltransferase 85a2, UDP-glycosyltransferase 74e1, pleiotropic drug resistance protein 4 and glutathione S-transferase in R-RIL upon pathogen
inoculation. Transgenic Arabidopsis and wheat expressing a barleyUDP-glucosyltransferase
(HvUGT13248) detoxifies deoxynivalenol and provides high levels of resistance toF.
grami-nearum[68,73]. ABC transporter proteins (yeastPDR5like) confined to plasma membrane
confers partial resistance against trichothecenes in wheat by serving as drug efflux pumps [74]. The higher transcript abundances of detoxification genes, clearly explain the reduced levels of DON accumulation in R-RIL, thus contributing to FHB resistance.
QTL-Fhb2 imparts resistance through additive effects of cell wall
reinforcement and DON detoxification
The markers flanking the QTL locus were sequenced and the sequence (http://wheat-urgi. versailles.inra.fr/) within the two flanking markers was retrieved and the potentialRgenes in that region were identified (Fig 4). QTL-Fhb2 was consistently mapped on chromosome 6BS, conferring high rachis resistance [23,24]. Based on high FC metabolites and transcripts, we
identified4CL,CS,bHLH041,GST,ABC4, andCADas putative candidateRgenes localized
within the QTL-Fhb2 region. Based on our study, we propose a hypothetical model for FHB resistance in wheat line carrying resistant alleles of genes in QTL-Fhb2 (Fig 6). The importance of each candidate gene in the model on plant defense is discussed.
4CL, CS and CAD confer resistance through cell wall reinforcement
4-Coumarate CoA: Ligase (4CL). We detected a higher transcript abundance (FC = 1.23)
of4CLin R-RIL. 4CL is an important enzyme that catalyzes the conversion of coumaric,
feru-lic, caffeic, and sinapic acids into hydroxycinnamoyl-CoA thiol esters, which further serve as precursors in lignin, flavonoid, polyphenol, coumarin and suberin biosynthesis [75]. Two HCCAs, N-Caffeoylputrescine (FC = 5.03) and feruloyl-2-hydroxyputrescine (FC = 3.31) were
in high abundance, showing a higher expression of4CLto biosynthesize them in R-RIL than in
S-NIL. Increased expression of4CLincreased HCCAs accumulation in potato againstP.
infes-tans, imparting resistance through thickening of cell walls [28–30,33]. Interestingly, we also
implicating the role of4CLin the biosynthesis of precursors. Silencing of4CLreduced lignin
content in switch grass [76], and poplar [77]. As4CLis a hubRgene in the phenylpropanoid
pathway leading to the biosynthesis of lignins and flavonoids, we consider this to be a potential
candidateRgene conferring high rachis resistance to FHB.
Callose synthase (CS). Plants restrict the spread of pathogens through deposition of an
RR metabolite, such as callose (β-1,3-glucan) to form cell wall appositions or papillae [78].
Papillae are complex structures formed around the invading hyphae, which are produced in-between plasma membrane and the cell wall. The papilla is composed of different classes of compounds such as, phenolics, reactive oxygen species, cell wall proteins and glucans [79]. In
our study, we also detected a higher transcript abundance ofcallose synthase. Callose synthase
5 (CalS5) inArabidopsis thalianaplays a predominant role in the synthesis of the callose wall
and callose plugs, and containment of powdery mildew hyphae in Arabidopsis [80].
Arabidop-sis thalianacallose synthasePMR4expression in barley increased penetration resistance to
powdery mildew [81]. Hence, we consider callose synthase as one of the integral candidates in FHB defense.
Cinnamyl alcohol dehydrogenase (CAD). CADis a key enzyme in lignin biosynthesis that catalyzes reduction of cinnamaldehydes into cinnamyl alcohols, the last step of monolignol biosynthesis, before oxidative polymerization in the cell wall [82]. Lignin is a complex phenolic
Fig 6. Hypothetical model for FHB resistance in wheat line carrying resistant alleles of R genes in QTL-Fhb2.Based on our findings we propose that the QTL-Fhb2 imparts high rachis resistance through combined effects of cell wall reinforcement and DON detoxification.
polymer which is deposited in the cell walls of many plants. Deposition of lignin (lignification) is known to confer resistance against invading pathogens. Lignification thickens the cell wall and makes it difficult for fungal appressoria to penetrate into the cell [83]. It also makes cell walls more water resistant, and in turn, less accessible to cell wall degrading enzymes [83]. Gene expression profiling and silencing showed monolignol biosynthesis is very important in penetration defense in wheat against powdery mildew invasion [84]. Cinnamyl alcohol dehy-drogenase-C and D play a crucial role conferring resistance in Arabidopsis against bacterial
pathogenPseudomonas syringaepv. tomato [85].AtCAD1is involved in lignification of
elon-gating stems inArabidopsis thaliana[86].CADwas upregulated in NILs containing
QTL-Fhb1, upon pathogen invasion [6].
ABC transporter and GST aiding resistance through DON reduction
ABC transporter-4 (ABC-4). DON inhibits eukaryotic protein synthesis and increases the
virulence ofF.graminearumby suppressing RR protein and metabolite biosynthesis in plants.
A wheat ABC transporter (TaABCC3.1) imparts DON tolerance [87]. ATaABCC(ABC
trans-porter C family) gene within FHB resistant QTL-2DS conferred resistance by reducing DON
accumulation [88].TaABCCgene underlying wheat resistance QTL-Fhb1 imparts FHB
resis-tance [89]. Similarly, in our study we identified higher transcript abundance of ABC trans-porter b-family member 4 and consider this to play a significant role in rachis resistance, by reducing DON for virulence.
Glutathione S-transferase (GST). GSTs play an important role in plant resistance against biotic and abiotic stresses [90]. These are dimeric enzymes that catalyze the conjugation of
elec-trophilic molecules to glutathione (GSH) [91]. DON theFusariumvirulence factor upon
con-jugation with GST is presumably detoxified, thus decreasing the pathogenicity of the fungus [27,92]. GSTs from barley are reported to detoxify DON [70]. Glutathione S-transferase genes
were induced inNicotiana benthamianauponColletotrichum destructivumandC.orbiculare
infection and a GST gene was implicated in resistance [91]. GSTs were induced in potato upon
Phytophthora infestans, wheat uponErysiphe graminisand Arabidopsis uponPeronospora
parasiticainfection [93]. The expression of GST gene fromLilium regaleconferred resistance
toFusarium oxysporumin tobacco [94]. Similarly, we presume that the GST identified in our
study, reduces the virulence of pathogen by detoxification of DON, and in turn, aid in enhanc-ing FHB resistance.
bHLH041: A novel candidate for FHB resistance. The bHLH group of transcription fac-tors shares a basic helix loop helix protein structure. The size of these transcription regulafac-tors
varies anywhere from 60–100 amino acids and consists of two highly conserved domains [95].
The N-terminal basic domain functions as a DNA-binding domain, and the second basic domain which is separated by a loop, determines the dimerization capacity of a protein [95,96]. These transcription regulators usually bind to a consensus sequence known an E-box (CANNTG) [97]. The role of bHLH transcription regulators in plant response to pathogen
attack has been well documented [96,98]. A transcription regulatorTabHLH060was highly
expressed in wheat leaves upon invasion by an obligate pathogenPuccinia striiformisf. sp.
tritici[96]. In our study, the transcription regulatorTabHLH041was detected only in RP
(FPKM = 0.42). Further functional characterization and the identification of its potential downstream targets should increase our understanding about its role in FHB defense reactions.
Our study identified several importantRgenes localized in the QTL-Fhb2. Even though this
candidate genes identified here can be used in breeding, following validation of gene resistance functions based on silencing these genes in resistant genotype. The functional alleles of these genes can be used to replace the alleles in susceptible commercial cultivars, if nonfunctional, based on genome editing.
Conclusion
FHB resistance is polygenic in nature; manyRgenes with major and/or minor effects
contrib-ute cumulatively conferring resistance. The mapped FHB resistant QTLs localize several genes governing resistance. We dissected FHB resistant QTL-Fhb2, based on integrated metabolo-transcriptomics approach and putatively identified six resistance genes. These genes confer structural resistance through cell wall reinforcement, reducing the spread of pathogen through rachis within the spike. Several other genes detoxify DON, the virulence factor, and thus reduc-ing the severity of the disease. In conclusion, we report that the wheat resistant QTL-Fhb2 con-fers high rachis resistance through combined effects of cell wall enforcement and reduction of DON. The candidate genes identified here, upon functional characterization, can pave the way to develop highly FHB resistant genotypes.
Materials and Methods
Genetic background of RILs carrying contrasting alleles of QTL-Fhb2
The recombinant inbred population of 1,440 F2:7lines were developed using single seed descent
method, through a cross between BW-278 (AC Domain2/Sumai-3 = FHB resistant parent)
and AC Foremost (HY320
5/BW553//HY320
6/7424-BW5B4 = FHB susceptible parent) [23]. The resistant parent BW-278 is a descendant of Sumai-3, a Chinese wheat cultivar that exhibits high rachis resistance and is the source of major FHB resistance QTLs. However, BW-278 is known to lack QTL-Fhb1 resistance alleles on chromosome 3BS. The RILs derived segregated for three known FHB resistance QTLs on chromosomes 3BSc, 5A (QTL-Fhb5), and 6B (QTL-Fhb2). The lines were further genotyped using simple sequence repeat (SSR) markers on chromosome 6B (WMC104, WMC397, GWM219), 5A (GWM154, GWM304, WMC415), and 3BS (WMC78, GWM566, WMC527) to select RILs homozygous susceptible for QTL intervals on 3BSc, 5A, and recombinant for the interval on 6B carrying the FHB resistance gene [23]. The seeds of FHB resistant and susceptible RILs carrying contrasting alleles of QTL-Fhb2 were obtained from Dr. Curt McCartney (AAFC, Winnipeg, MA). The highly resistant RIL = PbI-170 (carrying resistance alleles of QTL-Fhb2, R-RIL) and the highly susceptible RIL = QeJ-004 (carrying susceptible alleles of Fhb2, S-RIL) were selected for this study taking into consider-ation the phenotypic data, both greenhouse and field, provided by Dr. McCartney.
Plant and pathogen production, and inoculation
All experiments were conducted in greenhouse as a randomized complete block design, with two RILs (R-RIL and S-RIL), two inoculations (pathogen and mock as control) and three to five replications over time, depending upon the nature of the experiment. In each pot, 4 seeds were sown at 5 d intervals. Plants were grown at 25 ± 3°C, 70 ± 10% relative humidity and 16 hours of photoperiod throughout the growing period. Plants were irrigated every day and fer-tilized at 15 d intervals with 20-20-20 NPK, and the trace elements according to the growth
stage of the plants [6]. TheF.graminearum, isolate Z-3639 was initially cultured on potato
inoculations. The final concentration of spore in the suspension was adjusted to 105ml-1using
sterilized distilled water and 10μl suspension was inoculated per spikelet [20]. Plants were
inoculated at about 50% anthesis (GS = 60–65) and were covered with plastic bags for 48 hours
to maintain high humidity in order to facilitate initial infection.
Phenotyping of RILs
Disease severity analysis and fungal biomass quantification were carried out to phenotype RILs, for FHB resistance. For disease severity analysis, a single alternate pair of spikelets, in the
middle of a spike of each RIL was inoculated withF.graminearummacroconidial suspension.
The total number of spikes inoculated per replication were ten and the total number of replica-tions were five. The number of spikelets diseased were recorded every three days until 21 days post inoculation (dpi) and the proportion of spikelets diseased (PSD) and the area under dis-ease progress curve (AUDPC) was calculated. For fungal biomass quantification, three
alter-nate pairs of spikelets per spike per RIL were inoculated withFgspore suspension and distilled
water, separately. The number of spikes inoculated per replication and the number of total rep-lications were three. 7dpi, six successive pairs of spikelets (three alternate pairs inoculated and three uninoculated) were harvested; the rachis region underlying these six spikelets was col-lected. The total DNA was extracted from rachis tissues using DNeasy Plant Mini Kit (Qiagen,
Germany). The concentration of DNA was normalized to 20 ng/μl and the fungal biomass
was quantified usingF.graminearumspecificTri6as target gene and wheat specificActinas a
housekeeping gene [20]. The relative gene copy number ofTri6was calculated following
2−ΔΔCTmethod [100].
Sample collection, metabolite extraction, metabolic profiling, and data
analysis
For metabolic profiling, the experiment was conducted in a randomized complete block, with two genotypes (R-RIL and S-RIL), two inoculations (pathogen = P and mock = M) and five
replications per treatment. Three alternate pairs of spikelets of a spike were inoculated withF.
graminearumspore suspension (P) or distilled water (M). 7dpi, six successive pairs of spikelets
(three alternate pairs inoculated and three uninoculated) were harvested and the rachis region underlying these six spikelets was separately collected, ground in liquid nitrogen using pre-chilled mortar and pestle. 100 mg of tissue samples were weighed in 2 ml sterilized micro-cen-trifuge tubes and used for metabolite extraction. Metabolites were extracted using absolute methanol followed by 60% methanol in order to extract polar, semi-polar and non-polar metabolites [101]. The metabolites were analyzed using LC-ESI-LTQ-Orbitrap-MS. Randomi-zation of samples was done to avoid any structural errors associated with the liquid chromatog-raphy and high resolution mass spectrometry (LC-HRMS = LC-LTQ-Orbitrap) analysis. The output data files obtained from LC-MS analysis were first converted into mzXML/.cdf and were exported to MZmine2 software for peak deconvolution, peak detection, spectral filtering and normalization of peaks [102].
The abundance of peaks were subjected to pairedt-test (comparison of two treatments at a
time) to identify treatment significant metabolites. Treatment significant metabolites with
P<0.05 were retained for further analysis. Metabolites with higher abundance in resistant
genotype (R-RIL) than in susceptible genotype (S-RIL) were considered as resistance related (RR) metabolites. A RR metabolite based on inoculation (M) was considered as constitutive
resistance related constitutive (RRC = RM>SM) metabolite. A metabolite with significantly
higher abundance in the pathogen inoculated treatments than in mock inoculated treatments
susceptible (PRs = SP>SM) genotypes. A PRr metabolite in a resistant genotype with abun-dance greater than that in susceptible pathogen (PRs) inoculated was considered as a resistance
related induced metabolite (RRI = (RP>RM)>(SP>SM)) metabolite [6,10]. The resistance
metabolites were identified with putative compound names using different databases PlantCyc (http://www.plantcyc.org/), METabolite LINk (METLIN) (https://metlin.scripps.edu), KNAp-SAcK (http://kanaya.naist.jp/KNApKNAp-SAcK/) and Kyoto encyclopedia genes and genomes (KEGG) (http://www.genome.jp/kegg/). The putatively identified metabolites were further
confirmed based on: i) accurate mass match (with accurate mass error<5 ppm) [6,35]; ii)
fragmentation pattern match [35,38].
Sample collection, RNA extraction, library preparation, Illumina
sequencing, and data analysis
For transcriptome analysis, three alternate pairs of spikelets of three spikes per RIL were
inocu-lated withF.graminearumspore suspension and water (control). Each treatment (resistant
pathogen = RP, resistant mock = RM, susceptible pathogen = SP, susceptible mock = SM) con-sisted of three biological replicates. At 48 hpi, the three inoculated and three un-inoculated spikes were harvested, the rachis in inoculated region was harvested, and ground in liquid nitrogen using pre-chilled mortar and pestle. 100 mg of tissue samples were weighed in 2 ml sterilized micro-centrifuge tubes and the total RNA was extracted using Qiagen RNeasy Mini Kit (Qiagen, Germany). Total RNA was quantified using a NanoDrop Spectrophotometer ND-1000 (NanoDrop Technologies, Inc.) and its integrity was assessed using a 2100 Bioanalyzer (Agilent Technologies). Libraries were prepared from 250 ng of total RNA using the TruSeq stranded mRNA sample preparation kit (http://www.illumina.com/products/truseq_stranded_ mrna_sample_prep_kit.html), as per the manufacturer’s recommendation. Using the Poly-A selection, mRNA molecules were separated and fragmented, followed by cDNA synthesis, ligation of adapters and cDNA fragments enrichment (PCR) (http://www.illumina.com/ applications/sequencing/rna/mrna-seq.html). Libraries were quantified using the Quant-iT™
PicoGreen1
dsDNA Assay Kit (Life Technologies) and the Kapa Illumina GA with Revised Primers-SYBR Fast Universal kit (D-Mark). Average size fragment was determined using a 2100 Bioanalyzer (Agilent Technologies). Libraries were sequenced with an Illumina Hiseq 2000 sequencer, with 100 bp paired-end reads (http://support.illumina.com/sequencing/ sequencing_instruments/hiseq_2000.html). The Illumina Hiseq paired end raw reads were quality checked using FastQC. The raw reads were processed using ABLT in-house program to filter adapters and low quality bases towards 3'-end. The raw reads obtained were aligned to the reference genome using TopHat [103]. Cufflinks package was used to assemble transcript, estimates their abundances, and tests for differential expression and regulation [104]. The Cuff-diff program in Cufflinks was used to identify Cuff-differentially expressed transcripts. The
tran-scripts that were not aligned to reference genome were assembled usingde novoassembly [39].
down-regulated or neutrally in other, or may be not significant atP<0.01, so are not detected in the contrasting genotype in RNA-seq data.
Bioinformatics annotation and methods
The transcripts were annotated using Blast2go program against several databases such as non-redundant protein database, Swiss-Prot, KEGG, etc. for annotation and GO functional
classifi-cation [39]. The transcripts withP<0.01 and log2FC1 were further retained. All the
transcripts that were set to threshold ofP<0.01 were crosschecked with the preliminary
anno-tation for all treatments. Pathway analysis was done by using KAAS (http://www.genome.jp/ tools/kaas/).Arabidopsis thaliana(thale cress) andOryza sativa japonica(Japanese rice) (RefSeq) were taken as reference. The transcription factors (TFs) were predicted by PlantTFDB webserver [105]. We used the threshold determination as set by the server and the established criteria to identify the candidate, which were considered for predicted TFs and the binding sites. Furthermore, the predictions were used for interpreting the GO annotations.
Expression analysis using quantitative Real-Time PCR (qRT-PCR)
The RNA extracted for transcriptome analysis (RNA-seq) was used for cDNA synthesis. The first strand was synthesized using Affinity Script qPCR cDNA Synthesis Kit (Agilent
Technolo-gies, Canada). The qRT-PCR was performed in a reaction volume of 10μl consisting of 25 ng
cDNA, 2 pmole of each primer, Qi-SYBR Green supermix (BioRad, Canada). The reactions
were carried out in CF”X384TM Real-Time system (BioRad, ON, Canada). The relative
tran-script abundance in pathogen treated treatments compared to water (control) treatments were
analyzed using 2−ΔΔCT(CT= cycle threshold) [100]. The transcripts, only those were expressed
in pathogen treated treatments; RP>SP were analyzed. The relative transcript abundance was
represented as FC values; whereas, in RNA-seq data the values are presented as log2FC. The primers used for qRT-PCR analysis were designed using NCBI primer blast software (S4 Table) [106].
Supporting Information
S1 Fig. Gene ontology classification of high fold change transcripts detected in R-RIL and S-RIL uponF.graminearuminoculation at 48 hpi.
(TIF)
S1 Table. High fold change RRI and RRC metabolites detected and putatively identified in rachis tissues of wheat RIL carrying resistant alleles of QTL-Fhb2 followingF. grami-nearumand mock inoculation.
(XLSX)
S2 Table. The transcripts with higher expression values in R-RIL and S-RIL followingF.
graminearumand mock inoculation at 48 hpi. (XLSX)
S3 Table. The list of all the genes localized within the QTL-Fhb2 region based on the avail-able survey sequence availavail-able.The genes within two markers GWM-133 and GWM-644 flanking the QTL-Fhb2 region were taken into account. The list of genes with gene ID, chro-mosome localization and gene ontology is given.
(DOCX)
Acknowledgments
The authors would like to thank the Ministere de l’Agriculture, des Pecheries et de l’
Alimenta-tion du Quebec (MAPAQ), Quebec, Canada for providing grants for the project. DD thanks The Indian Council of Agricultural Research (ICAR), New Delhi for ICAR-International Fel-lowship, and Innovagrains and McGill University for financial assistance towards his graduate study. He also would like to thank Dr. Prashanth Suravajhala for his timely guidance towards bioinformatics analysis.
Author Contributions
Conceived and designed the experiments: AK DD. Performed the experiments: DD. Analyzed the data: DD SK. Contributed reagents/materials/analysis tools: AK CM. Wrote the paper: DD. Edited the manuscript: AK.
References
1. Ding L, Xu H, Yi H, Yang L, Kong Z, Zhang L, et al. Resistance to hemi-biotrophicF.graminearum
infection is associated with coordinated and ordered expression of diverse defense signaling path-ways. PloS One. 2011; 6(4):e19008. doi:10.1371/journal.pone.0019008PMID:21533105
2. Martin J. Role of cuticle in the defense against plant disease. Annual Review of Phytopathology. 1964; 2(1):81–100.
3. Didi V, Jackson P, Hejátko J. Hormonal regulation of secondary cell wall formation. Journal of Experi-mental Botany. 2015; 66:5015–27. doi:10.1093/jxb/erv222PMID:26002972
4. González-Lamothe R, Mitchell G, Gattuso M, Diarra MS, Malouin F, Bouarab K. Plant antimicrobial agents and their effects on plant and human pathogens. International Journal of Molecular Sciences. 2009; 10(8):3400–19. doi:10.3390/ijms10083400PMID:20111686
5. Balmer D, Flors V, Glauser G, Mauch-Mani B. Metabolomics of cereals under biotic stress: current knowledge and techniques. Frontiers in Plant Science. 2013; 4:doi:10.3389/fpls.2013.00082
6. Gunnaiah R, Kushalappa AC, Duggavathi R, Fox S, Somers DJ. Integrated metabolo-proteomic approach to decipher the mechanisms by which wheat QTL (Fhb1) contributes to resistance against
Fusarium graminearum. PloS One. 2012; 7(7):e40695. doi:10.1371/journal.pone.0040695PMID: 22866179
7. Ahuja I, Kissen R, Bones AM. Phytoalexins in defense against pathogens. Trends in Plant Science. 2012; 17(2):73–90. doi:10.1016/j.tplants.2011.11.002PMID:22209038
8. Sudisha J, Sharathchandra R, Amruthesh K, Kumar A, Shetty HS. Pathogenesis related proteins in plant defense response. Plant Defence: Biological Control. 2012:379–403.
9. Boyd LA, Ridout C, O'Sullivan DM, Leach JE, Leung H. Plant–pathogen interactions: disease
resis-tance in modern agriculture. Trends in Genetics. 2013; 29(4):233–40. doi:10.1016/j.tig.2012.10.011
PMID:23153595
10. St. Clair DA. Quantitative disease resistance and quantitative resistance loci in breeding. Annual review of phytopathology. 2010; 48:247–68. doi:10.1146/annurev-phyto-080508-081904PMID:
19400646
11. Poland JA, Balint-Kurti PJ, Wisser RJ, Pratt RC, Nelson RJ. Shades of gray: the world of quantitative disease resistance. Trends in Plant Science. 2009; 14(1):21–9. doi:10.1016/j.tplants.2008.10.006
PMID:19062327
12. Kushalappa AC, Kalenahalli YN, Karre S. Plant innate immune response: Qualitative and Quantitative resistance. Critical Reviews in Plant Sciences. 2016 doi:10.1080/07352689.2016.1148980
13. Kushalappa AC, Gunnaiah R. Metabolo-proteomics to discover plant biotic stress resistance genes. Trends in Plant Science. 2013; 18(9):522–31. doi:10.1016/j.tplants.2013.05.002PMID:23790252 14. Holme IB, Wendt T, Holm PB. Intragenesis and cisgenesis as alternatives to transgenic crop
develop-ment. Plant Biotechnology Journal. 2013; 11(4):395–407. doi:10.1111/pbi.12055PMID:23421562 15. Bai G, Shaner G. Management and resistance in wheat and barley to Fusarium head blight. Annual
Review of Phytopathology. 2004; 42:135–61. PMID:15283663