ISSN 1941-7020
© 2010 Science Publications
Corresponding Author: Taher Abu-Lebdeh, Department of Civil, Architectural and Environmental Engineering, North Carolina A and T State University, 1601 E. Market Street Greensboro, NC 27411 Tel: (336) 334-7575/Ext 664 Fax: (336) 334-7126
Pullout Characterizations of Various Steel Fibers Embedded in
Very High-Strength Concrete
1
Sameer Hamoush,
1Taher Abu-Lebdeh,
2Toney Cummins and
3Brian Zornig
1
Department of Civil, Architectural and Environmental Engineering,
North Carolina A and T State University, 1601 E. Market Street, Greensboro, NC 27411
2
US Army Corps of Engineers, Concrete and Materials Division, Vicksburg, MS 39183
3
Manhattan Construction Company, 2120 Montrose, Houston, TX 77006
Abstract: Problem statement: There is a real need for a fundamental understanding of bond and bond mechanisms in the newly developed Very-High-Strength-Concrete (VHSC) materials. The interfacial steel fiber/VHSC matrix bond tests are needed to characterize VHSC and to aid in the development of analytical models that describe bond behavior of this new material. Approach: This research investigated bond-slip characteristics of four different steel fiber types embedded in Very-High-Strength-Concrete (VHSC). Parameters investigated include: Mechanical affect of the fiber geometry, fiber embedment length, medium strength and embedment method. Results were measured in terms of peak pullout load and total pullout work or dissipated bond energy. Results: Results indicated that the mechanical affect of fiber geometry had the most influence on both peak load and total work with increases over 100% for some fibers. The increase in embedment length also increased both peak load and total pullout work but was found to have more influence on smooth, undeformed fibers.
Conclusion/Recommendations: Findings of this research should aid in the rational predictions of VHSC’s mechanical performance and help identify the effectiveness of different types of steel fibers on improving its tensile properties and toughness. It is recommended that an analytical model should also be developed to analyze the interfacial debonding process of VHSC composites.
Key words: VHSC, fibers-matrix bond, single-fiber test, pullout energy, mechanical properties
INTRODUCTION
Advancements in research and development of cementitous materials have resulted in concrete material with compressive strengths of 29,000 psi (200 MPa) or greater (O’Neil et al., 1999; 2006). Very-High-Strength Concrete (VHSC) is high density concrete made from the same general components as normal concrete; however, by carefully selecting and mixing the components, significant improvements in compressive and tensile strengths can be achieved. Further, the addition of steel fibers can improve the tensile characteristics of such material and increases both first-crack and peak loads, as well as the flexural toughness. The effectiveness of a given fiber as a medium of stress transfer is a function of several factors: Fiber/matrix interfacial bond, fiber length, orientation and the mechanical component such as hooked, flattened end or smooth. Studies on fibers’ interaction with the cementitous matrix (Naaman and Najm, 1991) have
silica fume on the bond characteristics of steel fiber in matrix of Reactive Powder Concrete (RPC). Their results indicated that the incorporation of silica fume in RCP matrix greatly enhanced the fiber-matrix bond. They found that the optimal silica fume/cement ratio was in the range of 20-30%. At this ratio, the bond strength and the fiber pullout energy was the greatest of all tested specimens.
Although fiber-matrix interfacial research has been a popular topic for many years, Very High Strength Concrete (VHSC) has been developed recently and has not yet been fully characterized. In this research, a series of single-fiber pullout tests were performed using VHSC as the medium from which the fibers were pulled. Several different parameters were investigated in the experimental program including embedment length, fiber type and geometry (smooth, hooked, flat end and helical) and fibers’ embedment method. Pullout load-slip curves, peak loads and pullout work (or dissipated bond energy) were evaluated for each of the parameters.
MATERIALS AND METHODS
Materials: Four different types of steel fibers, namely Dramix 80/30 high carbon fiber, Dramix ZP 305 low carbon fiber, Fibercon flat end fiber and Polytorx fiber were used in this investigation. Types and properties of these fibers are listed in Table 1. It should be mentioned that the smooth fibers were prepared by clipping off the end of the hooked and flattened end fibers. This allowed for a comparison of the same fiber with and without the deformation. The cementious matrix was Very High Strength Concrete (VHSC) developed by the US Army Corps of Engineer’s. The materials used in VHSC mix include sand, cement, silica flour, silica fume, high range water reducing admixture and water. The mix proportions are listed in Table 2.
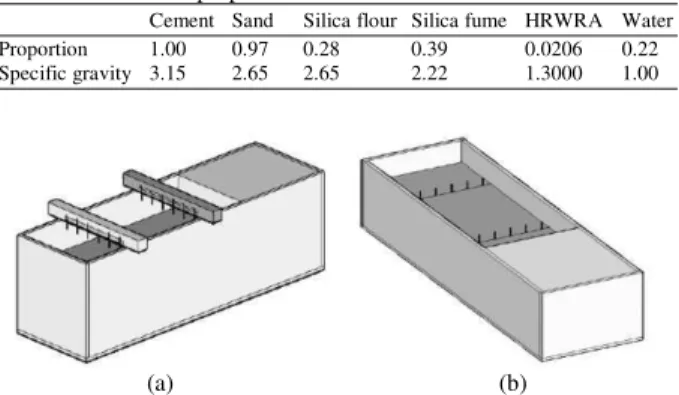
Specimen preparation: Thirty-eight specimens were prepared to conduct the single fiber pullout tests. The dimension of each specimen (Fig. 1) was 7×6×2 inch and consisted of 6 embedded fibers centered in the 7 inch direction. These dimensions allowed for secure attachment to accommodate the pullout test and adequate spacing to avoid influence area effects. A 21×6×6 inch
steel mold was used to form the specimens. Polystyrene blocks are placed at the side and the bottom of the mold producing 14×6×2 inch specimens (Fig. 2). Two different methods were used to embed the fibers in the matrix. The first method: placed the fibers in the freshly poured matrix using a stake with the fiber’s embedment length protruding from the stakes edge (Fig. 2a). The second method: cast the fibers by temporarily securing the fibers in-between pieces of polystyrene with the embedment length protruding up and pouring the matrix on top of the fibers (Fig. 2b). All fibers were aligned perpendicular to the casting direction.
Specimens were prepared as follows: The
components of the VHSC mixture were dry-mixed at a low rate for ten minutes, then the water/HRWRA was slowly added to the mix and the mixing rate was increased and observed for several minutes. Each batch was quantified to produce two pullout specimens and three 2 inch cubes for compression testing. The pullout specimens along with the 2 inch cubes were vibrated during casting. After casting and adequately vibrating, the specimens were covered with wet burlap for 36 h. Then, removed from their molds and the 14 inch long pullout specimens were cut with water cooled concrete saw to produce two 7 inch long specimens.
Fig. 1: Specimen dimensions (1 inch = 25.4 mm)
Table 1: Types and properties of the steel fibers
Mechanical Tensile strength
Fiber profile Fiber type deformation Length (inch) Cross section area (inch2) Coating (ksi)
Dramix ZP 305 Hooked-end 1- 3/16 0.00038 None 160.8
Flat End Flattened-end 1-15/16 0.00167 None 161.0
Polytorx Helix 1 0.00030 Zinc 250.5
Dramix 80/30 Hooked-end 1- 3/16 0.00018 Brass 303.7
Table 2: VHSC mix proportions
Cement Sand Silica flour Silica fume HRWRA Water Proportion 1.00 0.97 0.28 0.39 0.0206 0.22 Specific gravity 3.15 2.65 2.65 2.22 1.3000 1.00
(a) (b)
Fig. 2: Mold for placed and cast fibers (concrete not shown) (a) placed fibers (b) cast fibers
Fig. 3: Photograph of pullout test in progress
The specimens were then placed in a lime saturated water curing tank for 7 days at room temperature. After the 7 days curing, VHSC specimens and cubes were placed in a water filled tank which was placed in an oven set at90°C for 4 days (oven-wet curing). After 4 days, they were removed from the filled tank and returned to the oven at 90°C for an additional 2 days (oven-dry curing). On the other hand, the standard grout pullout specimens and cubes were removed from the plastic bags 24 h after casting and placed in the lime saturated water tank for 7 days.
Test setup and testing procedures: The pullout tests were carried out using MTS 858 Bionix II testing machine with a 2.2 kip load cell at frequency of 10 HZ for pullout rate of 0.05 inch min−1 (0.021 mm sec−1). Pullout specimen was secured to the platen by clamps consisting of angle iron, through-rod and wing nuts (Fig. 3) and the fibers were carefully centered in-between the grip faces. Each fiber was griped by extending the hydraulic actuator to the maximum extension possible without touching the pullout
specimen. Figure 3 illustrates a pullout test in progress, where the upward movement of the actuator applies a pullout force on the free end of the fiber. The values of load and the corresponding movement of the actuator (referred to as displacement throughout this paper) were recorded using MTS Testworks 4.0 software. A displacement correction was applied to the data produced by the MTS software. This correction is due to the fact that the free-end of the fibers undergoes elastic longitudinal deformation as the pullout load is applied. This deformation was calculated for each recorded load value and subtracted from the corresponding displacement. The deformation was calculated with the equation:
PL EA δ =
Where:
δ = Elongation of the free end of the fiber P = Pullout load
L = Length of the of the fiber between the edge of the grip and the concrete interface
A = Cross sectional area of the fiber
E = Modulus of elasticity of the fiber material
The Pull-out work (dissipated bond energy) is calculated as the area under the load-displacement curve. Moreover, concrete compressive strength was calculated by dividing the average load by the cross sectional area of the 2 inch cube and applying a shape factor of 0.90.
RESULTS
(a)
(b)
Fig. 4: (a) Typical pullout curve series and (b) curve average
Fig. 5: Load-displacement curves for smooth Z, D and F fibers embedded in standard grout
Pullout behaviors of smooth fibers embedded in normal and VHSC are shown in Fig. 5 and 6, respectively. Smooth fibers that were pulled out of the standard grout (Fig. 5) have a distinguishable drop after the peak. This indicates that the bond between the grout and the fiber offers substantial resistance to pullout compared to the frictional resistance occurs after complete debonding.
Fig. 6: Load-displacement curves for smooth Z, D and F fibers in VHSC
(a)
(b)
Fig. 7: Load-displacement for hooked and smooth D fibers in (a) VHSC and (b) standard groutwith 0.5 inch embedment depth
Table 3: Effect of mechanical and fiber types (All embedment depths are 0.5 inch)
Specimen Deformation Medium f’c (psi) Peak loadP (lb) peak (inch) Wpeak (lb-inch) Wtotal (lb-inch)
ZP 305 Hooked VHSC 25827 61.21 0.0181 0.776 11.29
ZP 305 Hooked Grout 6160 38.76 0.0504 1.530 6.95
ZP 305 Smooth VHSC 22703 31.65 0.0877 2.094 8.54
ZP 305 Smooth Grout 6159 14.88 0.0105 0.091 2.93
Dramix 80/30 Smooth Grout 7827 18.08 0.3024 4.050 4.85
Dramix 80/30 Smooth VHSC 23051 21.13 0.0067 0.080 4.01
Dramix 80/30 Hooked VHSC 24964 54.42 0.0258 0.950 9.84
Dramix 80/30 Hooked Grout 7827 33.92 0.0406 0.923 5.51
Fibercon Smooth VHSC 24397 135.67 0.0932 9.600 39.68
Fibercon Smooth Grout 7827 37.40 0.0215 0.513 7.55
Fibercon Flat end VHSC 21249 252.10 0.0769 15.870 32.17
Fibercon Flat end Grout 7827 76.79 0.1589 9.930 12.58
(1 inch = 25.4 mm; 1 lb = 4.448 N; 1 psi = 0.00689 MPa; 1 lb-inch = 0.113 N-m)
Fig. 8: Load-displacement curve series for hooked Z fibers that ruptured during pullout in VHSC with 0.5 inch embedment depth
Effect of mechanical and fiber type: Pullout results of different types and deformations of fibers are tabulated in Table 3. The hook end of the Dramix 80/30 (D) fiber substantially increases the peak load and total pullout work in both VHSC and grout matrixes. As illustrated in Fig. 7, VHSC/hooked D fibers’ peak load and pullout work is approximately 2.5 times the corresponding values of the smooth fibers. On the other hand, the grout/hooked D fibers’ peak load is 1.87 times that of the smooth fibers but the pullout work is only 6% greater. Further, Fig. 8 illustrates a pullout series for the hooked Z fibers in which several fibers ruptured. Two of the fibers shown in Fig. 8 ruptured internally at the base of the hook, while the other two fibers ruptured at the fiber/concrete interface. For the Flat end F fiber and in comparison with the smooth F-fiber, the flattened end deformation increases the peak load in both the VHSC and grout matrixes, however, due to fiber rupture, the pullout work decreased in the VHSC matrixes. All of the F fibers that were pulled from VHSC matrixes with an embedment depth of 0.5 inches or greater internally broke at the embedded flattened end. Also, it was observed that the F fibers
pulled out of the grout were significantly worn down, almost matching the diameter of the body of the fiber.
(a)
(b)
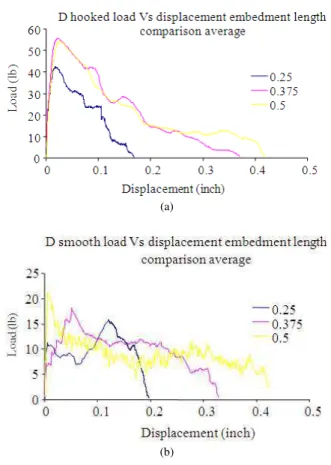
Fig. 9: Effect of embedment depths in (a) hooked and (b) smooth D fibers embedded in VHSC
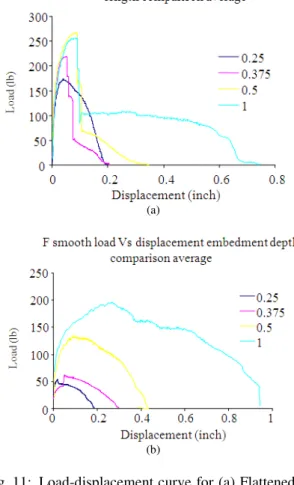
In case of the hooked ZP 305 (Z) fibers, both pullout work and peak load very with embedment lengths. The pullout behaviors of this fiber, (Fig. 10a) are consistent. Both demonstrate a load increase after the initial drop which is believed to be caused by the hook maneuvering through the curved portion of the tunnel. For the smooth Z-fibers (Table 4 and Fig. 10b), the peak load and pullout work increases 13.4 and 58%, respectively as embedment length increases from 0.25-0.375 inch. A 4 and 51% increase was obtained when embedment length increases from 0.375-0.5 inch. Both displacement and pullout work at peak load also increase as the embedment length increases. The pullout behavior of all three ZP 305 smooth fibers with different embedment lengths appears to be relatively similar (Fig. 10b). That is after the initial incline, there is a step drop followed by a gradual decline then a second steep drop. The Flat end (F) fibers, tested in this investigation were 2 inches long which allowed for an additional embedment length of 1 inch to be tested. All flattened end F-fibers, with the exception of the fiber with an embedment depth of 0.25 inch, internally ruptured.
(a)
(b)
Fig. 10: Load-displacement averages for (a) Hooked and (b) Smooth Z fibers embedded in VHSC with varying embedment depths
Table 4: Embedment length effect-results summary (All embedded in VHSC)
Specimen Deformation Embed. length (inch) f’c (psi) Peak load P (lb) peak (inch) Wpeak (lb-inch) Wtotal (lb-inch)
Dramix 80/30 Hooked 0.500 24964 54.42 0.0258 0.950 9.84
Dramix 80/30 Hooked 0.375 24964 55.70 0.0221 0.865 9.54
Dramix 80/30 Hooked 0.250 25828 42.28 0.0182 0.532 3.78
Dramix 80/30 Smooth 0.500 23051 21.13 0.0067 0.080 4.01
Dramix 80/30 Smooth 0.375 28408 18.22 0.0512 0.560 3.34
Dramix 80/30 Smooth 0.250 22853 15.77 0.1204 1.170 1.94
ZP 305 Hooked 0.250 23892 53.69 0.1054 4.260 4.52
ZP 305 Hooked 0.375 23892 60.51 0.0203 0.876 10.16
ZP 305 Smooth 0.500 22703 31.65 0.0877 2.094 8.54
ZP 305 Smooth 0.375 25100 30.41 0.0174 0.400 5.66
ZP 305 Smooth 0.250 22804 26.80 0.0094 0.183 3.58
Fibercon Flat End 1.000 22804 255.19 0.0811 15.850 76.77
Fibercon Flat End 0.500 22123 267.38 0.0868 18.550 24.88
Fibercon Flat End 0.250 23474 172.71 0.0414 5.560 21.81
Fibercon Flat End 0.375 23474 218.80 0.0510 8.420 13.90
Fibercon Smooth 1.000 19283 195.89 0.2714 43.040 127.48
Fibercon Smooth 0.500 24397 135.67 0.0932 9.600 39.68
Fibercon Smooth 0.375 27697 061.03 0.0503 1.820 22.56
Fibercon Smooth 0.250 27697 054.54 0.0185 0.800 6.44
Polytorx Helical 0.500 22330 082.93 0.0290 2.010 8.66
Polytorx Helical 0.375 23534 077.12 0.0211 1.190 1.70
Polytorx Helical 0.250 24059 066.01 0.0187 0.850 1.27
(1 inch = 25.4 mm; 1 lb = 4.448 N; 1 psi = 0.00689 MPa; 1 lb-inch = 0.113 N-m)
(a)
(b)
Fig. 11: Load-displacement curve for (a) Flattened end and (b) Smooth F fibers embedded in VHSC with varying embedment depths
Fig. 12: Effect of the embedment method on hooked Dramix fibers pulled out from VHSC matrixes
Effect of embedment method: Twenty-four pullout tests were carried out on hooked Dramix 80/30 fibers embedded at 0.5 inch in VHSC matrixes, using two different embedment methods (placed or cast). The results shown in Fig. 12 indicate that there is no relationship between the fibers’ placement method and peak load or total pullout work.
DISCUSSION
Pre-peak and post-peak behavior: in general, the initial slopes of both deformed and smooth fibers pulled from VHSC are significantly steeper than those pulled from the standard grout. The initial slopes of the deformed F, D and Z fibers pulled from VHSC are respectively 248, 32 and 148% steeper than the corresponding slopes when the grout matrix is used. Also, the initial slope of the smooth F, D and Z fibers pulled from VHSC are respectively 35, 29 and 13% steeper than the initial slopes of the same fibers pulled from the grout. However, the initial slopes of the different smooth fibers are slightly different. For instance, the slope of the smooth Fibercon (F) fiber is slightly steeper than the smooth ZP 305 (Z) and Dramix 80/30 (D) fibers. This may be due to the significantly larger contact area caused by the larger diameter of the Fibercon (F) fiber. Further, it was noticed that when the deformed flat end fiber pullout from the grout, it held its peak load for an extended displacement. This appears to be the result of the flattened end cutting through the grout until the flattened end was worn smooth. While being pulled from the VHSC matrix, the internal flattened end broke, hence the sharp drop in load.
The post peak behavior of the deformed ZP 305 (ZH) and Dramix 80/30 (DH) fibers is similar for both the grout and VHSC mediums. The decline after the peak is not sharp but it is distinguishable and consistent. However, the post-peak portion of the smooth D fiber (Fig. 5) exhibits an increase in load after the initial incline. This inconsistent behavior may be caused by damage or decay of the tunnel formed by the debonded fiber and the constantly decreasing embedment length. The post-peak frictional resistance deteriorates and decreases as the slip increases. Alwan et al. (1991) reason this phenomenon to the crumbling of the cement matrix in the fiber duct as the fiber is being pulled out. They concluded that the crumbled particles provide a roller effect between the fiber and its duct, leading to decrease in frictional stress.
Effect of mechanical and fiber type: Both the smooth and hooked Dramix (D) fibers pulled out with similar
displacement suggesting no major differences regarding the tunnel damage. The deformed fiber end must either conform and bend as it travels through the tunnel or rip and tear the surrounding matrix or rupture. Moreover, as shown in Fig. 7, the pullout curve line of the hooked D fiber is fairly smooth indicating that the fiber traveled through the tunnel and did not significantly rip or tear the matrix while bending around the curves of the tunnel. Compared to smooth fiber, the hooked ZP 305 (ZH) fiber also increases both the peak load and total pullout work in both the VHSC and grout matrixes; however, several fibers were ruptured during testing. In case of the Flat end F fiber, the total pullout displacement was well short of the 0.5 inch embedment length which indicates significant tunnel damage. In contrast to VHSC, the grout/fiber behaved very consistently after clearly debonding, while the VHSC/fiber appeared to increase load after debonding.
out without rupture. The reason that the flattened end fiber ruptures at greater embedment length is uncertain. However, the fiber’s end is worn down to the same diameter as the base of the fiber after it’s pulled out. For the smooth F fibers, it was noticed that, although, the displacement between the 1 and 0.5 inch embedment lengths is twice that of the displacement between 0.375 and 0.5 embedment lengths, the percentage increase in peak loads is far greater which suggests that peak load is not linearly related to embedment length.
Effect of embedment method: Pullout test results indicate that the embedment method (placed or cast) has no effect on the pullout behavior. However, the cast method is preferred because the fibers are protected in the initial stages of curing and the embedment length accuracy is easier to achieve.
CONCLUSION
The following observations and conclusions can be drawn:
• Of all the parameters studied in this investigation, the mechanical effect of the deformed fibers proved to have the most influence on pullout work and peak loads. The deformation of the fibers significantly increases both peak load and work
• Comparing VHSC to standard grout, the enhancement in total pullout energy is more significant than that in peak load. The difference can be attributed to the contributions of the cementitious material to the frictional resistance during the fiber pullout process
• The initial portion of the load displacement curve is linear up to the bond strength of the interface (Ppeak). However, beyond the peak load, frictional resistance starts to deteriorate and decrease as the slip between the fiber and the matrix increases. This may be due to the crumbling of the cement matrix in the fiber duct during the fiber pullout process
• The total pullout energy for deformed and smooth fibers with 1 inch (25.4 mm) embedded length was significantly higher than that at other embedded lengths. The significance increase in total energy comparing to deboning energy emphasizes the importance of the frictional portion of the pullout work in the toughness and energy absorption capability of fiber reinforced VHSC composites
ACKNOWLEDGMENT
The researchers would like to graciously thank the US Army Corps of Engineers (ERDC) Survivability Engineering Branch Grant (project 210072) for funding and material supplies of this research.
REFERENCES
Alwan, J.M., A.E. Naaman and W. Hansen, 1991. Pull-out work of steel fibers from cementitious composites: Analytical investigation. Cem. Conc. Compos., 13: 247-255. DOI: 10.1016/0958-9465(91)90030-L
Chan, Y. and S. Chu, 2004. Effect of silica fume on steel fiber bond characteristics in reactive powder concrete. Cem. Conc. Res., 34: 1167-1172. DOI: 10.1016/j.cemconres.2003.12.023
Naaman, A. and H. Najm, 1991. Bond-slip mechanisms of steel fibers in concrete. ACI Mater. J., 88: 135-145.
http://www.concrete.org/PUBS/JOURNALS/OLJ Details.asp?Home=MJ&ID=1896
O’Neil, E.F., B.D. Neeley and J.D. Cargile, 1999. Tensile properties of very-high-strength concrete for penetration-resistant structures. Shock Vibrat.,
6: 237-245.
http://iospress.metapress.com/content/yqqaxaxegd0 pcf4g/?p=6f8d205dd0194fb285c6c3b8f733f6fe O’Neil, E.F., T.K. Cummins and B.P. Durst, 2006.
Development of very-strength and high-performance concrete materials for improvement of barriers against blast and projectile penetration. Proceeding of the 24th US Army Science Conference, Transformational Science and Technology for the Current and Future Force, Orlando, Florida, pp: 203-210. DOI: 10.1142/9789812772572