SAGE Open
July-September 2016: 1 –9 © The Author(s) 2016 DOI: 10.1177/2158244016670198 sgo.sagepub.com
Creative Commons CC-BY: This article is distributed under the terms of the Creative Commons Attribution 3.0 License (http://www.creativecommons.org/licenses/by/3.0/) which permits any use, reproduction and distribution of
the work without further permission provided the original work is attributed as specified on the SAGE and Open Access pages (https://us.sagepub.com/en-us/nam/open-access-at-sage).
Article
An Approach to the Information and
Communication Technologies (ICT)
Services Industry
The ICT service industry encompasses both telecommunica-tion services (NACE 64) and software services (NACE 72) being characterized for high and intensive use of knowledge and technology, what makes that some authors such as Miles et al. (1995) refer to them as knowledge-intensive business sectors, sharing this classification with other specialized ser-vices sectors such as engineering, business consultancy, and research and development (R&D) services.
Businesses in the ICT services industries face a high com-petitive environment, because ICT industry is characterized by high rates of technological change and innovation, and new value chain and business models. At the same time, ICT industry is extremely globalized and dynamic and is highly concentrated in specific areas (García Manjón, 2008). According to Organisation for Economic Co-Operation and Development (OECD; 2015), the ICT sector is characterized by continued high R&D expenditures and a large number of ICT-related patents which reflect the key role of the ICT sec-tor in innovation activities, resulting in an R&D business expenditure accounting for almost 0.5% of GDP. Working in such a highly demanding environment represents a challenge for all ICT businesses, especially SMEs.
Being aware of the aforementioned, we consider innova-tion as a key issue for business strategy, because it is expected that it triggers competitiveness and firm performance. Thus, scientific literature postulates that innovation represents a significant factor in determining firm’s success (Pratali, 2003; Ramadani, Gërguri, Rexhepi, & Abduli, 2013; Tse, Esposito, & Soufani, 2016) while others (Wilkinson & Thomas, 2014) alert that firms that do not innovate face underperformance or dissolution.
García-Manjón and Romero-Merino (2012) stated that “given the greater knowledge-intensity presented by these sec-tors in comparison with nontechnological or medium-tech sectors, it is reasonable to expect strong correlations between R&D (knowledge creation) and firm growth.” (p. 1085) Chan, Martin, and Kensinger (1990) and Zantout and Tsetsekos (1994) found a positive market response to increased R&D investment for high-tech industry firms, while the relation-ship turns out to be negative for low-tech industry firms. Accordingly, there are many authors who posit a positive
1
Universidad Europea Miguel de Cervantes, Valladolid, Spain
2
Universidad Internacional de la Rioja, Spain
3
Universidad de Alcalá, Alcalá de Henares, Spain
Corresponding Author:
Judith Redoli, Universidad de Alcalá, Alcalá de Henares, Madrid, Spain. Email: [email protected]
Accelerating Innovation in Small and
Medium-Sized Enterprises in the ICT
Services Sector
Juan Vicente García Manjón
1, Rafael Mompó
2,
and Judith Redoli
3Abstract
This work is aimed at establishing key organizational strategies that push small and medium-sized enterprises (SMEs) in the information and communication technologies (ICT) services sector to be more innovative. Following an input and output approach, a theoretical model is built that helps determine such key factors. Then the model is validated with fieldwork carried out on a representative sample in Castile-Leon region (Spain). According to this model, the decision to innovate (and the trigger for research and development [R&D] activities in SMEs in the ICT services sector) is the result of needs that are presented by customers (public or private sector) in tailored projects. All the same, the factors leading to innovation are in order of importance, the technological level of the company, the effort made by the company in R&D, and finally, systems of incentives.
Keywords
2011; Subramanian & Nilakanta, 1996). Price et al. (2013) noted that “firms that engage in developing innovative prod-ucts and services are positioned to compete more successfully through the development of new products and processes, before competitors in first-mover advantage, increasing mar-ket share, return on investment (ROI), and overall firm suc-cess” (p. 1). Finally, Coad and Rao (2008) also studied the effects of innovation on firm growth in high-tech sectors (including computers and office equipment, electronics, medi-cal instruments, and drugs); their results vary within the differ-ent sectors analyzed, but they generally find that growth is related to innovativeness for most firms.
Innovation Patterns in Intensive
Knowledge and Tech SMEs
ICT service industries show two singular characteristics; on one hand, they belong to the service sector; on the other hand, they are technology and knowledge based sectors. So, it is expected that the innovation patterns in these sectors vary from other industrial or low-tech sectors. For instance, some authors report significant differences between the effect of R&D investment in the manufacturing sector, which contributes more positively to firm market value than in the service sector (Ehie & Olibe, 2010). Another difference between innovation in industrial and service sectors is the proper definition of innovation. Thus, it is worth posing a definition of service innovation as “an offering not previ-ously available to a firm’s customers resulting from the addi-tion of a service offering or changes in the service concept that allow for the service offering to be made available” (Menor, Tatikonda, & Sampson, 2002, p. 138).
Following with the description of service innovation, we can lean on the taxonomy of innovation (Pavitt, 1984) who distinguished among scale intensive, supplier dominated, specialized equipment suppliers and science-based firms. The latter category (science-based firms) is the one that better defines ICT service industries. The author stated that the main sources of technology for science-based firms are the R&D activities of firms while they appropriate their innovating leads through a mix of methods (i.e., patents, secrecy, natural technical lags, and firm-specific skills). It is also worth citing Den Hertog (2000), who studied the special features of inno-vation in services, proposing five types: supplier dominated innovation, innovation in services, client-led innovation, innovation through services, and paradigmatic innovation. The author affirmed that software firms, for instance, have to adapt their activities to new products from hardware compa-nies and it involves near continual updating and expansion of software to exploit the facilities of new equipment. At the same time, ICT is an important input for innovation in other sectors, because the implementation of ICT-based solutions is an innovation process or product itself. It is likely that
More specifically, De Jong, Bruins, Dolfsma, and Meijgaard (2003) studied the innovation in specialized ser-vice sectors. The authors found out that innovation is heavily dependent on the knowledge and skills of coworkers, being the innovative activities of the service firms themselves the main source of innovation, oriented to fit the specific cus-tomer needs and developing this work in close interaction with clients. Besides, these firms operate in a business-to-business environment, having only a few customers with relatively long client contact times, making considerable adjustments in their services to meet customer needs.
However, some authors, such as Miles (2008), indicated that some service organizations behave very much like high-technology manufacturing, being this especially true in tech-nology-based, knowledge-intensive business services. The author states that there are “instinctive innovation patterns displayed by knowledge intensive business services are based more on professional knowledge and by large net-work-based service firms, while many smaller service firms conform to a supplier-driven pattern” (p. 115) and he adds “project management and on-the-job innovation are common ways of organizing service innovation.” (p. 115)
Once we have shed light on the patterns of innovation in service sector and specialized services sector, we want to cope with another relevant point to our research, which is the size of the businesses. Because we focus on small and medium-sized businesses in the ICT service industry, we would like to deep into the innovation patterns of SMEs. According to Yin and Zuscovitch (1998), innovative behav-ior in small companies faces different kinds of problems than in other organizations. Harris, Rogers, and Siouclis (2001) found that large companies are more innovative than SMEs. Malerba (1993) stated that
the innovative process in SMEs is in general not the result of formal R&D activities carried out at specific laboratories, but of informal accumulated learning that is manifested in the development of skills that allow them to assimilate, adapt and improve new technologies and adapt the company’s production better to specific market demands (p. 234).
Rothwell (1991) found that innovation activities of SMEs are important determinants of these SMEs’ successes, while other authors like Storey (1994) posited that SMEs in all industries do not innovate. According to Tether and Storey (1998), the impact of innovation on sales is an important measure of innovativeness, but the impact in SMEs is lower than in large companies.
focus on SMEs in South Korea. The authors postulated positive relationships between R&D efforts and a firm’s performance.
As a contribution to broaden the approach to study this problem, this article proposes to validate a theoretical model to shed light on the innovation process of SMEs in the ICT ser-vice industry. Thus, first a theoretical model is built, which is then validated against a sample of ICT service industry SMEs in Spain.
Model Development
Innovation Model
According to Ramadani, Abazi-Alili, Dana, Rexhepi, and Ibraimi (2016), firm performance is usually measured by indicators such as profit, revenue, growth, productivity, effi-ciency, stock price, new markets, and export.
Innovation models try to represent innovation procedures for a territory, sector, business, or group of particular busi-nesses, including its relationships and behavior. However, there is a major methodological challenge on how to measure innovation behavior or technological change and its effect on firm performance and at the same time getting appropriate indicators or using proxies that reflect only some aspects of the innovation process (Gërguri-Rashiti, Ramadani, Abazi-Alili, Dana, & Ratten, 2015).
In this respect, Gërguri-Rashiti et al. (2015) posited that
the most common measures used in the literature analysing the innovation process are as follows: (1) a measure of the inputs into the innovation process, such as R&D expenditure or the number of scientists and engineers; (2) a measure of output,
such as the number of inventions that have been patented; and (3) a direct measure of innovation output, such as new products or new processes (p. 5).
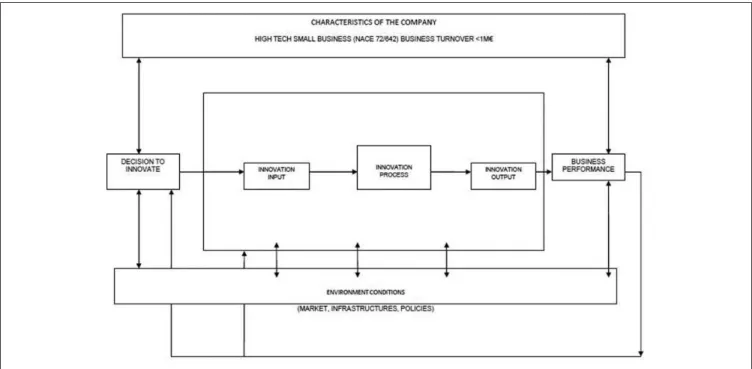
We have selected the conversion model (Crepon, Duguet, & Mairesse, 1998) to establish our theoretical model. We con-sider that innovation is a process that is driven by INPUTS or contributions in the form of R&D, technology acquisition, human or financial resources, that give rise to a series of OUTPUTS or results of innovation in the form of product innovations, process innovations or both. All this is based on the application of a particular innovation process. Thus, the model considers that the OUTPUT of innovation is a depen-dent variable that shows positive and significant correlations between the presence of some INPUT or PROCESS variables and the achievement of product or process innovations in the company.
In the logic of the model, it can be supposed that those com-panies that have developed new processes or products as a result of their innovation should obtain a superior business per-formance to those companies that do not develop innovative behavior. In this sense, companies that are innovative in prod-ucts or processes should have a greater increase in sales, prof-its, markets, or type of customer. The advantages of Crepon et al. (1998) model is that it does not try to explain the innova-tion process as a sequence of a series of activities in developing new products or services; rather, the innovation process appears with much less structure, chaotic, and less rational. By its nature, the conversion model can define the innovation process in service companies much better.
Figure 1 includes a graphic representation of the model we propose (on the basis of the one of Crepon et al., 1998),
market or a decision based on the organization’s own strat-egy) the company will make a series of resources (INPUT) available to its innovation strategy to put new products onto the market or make significant improvements to those already existing, or to incorporate new or improved pro-cesses into the company (OUTPUT). The above is put into practice through an innovative practice which implies the implementation of a series of activities, strategies, interrela-tions, and management modes.
When the innovation process obtains the expected results, a number of effects occur in the business development of the organizations. At this point, there is feedback across the whole model, as the business performance of the organiza-tion will have an influence on the decision to continue the commitment to business innovation as a strategy, and on the resources the organization will make available for the inno-vation strategy or the innoinno-vation process that is applied.
Variables Selection
There is a consensus in the literature about using multidi-mensional approaches for measuring the effects of innova-tion, although there are many theories about which such variables should be (Dewangan & Godse, 2014). Specific variables are established within the development of a model that makes up the set of input, process, output, and business performance variables. The set of variables depends on each case of study (Edison, Bin Ali, & Torkara, 2013; Gurhan, Ulusoy, Kilic, & Alpkan, 2011), and for that reason, the present research should take into consideration the case of service companies. To determine the proposed variables (input and process), we have analyzed the scientific litera-ture and selected those that are considered factors of success for innovation in service companies (De Jong et al., 2003).
The proposed variables in the group of output and business performance variables have been selected in line with those used in the statistical studies in Spain for the case of output variables, and following the contributions of Kemp, Folkeringa, Jong, and Wubben (2003) for the case of business performance variables. Table 1 establishes the list of variables proposed.
Input and Process Variables Validation
To validate and refine the input variables, an analysis has been made using companies located in a region of Spain (Castile-Leon) as a population. The population that is the subject of the study is composed of a total of 51 companies, of which 23 have between 6 and 9 employees, 24 have between 10 and 49 employees, and four have more than 50 employees. The research was carried out through the submis-sion of a survey by post and telephone follow-up. A total of 45 valid surveys were obtained with a confidence level of 95% and a sample error of 0.05.
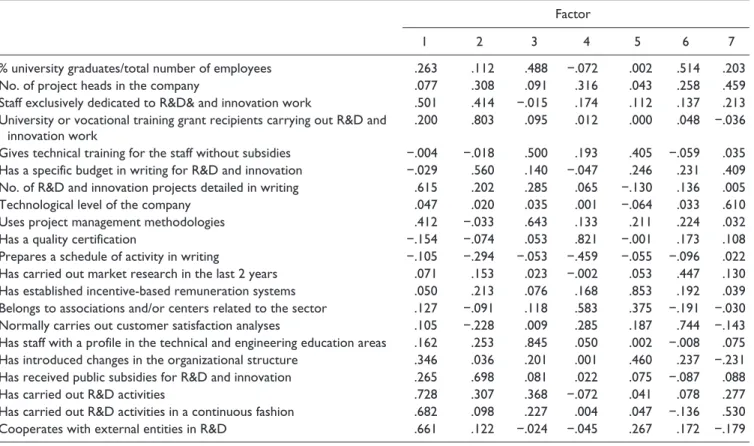
A factor analysis was made with the aim of reducing the dimensionality of the variables used and thus enabling work on a set of variables by exploring the existence of underlying factors or dimensions. This makes it much easier to handle the model and to carry out later analyses.
The extraction of the factors was carried out using the principal axes method, which explained more than 60% of the variation. This gave rise to the appearance of seven fac-tors. By applying an orthogonal Varimax model, a matrix of rotated factors was obtained, which is set out in Table 2.
After analyzing the matrix of rotated factors, it was deter-mined that the composition of the factors is as follows:
Factor 1: The variables that mainly correlate with this fac-tor are:
•
• Staff exclusively dedicated to R&D activity •
• No. of R&D projects set out in writing •
• R&D activities have been carried out •
• R&D activities have been carried out continuously
Input
% university graduates/total number of employees No. of project heads in the company
Staff exclusively dedicated to R&D and innovation work Research assistants in R&D and innovation
Carries out technical training without subsidies Specific budget in writing for R&D and innovation No. of R&D and innovationprojects detailed in writing Technological level of the company
Process
Uses project management methodologies Has a quality certification
Plans activity in writing
Has carried out market research within the last 2 years Has incentive-based remuneration schemes
Belongs to associations and/or centers related to the sector Carries out analyses of customer satisfaction
Has staff with a profile in the technical and engineering education areas
Introduces changes in the organizational structure Has received public subsidies for R&D and innovation Carries out R&D activities
Carries out R&D activities on a continuous basis Cooperates with external entities in R&D Output
Product innovation Process innovation Business performance
Sales in the reference period Profits in the reference period Reference markets
Type of customers
Factor 2: The variables that mainly correlate with this fac-tor are:
•
• University or vocational training grants for R&D work •
• Public subsidies for R&D
Factor 3: The variables that mainly correlate with this fac-tor are:
•
• Percentage of university graduates out of total employees.
•
• Technical training is given without subsidies •
• Project management methodologies are used •
• Staff with a profile in the technical and engineering education areas
Factor 4: The variable that mainly correlates with this fac-tor is:
•
• It has a quality certification •
• It belongs to associations in the sector
Factor 5: The variable that mainly correlates with this fac-tor is:
•
• Incentive-based remuneration plans
Factor 6: The variables that mainly correlate with this fac-tor are:
•
• Market research has been carried out •
• Customer satisfaction analyses are carried out as a rule
Factor 7: The variable that mainly correlates with this fac-tor is:
•
• Technological level of the company
Based on the variables associated with each factor, we can label each of them in the following way:
•
• Factor 1 (F1): R&D in the company •
• Factor 2 (F2): R&D and innovation finance •
• Factor 3 (F3): Technical profile of the human capital •
• Factor 4 (F4): Quality and involvement in associations •
• Factor 5 (F5): Staff incentives •
• Factor 6 (F6): Market orientation •
• Factor 7 (F7): Technological level
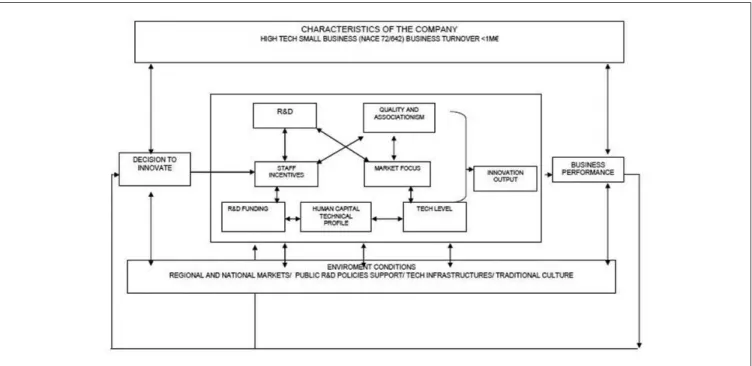
These factors conveniently explain the procedures, behavior, and strategies related to the process of innovation in SMEs in the ICT services sector. The improved model can thus be represented as in Figure 2.
Table 2. Rotated Factor Matrix.
Factor
1 2 3 4 5 6 7
% university graduates/total number of employees .263 .112 .488 −.072 .002 .514 .203
No. of project heads in the company .077 .308 .091 .316 .043 .258 .459
Staff exclusively dedicated to R&D& and innovation work .501 .414 −.015 .174 .112 .137 .213 University or vocational training grant recipients carrying out R&D and
innovation work
.200 .803 .095 .012 .000 .048 −.036
Gives technical training for the staff without subsidies −.004 −.018 .500 .193 .405 −.059 .035 Has a specific budget in writing for R&D and innovation −.029 .560 .140 −.047 .246 .231 .409 No. of R&D and innovation projects detailed in writing .615 .202 .285 .065 −.130 .136 .005
Technological level of the company .047 .020 .035 .001 −.064 .033 .610
Uses project management methodologies .412 −.033 .643 .133 .211 .224 .032
Has a quality certification −.154 −.074 .053 .821 −.001 .173 .108
Prepares a schedule of activity in writing −.105 −.294 −.053 −.459 −.055 −.096 .022
Has carried out market research in the last 2 years .071 .153 .023 −.002 .053 .447 .130
Has established incentive-based remuneration systems .050 .213 .076 .168 .853 .192 .039
Belongs to associations and/or centers related to the sector .127 −.091 .118 .583 .375 −.191 −.030
Normally carries out customer satisfaction analyses .105 −.228 .009 .285 .187 .744 −.143
Has staff with a profile in the technical and engineering education areas .162 .253 .845 .050 .002 −.008 .075
Has introduced changes in the organizational structure .346 .036 .201 .001 .460 .237 −.231
Has received public subsidies for R&D and innovation .265 .698 .081 .022 .075 −.087 .088
Has carried out R&D activities .728 .307 .368 −.072 .041 .078 .277
Has carried out R&D activities in a continuous fashion .682 .098 .227 .004 .047 −.136 .530
Cooperates with external entities in R&D .661 .122 −.024 −.045 .267 .172 −.179
Figure 2. Improved model.
Table 4. Research hypotheses.
Hypothesis 1: The seven factors that comprise INPUT and
PROCESS variables individually show a positive and significant incidence on the probability that the company will show positive innovation outputs.
Hypothesis 2: Companies that show a positive innovative
performance (in other words those that have developed product or process innovations) have had their own customers as the main source of these innovations.
Hypothesis 3: There is a positive and significant relation
between the positive OUTPUT of the innovation process and the company’s business performance, which is materialized in an increase in sales, profits, and reference markets, or an extension of the company’s type of customers.
Table 3. Origin on the Changes in ICT Products and Services
(INDUCEMENT TO INNOVATION).
Population (%)
AND Innovative (%)
Technological suppliers or partners
27.9 27.6
Company strategy 48.8 55.2
Needs of the customers themselves
69.8 65.5
Tailored projects for customers 27.9 41.4
Global changes in the sector 41.9 41.4
Note. ICT = information and communication technologies.
Hypotheses
Once the factors that conveniently explain the INPUT and PROCESS variables for our model have been determined, the interest is to find out whether these factors have a posi-tive and significant influence on the innovaposi-tive or nonin-novative character of the companies that apply them. In this case, we want to know how the presence or absence of various factors (those determined above) and their value or level, influence the probability of the appearance of a dichotomic event, such as the absence or presence of busi-ness innovation. This is the objective of Hypothesis 1 (Table 4).
Pavitt (1984), and Kline and Rosenberg (1986), pointed out that interaction with customers is key to the success of innovation in services. An examination of the characteris-tics of innovation in the service sector presents a taxonomy that is clearly dominated by customers and their needs. The companies analyzed declared that the main source generating change in products and services in the ICT sec-tor is the needs of the customers themselves, with nearly 70% of the companies answering in this way. Table 3 shows details of the results corresponding to the induce-ment to innovation variables. This is the objective of Hypothesis 2 (Table 4).
In the logic of the model, it can be supposed that those companies that have developed new processes or products as a result of their innovation should obtain a superior business performance to those companies that do not develop innova-tive behavior. In this sense, companies that are innovainnova-tive in products or processes should have a greater increase in sales,
Analysis and Results
Logistical regression analyses are used to determine whether a binomial variable depends or not on other variables (not necessarily binomial). In our case, the process is a binomial variable as there are only two possible results: “success” or “failure” (innovative or not innovative), with the probability of each being constant in a series of repetitions.
The individual significance analysis showed that F2, F3, and F6 variables were not significant for the model. The results of the logistical regression were that the factors lead-ing to innovation are, in order of importance, the technologi-cal level of the company (F7), the effort made by the company in R&D (F1), and finally, systems of incentives (F5). Thus, Hypothesis 1 is only partially validated.
Finally, the specific Hypotheses 2 and 3 were validated. This was done by carrying out two correlation analyses that determined the relation between the inducement to innova-tion variables for innovainnova-tions and the innovative output of the company; and a second showed the relations between the output variables and those of business performance.
The first correlation analysis (for validating Hypothesis 2) showed a Pearson correlation value of .432 for the cor-relation analysis between the inducement to innovations variables and the innovative output. This shows statistical significance for the analysis carried out, with a bilateral significance level of .004 (valid over .001). Results obtained for specific Hypothesis 2 show that the main sources of generating innovation in products and services in the ICT services sector for SMEs are those that come from products tailored to specific customers. Thus, Hypothesis 2 is validated.
The second correlation analysis (for validating Hypothesis 3) was a study carried out for each of the business perfor-mance indicators to undertake the correlation analysis between the innovative output and business performance. The first one (increase in company profits) showed a Pearson cor-relation of .339, with a bilateral level of significance of .028. The second (increase in the geographical market of reference) obtained a value of .332 in the Pearson correlation with a bilateral level of significance of .032. The third and last (extension of the number of type of customers) generated a value in the Pearson correlation of −.362, with a bilateral sig-nificance level of .017. Results confirm that the direct effect of product innovation is the extension of the geographical market of reference; in other words, innovative companies in the sector have geographically more extensive markets and companies that innovate in processes also extend the number or type of customers. On the other hand, such innovative companies do not necessarily show an increase in sales or profits. Thus, Hypothesis 3 is only partially validated.
Conclusion
The results show that a more convenient theoretical innova-tion model for SMEs in the ICT services sector is that of Figure 3.
According to this model, the decision to innovate (and the trigger for R&D activities in SMEs in the ICT services sector) is the result of needs that are presented by customers (public or private sector) in tailored projects. All the same, the factors leading to innovation are, in order of importance, the techno-logical level of the company, the effort made by the company in R&D, and finally, systems of incentives.
innovate in processes also extend the number or type of customers.
The result of the business policies expressed in the above paragraphs is an increase in innovation both in products and processes, but what influence does this increased innovation have on the company’s business performance? SMEs in the ICT services sector that have introduced new or substantially improved products onto the market have done so on the basis of extending their geographical market of reference and suf-fered a fall in sales over the same period. In addition, these companies have extended the number or type of their cus-tomers. In other words, innovation has been for them a mar-ket growth strategy.
From a managerial perspective, each company needs to identify which of the factors should be boosted more within the organization, and also the implications on the business strategy to be followed. Future research directions to deal with that question are the study of practical strategy models that should be followed according to their competitive posi-tion in the market. Zhou, Yim, and Tse (2005), as well as Mompó and Redoli (2009) proposed generic models that could be taken as a reference.
Declaration of Conflicting Interests
The author(s) declared no potential conflicts of interest with respect to the research, authorship, and/or publication of this article.
Funding
The author(s) received no financial support for the research and/or authorship of this article.
References
Bowen, F. E., Rostami, M., & Steel, P. (2010). Timing is every-thing: A meta-analysis of the relationships between organi-zational performance and innovation. Journal of Business Research, 63(11), 1179-1185.
Chan, S. H., Martin, J., & Kensinger, J. (1990). Corporate research and development expenditures and share value. Journal of Financial Economics, 26, 255-276.
Coad, A., & Rao, R. (2008). Innovation and firm growth in high-tech sectors: A quantile regression approach. Research Policy, 37, 633-648.
Crepon, B., Duguet, E., & Mairesse, J. (1998). Research, inno-vation and productivity: An econometric analysis at the firm Level (Working Paper No. 6696). Cambridge, MA: National Bureau of Economic Research.
Damanpour, F., Walker, R. M., & Avellaneda, C. N. (2009). Combinative effects of innovation types and organizational performance: A longitudinal study of service organizations. Journal of Management Studies, 46(4), 650-675.
De Jong, J. P. J., Bruins, A., Dolfsma, W., & Meijgaard, J. (2003). Innovation in service firms explored: What, how and why? (Strategic Study B200205). Zoetermeer, The Netherlands: EIM Business & Policy Research.
Innovation Management, 4, 491-528.
Dewangan, V., & Godse, M. (2014). Towards a holistic enterprise innovation performance measurement system. Technovation, 34, 536-545.
Edison, H., Bin Ali, N., & Torkara, R. (2013). Towards innovation measurement in the software industry. The Journal of Systems and Software, 86, 1390-1407.
Ehie, I. C., & Olibe, K. (2010). The effect of R&D investment on firm value: An examination of US manufacturing and service industries. International Journal of Production Economics, 128(1-SI), 127-135.
García Manjón, J. V. (2008). Concentración de sectores inten-sivos en conocimiento y alta tecnología: El caso de España [Concentration of knowledge-intensive sectors and high-tech: the case of Spain]. Journal of Technology Management and Innovation, 3(4), 66-79.
García-Manjón, J. V., & Romero-Merino, M. E. (2012). Research, development, and firm growth. Empirical evidence from European top R&D spending firms. Research Policy, 41, 1084-1092. doi:10.1016/j.respol.2012.03.017
Gërguri-Rashiti, S., Ramadani, V., Abazi-Alili, H., Dana, L. P., & Ratten, V. (2015). ICT, innovation and firm performance: The transition economies context. Thunderbird International Business Review. doi:10.1002/tie.21772
Gurhan, G., Ulusoy, G., Kilic, K., & Alpkan, L. (2011). Effects of innovation types on firm performance. International Journal on Production Economics, 133, 662-676.
Harris, M. N., Rogers, M., & Siouclis, A. (2001). Modelling firm innovation using panel probit estimators (Melbourne Institute Working Paper Series No. wp2001n20). Melbourne, Australia: The Institute of Applied Economic and Social Research, The University of Melbourne. Retrieved from https://ideas.repec. org/p/iae/iaewps/wp2001n20.html
Kemp, R. G. M., Folkeringa, M., Jong, J. P. J., & Wubben, E. F. M. (2003). Innovation and firm performance (Research Report No. H200207). Zoetermeer, The Netherlands: EIM Business & Policy Research.
Kline, S. J., & Rosenberg, N. (1986). An overview of innovation. In R. Landau & N. Rosenberg (Eds.), The positive sum strategy: Harnessing technology for economic growth (pp. 275-306). Washington, DC: National Academy Press.
Malerba, F. (1993). National system of innovation: The case of Italy. In R. Nelson (Ed.), National innovation systems: A comparative analysis (pp. 230-260). New York, NY: Oxford University. Menor, L. J., Tatikonda, M. V., & Sampson, S. E. (2002). New
service development: Areas for exploitation and exploration. Journal of Operations Management, 20, 135-157. doi:10.1016/ S0272-6963(01)00091-2
Miles, I. (2008). Patterns of innovation in service industries. IBM Systems Journal, 47, 115-128. doi:10.1147/sj.471.0115 Miles, I., Kastrinos, N., Bilderbeek, R., Den Hertog, P., Flanagan,
K., Huntink, W., & Bouman, M. (1995). Knowledge-intensive business services: Their role as users, carriers and sources of innovation (European Innovation Monitoring System (EIMS) Reports). Brussels, Belgium: European Commission.
Organisation for Economic Co-Operation and Development. (2015). OECD digital economy Outlook 2015. Paris, France: Author. doi:10.1787/9789264232440-en
Pavitt, K. (1984). Sectoral patterns of technical change: Towards a taxonomy and a theory. Research Policy, 13, 343-373. Pratali, P. (2003). Strategic management of technological innovations
in the small to medium enterprise. European Journal of Innovation Management, 6(1), 18-31. doi:10.1108/14601060310456300 Price, D.P., Stoica, M., & Boncella, R.J. (2013). The relationship
between innovation, knowledge, and performance in family and non-family firms: an analysis of SMEs. Journal of Innovation and Entrepreneurship2(14), 1-20. doi: 10.1186/2192-5372-2-14 Ramadani, V., Abazi-Alili, H., Dana, L.-P., Rexhepi, G., & Ibraimi,
S. (2016). The impact of knowledge spillovers and innovation on firm-performance: Findings from the Balkans countries. International Entrepreneurship and Management Journal. doi:10.1007/s11365-016-0393-8
Ramadani, V., Gërguri, S., Rexhepi, G., & Abduli, S. (2013). Innovation and economic development: The case of FYR of Macedonia. Journal of Balkan and Near Eastern Studies, 15, 324-345. doi:10.1080/19448953.2013.789326
Rothwell, R. (1991). External networking and innovation in small and medium-sized manufacturing firms in Europe. Technovation, 11(2), 93-112. doi:10.1016/0166-4972(91)90040-B
Sok, P., & O’Cass, A. (2011). Achieving superior innovation-based performance outcomes in SMEs through innovation resource–capability complementarity. Industrial Marketing Management, 40(8), 1285-1293.
Storey, D. J. (1994). Understanding the small business sector. London, England: Routledge.
Subramanian, A., & Nilakanta, S. (1996). Organizational innova-tiveness: exploring the relationship between organizational determinants of innovation, types of innovations, and measures of organizational performance. Omega, 24(6), 631-647. Suh, Y., & Kim, M. S. (2012). Effects of SME collaboration on
R&D in the service sector in open innovation. Innovation Management Policy & Practice, 14, 349-362.
Tether, B., & Storey, D. J. (1998). Smaller firms and Europe’s high technology sectors: a framework for analysis and some statisti-cal evidence. Research Policy, 26(9), 947-971.
Tse, T., Esposito, M., & Soufani, K. (2016). Fast-expanding markets: The revolution of the microeconomy. Thunderbird International Business Review, 58(1), 5-11. doi:10.1002/tie.21738
Wilkinson, T. J., & Thomas, A. R. (2014). Innovation’s second step. Thunderbird International Business Review, 56, 273-284. doi:10.1002/tie.21621
Yeonhee, L., Sooyoung, K., & Hyejin, L. (2011). The impact of service R&D on the performance of Korean information com-munication technology small and medium enterprises. Journal of Engineering and Technology Management, 28(1-2), 77-92. Yin, X., & Zuscovitch, E. (1998). Is firm size conducive to R&D
choice? A strategic analysis of product and process innovation. Journal of Economic Behaviour and Organization, 35, 243-262. Zantout, Z., & Tsetsekos, G. (1994). The wealth effects of
announcements of R&D expenditure increase. Journal of Financial Research, 17, 205-216.
Zhou, K. Z., Yim, C. K., & Tse, D. K. (2005). The effects of strate-gic orientations on technology- and market-based breakthrough innovations. Journal of Marketing, 69(2), 42-60.
Author Biographies
Juan Vicente García Manjón is professor of innovation and
man-agement at Universidad Europea Miguel de Cervantes. His work experience has always been closely connected to university– enterprise relationship. He has also a wide experience in the private sector (technology and consultancy). His areas of interest are inno-vation management, leadership, coaching, and business start-up.
Rafael Mompó is currently a telecommunications consultant at an
international telecoms operator, as well as professor and researcher. His main professional goal is to foster young engineer abilities and education toward technology-based and market-based innovations, mainly through the development of enterprising profiles and through the mentoring of young entrepreneurs. His fields of experi-ence are Internet services for small and medium enterprises, e-learning, novel broadband telecommunication systems for tele-com operators, and helping regional governments in the promotion of Information Society.
Judith Redoli is currently a telecommunications professor in the