© Applied Science Innovations Pvt. Ltd., India Carbon – Sci. Tech. 7/2(2015)1-7
1
ARTICLE
Received : 16/12/2014, Accepted :31/12/2014
---Monitoring of biogas plants - experiences in laboratory and full scale
B. Habermann, E. Ritzi, and F. Schulze
Institute of Agricultural and Urban Ecological Projects affiliated to Berlin Humboldt University (IASP), Berlin, Germany.
Abstract: To control and regulate the biogas process there are online process parameters and offline
process parameters, which basically don’t differ between pilot biogas plants and industrial biogas plants.
Generally, temperature, pH-value, volume flow rate and sometimes redox potential are measured online. An online-measurement of the dissolved volatile fatty acids and an online-detection of dissolved hydrogen both directly in the liquid phase as well as near-infrared spectroscopy are under development. FOS/TAC-analysis is the most common offline-analysis of the biogas process and normally it is carried out by the plant operator directly at the biogas plant. For example dry matter, organic dry matter, nitrogen and fatty acids are other analyses, which are carried out but by a laboratory. Microbiological analyses of biogas plants are very expensive and time-consuming and are therefore in Germany very rare. Microbiological analyses are mainly for research purposes. For example the Fluorescence in situ Hybridiation (FISH) is used for characterization of the populations. Electric-optical measurement should be established as a new method to investigate the vitality of the methane producing microorganisms. In a cooperation project, which is promoted by the German ministry for technology, between IASP and Chair of Bioprocess Engineering at TU Berlin, this method is proper investigated using a device from the firm EloSystems. The microorganisms are brought in an electrical field of different frequencies. In this field the microorganisms direct themselves differently according to their physiological state. At the end of this project an early detection of process disturbance will be possible with the help of this method. In this presentation the result of the first tests are presented.
Keywords:Biogas, monitoring, electric-optical measurement, microorganisms
---
1 Introduction: Due to limited reserves of fossil fuels, renewable energies will become more and more important. In this case electricity and heat generation from biogas plays a key role, because it allows sustainable energy generation. But the process control is still inadequate, although in the majority the plants are in industrial scale. The detection of process parameters is used for process monitoring. The aim is to detect process instability in time and to react quickly and directly. Today the process parameters are detected mostly offline, like with FOS/TAC-analysis or chromatographic single acid analysis. Online detection methods like pH measurement or monitoring of biogas or methane volume flow rate do not indicate process disturbances immediately. For characterization of biogas processes and for process optimization a continuously development of analysis methods is necessary.
The aim of the project of the Federal Ministry of Education and Research is the adaption of an electro-optical analysis method to the requirements of biogas cultures for detection of metabolic activity in the biogas process. This method is already established for process monitoring of different pure cultures. The question is, whether this kind of process monitoring is also adequate for biogas processes.
ASI
Carbon
–
Science and Technology
ISSN 0974 – 0546
© Applied Science Innovations Pvt. Ltd., India Carbon – Sci. Tech. 7/2(2015)1-7
2
Four lab scale biogas fermenters were operated parallel for the tests. The fermenters were operated in a stable process state for one week. After that period, two fermenters were overloaded by substrate to reach acidification and to analyze effects on the process parameters. Analyses of different process parameters were performed for process monitoring and to evaluate the results of the electro-optic measurements.
2. Methods and Materials: The electro-optical analysis method analyses the microbiology in the biogas-plant and the viability and the vitality of the cells are determined. Consequently, accurate conclusions about the state of the process can be made and process disturbance can be detected early. The influence of the electrical field on the cell suspension is called polarizability and depends on the structure and composition of the cell [1]. The polarizability depends also on the viability of the cells. Cells with high viability have a higher polarizability [2], [3]. Through the orientation of the cells in the electrical field, conclusions about the viability and vitality of the cells can be made. The electrooptical measurement is carried out with EloTrace 3.0 (Figure 1).
Figure (1): Picture of the EloTrace 3.0. EloTrace 3.0 (EloSystems) for electric-optical measurement. The device has a pump for sampling and a filtration chamber. There are further pumps for dilution and transfer of the sample to the optical cell.
© Applied Science Innovations Pvt. Ltd., India Carbon – Sci. Tech. 7/2(2015)1-7
3
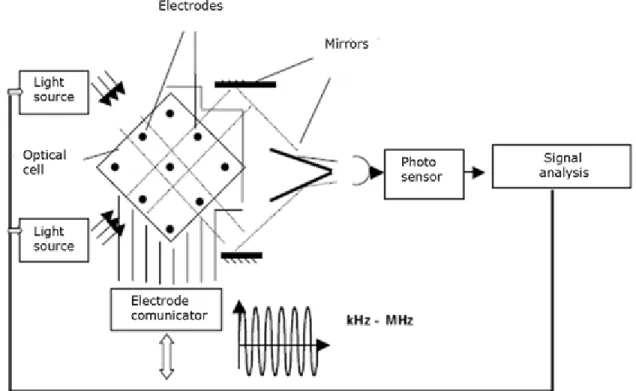
Figure (2): Schematic diagram of the measuring cell in EloTrace. The optical cell is in the center, in which the microorganisms are led. In the optical cell, electrodes are located via the applied electric field. The orientation of the cells is determined via the change in optical density in the optical measuring cell. For this purpose, light is passed through the cell and through a mirror to a photo sensor, which forwards the data to the signal analysis.
In the measuring cell two different signals are detected. The change of optical density (OD) is detected. The OD is proportional to the anisotropy of electrical polarizability (AP). The second signal characterizes the orientation of the cell, which depends on the morphology of the cells [4]. This method is already established for pure cultures und is used for monitoring different kinds of bioprocesses. With this method Junne et. al. [4] could identify different phases in the acetone-butanol-ethanol fermentation with Clostridium acetobutylicum. This method could also be used as online analytic. In a E.coli Batch-Fermentation Junne et. al. [5] proofed that there is a correlation between the polarization and the specific acetic acid synthesis rate.
4 Results and Discussion: A small preliminary experiment was made to investigate if the polarization of the microorganisms in biogas production is basically suitable to describe the state of the process. Samples from two parallel running biogas reactors were taking. The results from the electro optical measurement at the frequency 200 kHz are presented in Figure (3).
© Applied Science Innovations Pvt. Ltd., India Carbon – Sci. Tech. 7/2(2015)1-7
4
Figure (2): Results of electro-optical measurements of fermenter samples of different process states at a frequency of 200 kHz.
Since the results of the preliminary test were positive and a correlation between the polarization and the state of the process was implied, further tests were planned.
Experiments, to determine the polarizability of the microorganisms from four biogas digesters, were carried out in order to make a statement about activity and viability of the microorganisms in various process states. To begin with all four reactors were fed daily with 150 g of corn silage. This was followed by an increase of 50 g per day in reactor 3 and 4 up to an amount of 350 g of corn silage per day.
The organic loading rate of 3.17 kg VS m-3 d-1 increased to a maximum of 7.38 kg VS m-3 d-1 to acidify the fermenter. In the reactors 1 and 2, the feeding rate and loading rate remained constant over the entire test period. The aim was to identify instabilities earlier and more specific.
The determination of the polarizability was performed with the device EloTrace 3.0. The orientation of the microorganisms in a homogeneous electric field at the frequencies 200, 400, 900 and 2100 kHz was detected. The fermenter sample was examined in 4 measuring cycles in terms of the polarizability. The results of the first measurement cycle were omitted because of the potential sample carryover.
Figure (4) shows the variation of the polarizabilities of the four reactors over the entire experimental period. Frequency of 200 kHz is shown, since the other frequencies exhibited similar patterns.
© Applied Science Innovations Pvt. Ltd., India Carbon – Sci. Tech. 7/2(2015)1-7
5
Figure (3): The polarizabilities of the four reactors over the entire experimental period at 200 kHz compared to organic loading rate.
Considering the polarizability no significant differences between the reactors in the different process states were observed. The polarizability was over the entire cultivation period between 400 and 700 relative units at a frequency of 200 kHz.
Therefore another experiment followed, where an unstable and a stabled reactor were compared. Figure (5) shows the measurement results of electro-optical analysis of fermentation samples from these stable and unstable processes at the frequencies 200; 400; 900 to 2100 kHz. There were significant differences in all frequencies considering the polarizabilities of microorganisms in the stable and unstable process state. The signals of the polarizability of the microorganisms from the unstable process were significantly lower than the signals from the stable process.
© Applied Science Innovations Pvt. Ltd., India Carbon – Sci. Tech. 7/2(2015)1-7
6
The results of preliminary experiments were at this experiment confirmed. In addition, however, no early detection of the change of the process condition was possible because the results were measured after acidification. Accordingly, this method is for the early characterization of biogas processes not yet suitable.
The correlation between polarizability and process state could only be shown time-delayed. The electro-optical measuring method determines the total activity of the heterogeneous population of the biogas process [6]. It is possible that an overlay of signals of the different populations of microorganisms occurs. By an increased feed rate, there is an increased activity of the hydrolytic microorganisms. At the time the acidity leads to an inhibition of the activity of methanogenic microorganisms. Thus, the total activity of the microorganisms possibly changed only slightly.
Furthermore, it is possible that the sample preparation is still not optimal. A major problem in sample preparation is the separation of the microorganisms from the substrate and the dissolution of the cell agglomerates that occurs, for example by the symbiosis of hydrogen-forming acetogenic microorganisms and the hydrogen-consuming methanogens.
Accordingly, it cannot be ensured that every examined sample has the same concentration of microorganisms. By further test, the sample should be analyzed by another method. A microscopic analysis of the reactor sample after sample preparation could be a comparative method. The quantitative microscopic fingerprint (QMF) is a direct method for characterization of vitality and efficiency of the biogas process. Using the fluorescence microscopic examination without limitation, statements regarding suspension or lysis of the methanogenic microorganisms can be made [7].
Flow cytometry is another method to study the microorganisms. Various characteristics of single cells can be studied. With this method, microorganisms can be identified and specific cell structures can be investigated, which are mainly found in stable or unstable processes [8] or with the help of various dyes, specific cell structures can be examined.
In the project an optimization of the sample preparation will be made. Some attempts to sample preparation by centrifugation already shown promising results. Using different centrifugation steps, it is possible to separate the microorganisms from the impurities and thus to obtain clearer measurement results.
In addition, the contaminants in the reactor will be reduced or eliminated in further experiments. The biogas fermentation will be carried out with an idealized substrate of corn starch, milk powder and microcrystalline cellulose. The aim of this experiment is to examine the microorganisms of the biogas process without the influence of the sample preparation in terms of the polarizability.
5 Conclusions: In the project an optimization of the sample preparation will be made. Some attempts to sample preparation by centrifugation already shown promising results.
In the previous work, only the signal strength at 200 kHz was observed in the evaluation of the electro-optical measurements. For the further experiments, the principal component analysis is used for interpretation of the data. It is performed in order to include all the information in the evaluation, and then to carry out a reduction of the data.
© Applied Science Innovations Pvt. Ltd., India Carbon – Sci. Tech. 7/2(2015)1-7
7
microcrystalline cellulose. The aim of this experiment is to examine the microorganisms of the biogas process without the influence of the sample preparation in terms of the polarizability.
Furthermore, the electro-optical measurement method must be adapted to more complex substrates and substrate mixtures. A method for automated sample preparation will be designed to avoid errors in the execution and to enable the application in the online analysis.
Although the electro-optical measurements did not lead to the desired goal in the initial experiments, further experiments have shown that it still is a promising method. By further optimization of the sample preparation and the reduction of impurities, it is expected that this method can be used in the future for the characterization of the biogas process.
References:
[1] Bunin V. D., Ignatov O. V., Guliy O. I., Zaitseva I. S., O’Neil D., Ivnitski D., Electrooptical analysis of the Escherichia coli – phage interaction. Analytical biochemistry 328 (2004) 181-186. [2] Dalton C., Goater A., Pethig R., Smith H., Viability of Giardia intestinalis cysts and viability and
sporulation state of Cyclospora cayetanensis oocysts determined by electrorotation. Applied and Environmental Microbiology 67 (2001) 586-590.
[3] Angersbach A., B. V., Ignatov O. V., Electro-optical analysis of bacterial cells. Stoilov S. (ed) Molecular and colloidal electrooptics, (2006) 86–112.
[4] Junne S., Klein E., Angersbach A., Goetz P., Electrooptical measurements for monitoring metabolite fluxes in acetone–butanol–ethanol fermentations. Biotechnology and bioengineering 99 (2008) 862-869.
[5] Junne S., Cruz-Bournazou M. N., Angersbach A., Götz P., Electrooptical monitoring of cell polarizability and cell size in aerobic Escherichia coli batch cultivations. Journal of industrial microbiology & biotechnology 37 (2010) 935-942.
[6] Bunin V. D., Voloshin A. G., Determination of cell structures, electrophysical parameters, and cell population heterogeneity. Journal of colloid and interface science 180 (1996) 122-126.
[7] Schere P. A., Neumann L., Kim Y., Schnellmethode zur biologischen Aktivitätsbestimmung in Biogasanlagen: Quantitativer mikroskopischer Fingerabdruck (QMF). Biogas POTENZIALE: Erkennen, Erforschen, Erwirtschaften; Bornimer Agrartechnische Berichte Heft 79 S. (2012)124-137.
[8] Koch C., Hubschmann T., Harms H., Muller S., Monitoring microbial population dynamics in a labscale biogas reactor using flow cytometry. Helmholtz Centre for Environmental Research (UFZ), http://singlecell.sciencesconf.org/1054/document (03.09.2014).