INTRODUCTION
Many scholars have considered human capital as one of the key factors behind social and economic development (Rodríguez and Vilalta-Bufi, 2005). Based on such approach, the development potential of a territory, apart from favourable demographic indicators (in a narrow sense), largely depends on citizens’ creative potentials and especially on their education. Namely, the achieved level of citizens’ education is an indicator of the quality of available human resources potentials as agents of future development.
Underconditions of globalization and innovations in information and communication technologies, education gains in importance. Today, in development plans of all developed countries and international organizations knowledge is considered as basis of prosperity, growth and welfare, In other words, education and strengthening of human resources are among the top priorities in national strategies and social, economic and technological development strategies. At the same time, the effects of education are not felt only by individuals, but by society as a whole, due to which education policy is not treated
just as a policy for creating human capital, but as a part of development policy (Mitrović and Mitrović, 2015).
In relevant strategic documents on international, regional and national levels, education is one of the main focal points. In the Lisbon Strategy (The Lisbon European Council: Аn Agenda of Economic and Social Renewal for Europe) the European Union stated its view that Europe’s increased competitiveness is founded on investment in a productive knowledge-based society. Education is set as one of the most important pillars for achieving the defined goals. In the newest strategic document Europe 2020 – A European strategy for smart, sustainable and inclusive growth, education and training development policies represent foundations of the strategy (since knowledge and skills are seen as main resources of progress and development, out of seven initiatives three are directly concerned with education, while education is related to the other four initiatives, too, albeit indirectly).
The World Bank Institute (within Knowledge for Development program) has defined a framework and developed the Knowledge Assessment Methodology for systematic knowledge assessment in accordance with the knowledge-based economy. The framework consists of
HUMAN CAPITAL AND ITS SPATIAL DISTRIBUTION
AS LIMITING FACTORS FOR
THE BALANCED DEVELOPMENT OF SERBIA
Vesna Jokić
1, Institute of Architecture and Urban & Spatial Planning of Serbia, Belgrade, SerbiaOmiljena Dželebdžić
, Institute of Architecture and Urban & Spatial Planning of Serbia, Belgrade, SerbiaKsenija Petovar
, University professor retired, Belgrade, SerbiaHuman capital is one of the key factors of economic and social development. Namely, the growth potential of a territory is largely dependent on human capital that is, on citizen’s creative potential and especially on their education. Society with a better endowment of human capital has a greater development potential.
The subject of this paper is Serbia’s human capital seen from the point of view of workforce education structure (20-64 age group). In this paper we present spatial distribution of workforce, i.e. the differences in workforce education levels and polarization of Serbian territory in terms of human capital pool. The result is a typology of municipalities in Serbia based on calculated values of average completed education level – the EMN index. Mapping of the corresponding values was done at the municipality level in order to get a clear distinction and a more accurate picture of spatial disparities in human resources.
Key words: education structure, workforce, human capital, regional polarization in Serbia.
1 Bulevar kralja Aleksandra 73/II, 11000 Belgrade, Serbia
vesna@iaus.ac.rs
Review paper
four pillars essential for a country to be able to participate in knowledge-based society and economy. Education and training represent the first pillar. This pillar is particularly important since in order to be included in modern developments, a country must have well-educated and trained citizens which create, spread and use relevant knowledge, strive for the increase in overall productivity and for the acceleration of economic growth. Participation of a large number of highly educated workers is necessary for growth, but the importance of lower levels of education must not be neglected (Chen and Dahlman, 2004).
In summary, today’s globalizing economy requires countries to nurture a stock of well-educated workers who are able to adapt rapidly to the changing environment and the evolving needs of the production system (WEF, 2014). In the modern paths of development a systematic and continuous implementation of the learning process and education is becoming one of the main forms of human resources development. There is a common agreement that highly educated population represents the greatest and most important potential and growth resource. Highly educated workforce, or at least a workforce with a solid primary level of education, is much better prepared to adapt to new technologies, innovations and competitiveness at the global level. Countries that predominantly have a primary level of education are more likely to be constrained by low levels of income and fewer opportunities for future development for individuals (WEF, 2015).
In recent decades the relevant literature has shown that regional disparities should be associated with differences in the endowment of the socio-economic characteristics of each region (Karahasan and López-Bazo, 2013). The educational attainment of the population is referred to as the key factor of differences in regional economic growth. In other words, human capital is considered as important factor in explaining differences in economic development among regions and is used to show economic convergence across them (Lucas, 1988, Barro et al., 1991). The results of the combined analysis of cross-regional, institutional, cultural and human capital determinants of regional development show that “more than 1,500 subnational regions of the world suggest that the regional education is a critical determinant of regional development, and the only such determinant which explains a significant part of regional variation” (Gennaioli et al., 2013:152). Namely, from a regional perspective, human capital is considered to be the key ingredient of regional growth. Therefore, the better knowledge of the spatial distribution of human capital could contribute to the better understanding of the origins of regional socio-economic inequality.
The issues of regional disparities in Serbia have been the subject of numerous analyses and documents. However, education of population has never been observed as relevant factor (cause) of such disparities. Also, the intensive research on migration (internal and external) was not understood as an important push factor of regional inequalities (Petrović, 1987, Davidović, 1989). In the last decade in Serbia, one can observe the orientation toward society based on knowledge (education) in many state and civil society organizations’ programmes and strategies. However, the analyses have
shown the inadequacy of the majority of these documents (Mirić, 2014). Consequently, in this plethora of strategies there is was no adequate strategy for the development of human resources in Serbia, and their efficiency and effective implementation also present a separate problem.
At the same time, Serbia is faced with formidable intra-regional and inter-intra-regional differences which encourage migration flows – migration of human capital, causing ever greater demographic imbalance and multiplying/deepening disparity in all development areas (economic, social, educational, tec.). Under such circumstances the increasing brain drain2 of young, highly educated people is especially worrying since it contributes to a significant exhaustion of human capital and deepening of problems concerning economic, social, demographic and spatial development of Serbia in general.
This paper presents human capital in Serbia with regard to educational attainment of the working age population (20-64 age group)3 and spatial inequalities in endowment of educational workforce. With the systematization of data on the educational structure of workforce at the micro-municipal level, it is possible to make a typology of municipalities according to human capital-educational stock.
RESEARCH METHOD
When measuring education, it is important to make a conceptual difference between education flows and stocks. The flow refers to the process of education (formal and informal), that is, to school education, which is basically a “production” of human capital (usual indicators are student enrolment rates, student-teacher ratio, the rate of early dropping out of school, etc.). Human capital refers to the stock of educated adult citizens that is formed as a result of past education flows. Usually, it is measured with regard to the level of formal education (the highest level completed or average length/duration of schooling), but the dimension of quality is also included (general knowledge, capabilities, skills, etc.)4. The level of formal education is usually stated for the population older than 15 or 25, showing an overall
2 The term “brain drain” was first popularised in the 1950s and referred
to immigration of the best scientists to the United States of America from countries such as the United Kingdom, Canada and the former Soviet Union. Today, it is used in a broader sense to refer to international transfer of the human capital (people with higher education) from developing to developed countries (Rapoport, 2002). Also, for decades, brain drain has been at the heart of many debates about the impact of this phenomenon on the country of origin and inequalities among countries.
3 The statistical term “working age population“ includes all persons from the ages of 15 to 64 that are able to work (The Statistical Office of
the Republic Serbia, Methodological explanations applied in education statistics). For the purpose of this paper it is more important to take into account the population in the age group from 20 to 64, because of the upper limit for the acquisition of secondary education, the minimum level of education necessary for the inclusion into modern
development flows.
4 In the last several years models for measuring the quality of human
human capital of a population in a given moment. However, we can get much more accurate information when we disaggregated this indicator by education levels across different age groups. In that way, we can observe differences in human capital stock between age groups which without doubt significantly affect society and economy.
In this paper the analysis is focused exclusively on the educational attainment of the working age population (20-64 age group) in Serbia as a measurement of human capital stock. The focus is on the spatial dimension, that is, the spatial differences in education of workforce stock. We used the 2011 Census data on the educational structure of the population at the municipal level. Using this data has several advantages (it provides the most complete picture since it includes the entire population and is available at the lowest spatial level) in comparison with other sample based statistical surveys (e.g. The Survey on Labour Force). In addition to that, the intention of this paper is to identify regional and inter-regional disparities pertaining to human resources which become much more visible when we take a smaller territorial unit (municipality) as a starting point.
For the sake of easier comparison of education levels a proxy index was used – average completed education level /EMN (Rodríguez-Pose and Tselios, 2011:371) that is calculated based on the following formula:
where j ϵ {1,2,3} is education level, Lj percentage of individuals of the j-level of education, Sj assessment of each category. S1= 2 for tertiary (higher and high education), S2= 1 for secondary/high-school education and S3= 0 for primary education.
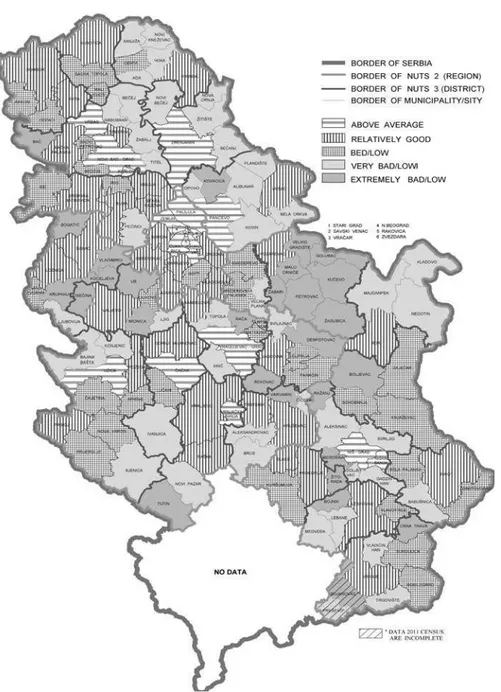
Average completed education level was calculated for the entire working age population (20-64 age group), the youngest part of workforce (20-24) and two more groups (25-39 and 40-64) on the level of municipalities. Figure 1 shows the typology of municipalities based on calculated values of the EMN index.
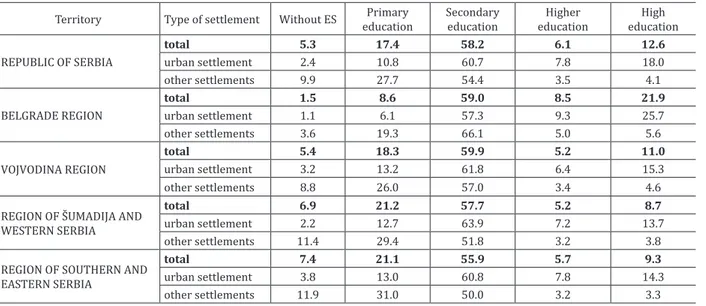
WORKFORCE EDUCATION STRUCTURE IN SERBIA As per 2011 Census, working age population on the territory of the Republic of Serbia amounted to 4,509,274 individuals (around 63% of total population). Compared with the education level (Table 1), more than half of the workforce in Serbia (2,625,424, i.e. 58.2%) has completed secondary education, 17.4% has graduated only from primary school (784,392), 5.3% has not completed primary education (239,983), 6.1% has completed higher (274,466) and 12.6% high education (568,424). Apart from that, human capital stock is larger in urban than in other settlements. The percentage of workforce with high education is higher in urban (18%) than in other settlements (around 4%), where more than one-quarter (around 28%) are individuals who have completed only primary education and 10% have not completed primary education.
In comparison with the 2002 Census data, workforce education structure in Serbia has changed, which is the result of older generations leaving the workforce and younger, usually more educated generations coming of age (Chart 1). It is evident that in younger age groups the share of individuals with higher education has increased considerably: from 0.9% to 6.1% in the 20-24 age group (from 4,409 individuals in 2002, to 27,044 individuals in 2011); from 7.4% to 18.7% in the 25-29 age group (from 37,096 individuals to 89,825) and from 9.4% to 18% in the 30-34 age group (from 45,929 individuals to 89,269). This has occurred due to the opening of new faculties (faculty departments) in Serbia. New faculties have made this level of education more accessible to the younger population living in the provinces. Compared to the academic year 1998/1999, the number of faculties (organizational units) in 2010/2011 has increased by 55 (from 75 to 130). The biggest increase has occurred in Belgrade (from 37 to 69), in Vojvodina (from 16 to 30), in Šumadija and Western Serbia (from 10 to 16), and in Southern and Eastern Serbia(from 12 to 15) (SORS, 1999, 2001). The opening of private faculties was followed by the foundation of large number of organizational units in smaller towns and municipal centres. However, most of these departments were not accredited, due to which in the
EMN
=∑
LjSj
j
Territory Type of settlement Without ES Primary education
Secondary education
Higher education
High education
REPUBLIC OF SERBIA
total 5.3 17.4 58.2 6.1 12.6
urban settlement 2.4 10.8 60.7 7.8 18.0
other settlements 9.9 27.7 54.4 3.5 4.1
BЕLGRADE REGION
total 1.5 8.6 59.0 8.5 21.9
urban settlement 1.1 6.1 57.3 9.3 25.7
other settlements 3.6 19.3 66.1 5.0 5.6
VОЈVОDINА REGION
total 5.4 18.3 59.9 5.2 11.0
urban settlement 3.2 13.2 61.8 6.4 15.3
other settlements 8.8 26.0 57.0 3.4 4.6
REGION OF ŠUMАDIЈA AND
WESTERN SERBIA
total 6.9 21.2 57.7 5.2 8.7
urban settlement 2.2 12.7 63.9 7.2 13.7
other settlements 11.4 29.4 51.8 3.2 3.8
REGION OF SOUTHERN AND EASTERN SERBIA
total 7.4 21.1 55.9 5.7 9.3
urban settlement 3.8 13.0 60.8 7.8 14.3
other settlements 11.9 31.0 50.0 3.2 3.3
last several years students have been warned to check if the department is accredited before enrolling5.
Regarding the share of workforce with tertiary education, Serbia lags behind the European Union average (EU27) in all age groups (Chart 2). The biggest differences are in the age groups under 44, and they stand at around 9.5% in the 35-39 age group, and at 6.5% in the 24-29 age group. There is no doubt that the emigration of young, highly educated population contingents has much graver consequences for the quality of human capital in Serbia than in most European countries. In 2011, compared to 2002, Serbia has increased the difference (lagging) in the quality of its most valuable part of workforce in all age groups in comparison with the European average, except for a marginal decrease in difference in the 30-34 age group.
Relative to the neighbouring countries (Bulgaria, Romania and Hungary) and the two former SFRY republics (Croatia and Slovenia), all members of the EU, Serbia has better human capital than Romania (across all age groups), similar human capital to Hungary, similar human capital to Slovenia in the youngest age group (24-29) and in the older age groups (older than 50), but it lags behind Slovenia in other age groups. Serbia has similar human capital to Croatia and Bulgaria in the oldest age group (55-64) and the youngest age group (24-29).
The World Economic Forum Report from 2014 also shows Serbia lagging in education. The measured value of index for the education and training6 amounts to 5.0 for EU28, and 3.8 for Serbia. Serbia is ranked lower than the worst ranked Romania (3.98), but it is also ranked lower than the rest of the EU candidate countries (Iceland – 5.31, Montenegro – 4.28, Turkey – 4.28 and FYR Macedonia – 4.0) (WEF, 2014:14).
5 More han 100 faculties were not accredited, that is, just 14 branch
departments and 15 higher education departments were accredited in 2014 (Blic daily newspaper, 3 July 2014). In April 2015 the Commission for Accreditation and Quality Assurance of the Republic of Serbia published the document “A Guide through Accredited Study Programs in the Institutions of Higher Education in Serbia”.
Without ES Primary education
Secondary education
Higher education
High education
2002 11.7 22.1 50.7 5.3 7.8
2011 5.3 17.4 58.2 6.1 12.6
0.0 10.0 20.0 30.0 40.0 50.0 60.0
Chart 1. Workforce education level (20-64 age group) in Serbia (in %) – 2002 and 2011 Census
6 Includes seven indicators: Quality of the education system; PISA scores
on education quality; tertiary education enrolment rate; secondary education enrolment rate; availability of training services; quality of management schools and the extent of staff training.
Age group
EU-25 EU-27 Serbia
Difference between EU average and
Serbia
2002. 2011. 2002. 2011. 2002. 2011.
24-29 NA 31,6 11,9 25,1 – 5,5%
30-34 24,3 33,6 14,9 24,8 – 9,3% – 8,8%
35-39 22,4 30,1 16,1 20,6 – 6,3% – 9,5%
40-44 20,7 25,9 16,5 18,3 – 4,2% – 7,6%
45-49 19,7 23,6 14,7 18,4 – 5,0% – 5,2%
50-54 17,9 21,7 15,6 18,2 – 2,3% – 3,5%
Chart 2. A share of highly educated individuals (tertiary education) in age groups (Source: European Commission, Education, Audiovisual and Culture Executive Agency, 2012)
For Serbia: SORS, 2013)
0.0 5.0 10.0 15.0 20.0 25.0 30.0 35.0 40.0
24-29 30-34 35-39 40-44 45-49 50-54 55-64
Spatial distribution of Serbia’s human capital across regions
Serbia is characterized by pronounced spatial polarization and disproportion in the distribution of workforce and stock of human capital. In 2011 almost a quarter (23.7%) of Serbia’s working age population was concentrated in Belgrade, which covers around 4% of Serbian territory. In Vojvodina, Šumadija and Western Serbia regions, whose share in the territory of Serbia is similar (32% and 34% respectively), the distribution of workforce is also similar (27.2% and 27.9% respectively). The region of Southern and Eastern Serbia, characterized by depopulation, has the smallest share in Serbian workforce (21.2%). In the last mid-census period (2002–2011) the number of citizens living in this region has decreased by 190,000, more than 90,000 of which due to migrations (Јоkić, 2013).
When we look into the distribution of workforce with regard to the education structure, the polarization of Serbian territory is even more pronounced. The region of Belgrade absorbs the largest share of Serbian quality human capital – more than two-fifths of highly educated people live there (41%), as well as one-third (33%) of individuals with higher education. A little bit less than one-quarter of Serbia’s working age population with high and higher education (24% and 23% respectively) lives in Vojvodina, 19% and 24% in Šumadija and Western Serbia, and the smallest share of population with high and higher education is in the region of Southern and Eastern Serbia – 16% and 20% respectively. Most of the workforce without primary education and with primary education only is concentrated in Šumadija and Western Serbia (36% and 34%, respectively), in the region of Southern and Eastern Serbia (30% and 26%) and Vojvodina (28% and 29%), while only 7% and 12% in Belgrade (Јоkić and Dželebdžić, 2014).
TYPOLOGY OF MUNICIPALITIES AND CITIES WITH REGARD TO QUALITY OF HUMAN CAPITAL
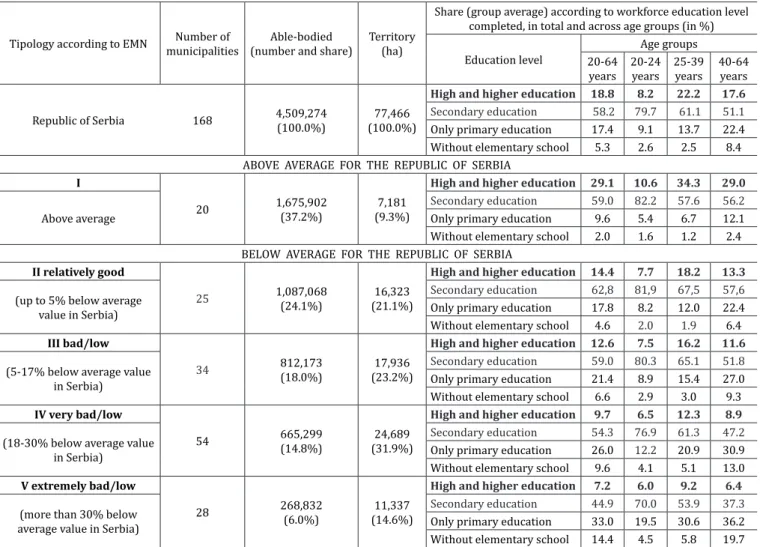
Based on the EMN values in the 20-64 age group, municipalities and cities were categorized in five groups (Table 2, Figure 1). Group gradation was made based on the national average, that is, on the deviation from the national value of EMN (0.96). There are two basic groups: above and below national average. The table also shows (for each separate group) the average share (at the group level) according to education levels (for the total workforce and for the three sub-groups (20-24, 25-39, and 40-64)), in order to monitor/perceive differences in human capital stock.
There are 20 municipalities/cities in the group which exceeds national average, and they account for more than a third of Serbian workforce (37.2%). Four municipalities (Pančevo, Zrenjanin, Vrbas and Vrnjačka Banja) have the EMN slightly above national average (0.97). Within this group a sub-group was created representing the highest quality Serbian workforce. Ten Belgrade municipalities and the cities of Novi Sad and Niš belong to this sub-group. The municipalities of Vračar (1.52), Stari grad (1.50) and Savski venac (1.45) have by far the highest EMN.
Municipalities below the national average are classified in four groups. The best ranked municipalities are those
with the EMN up to 5% below national average – 25 municipalities in total. Almost a quarter of Serbian workforce is concentrated in these 25 municipalities in which the EMN value ranges from 0.90 to 0.95. The worst ranked are municipalities (group V) with the EMN more than 30% below national average. There are 28 municipalities in this group which has a very small workforce stock (around 6% of total Serbian workforce stock). The biggest concentration of municipalities in this category is in Braničevo District, which stands out as a district with the greatest share of external migrations (massive citizen migrations in search for work abroad since the 1960s). According to the 2011 Census, around 20% of citizens from this region went abroad. In some municipalities (Malo Crniće, Žabari and Kučevo) this percentage exceeds 30%, and in Petrovac na Mlavi and Veliko Gradište it exceeds 25% (Stanković, 2014). Besides that, in two of the above mentioned municipalities (Žabari and Malo Crniće), as well as in Osečina municipality, the deviation from the average national EMN is larger than 50%.
The remaining two groups (III and IV) represent the middle between 5% and 30% deviations. Thus, group III includes municipalities in which the deviation from average EMN ranges from 5% to 17%, and group IV includes those in which average EMN ranges from 18% to 30%. Around 15% of Serbia’s workforce is concentrated in group IV which includes 54 municipalities, while a significantly smaller number of municipalities belong to group III (34). However, the human capital stock in group III is larger (18%) and of higher quality.
Municipalities belonging to groups IV and V which have a small stock of human capital and large disproportion in human capital, and that are surrounded by other low human capital municipalities are in gravest danger of remaining trapped by weak human capital and social and economic exclusion.
From the point of view of age groups, far smaller deviations from national average can be seen in the 20-24 age group, although in groups IV and V the share of individuals who have completed only primary education (19.5% in group IV and 28.8% in group V), and who have not completed primary education (4.5% in group IV and 5.5% in group V) is very high in comparison with other groups. Workforce in the age group 25-39 within groups II and III is better “positioned” (deviations from national average are smaller) across all
Chart 3. Population distribution in the 20-64 age group according to education level across regions (%) – 2011 Census
0.0 5.0 10.0 15.0 20.0 25.0 30.0 35.0 40.0 45.0
BELGRADE VOJVODINA ŠUMADIJA AND WESTERN SERBIA
SOUTHERN AND EASTERN SERBIA
Table 2. Typology of municipalities/cities with regard to the quality of human capital
Tipology according to EMN Number of
municipalities
Able-bodied (number and share)
Territory (ha)
Share (group average) according to workforce education level completed, in total and across age groups (in %)
Education level
Age groups 20-64
years 20-24
years 25-39 years
40-64 years
Republic of Serbia 168 4,509,274
(100.0%)
77,466 (100.0%)
High and higher education 18.8 8.2 22.2 17.6 Secondary education 58.2 79.7 61.1 51.1
Only primary education 17.4 9.1 13.7 22.4
Without elementary school 5.3 2.6 2.5 8.4
ABOVE AVERAGE FOR THE REPUBLIC OF SERBIA I
20 1,675,902
(37.2%)
7,181 (9.3%)
High and higher education 29.1 10.6 34.3 29.0
Above average
Secondary education 59.0 82.2 57.6 56.2
Only primary education 9.6 5.4 6.7 12.1
Without elementary school 2.0 1.6 1.2 2.4
BELOW AVERAGE FOR THE REPUBLIC OF SERBIA II relatively good
25 1,087,068
(24.1%)
16,323 (21.1%)
High and higher education 14.4 7.7 18.2 13.3
(up to 5% below average value in Serbia)
Secondary education 62,8 81,9 67,5 57,6
Only primary education 17.8 8.2 12.0 22.4
Without elementary school 4.6 2.0 1.9 6.4
III bad/low
34 812,173
(18.0%)
17,936 (23.2%)
High and higher education 12.6 7.5 16.2 11.6
(5-17% below average value in Serbia)
Secondary education 59.0 80.3 65.1 51.8
Only primary education 21.4 8.9 15.4 27.0
Without elementary school 6.6 2.9 3.0 9.3
IV very bad/low
54 665,299
(14.8%)
24,689 (31.9%)
High and higher education 9.7 6.5 12.3 8.9
(18-30% below average value in Serbia)
Secondary education 54.3 76.9 61.3 47.2
Only primary education 26.0 12.2 20.9 30.9
Without elementary school 9.6 4.1 5.1 13.0
V extremely bad/low
28 268,832
(6.0%)
11,337 (14.6%)
High and higher education 7.2 6.0 9.2 6.4
(more than 30% below average value in Serbia)
Secondary education 44.9 70.0 53.9 37.3
Only primary education 33.0 19.5 30.6 36.2
Without elementary school 14.4 4.5 5.8 19.7
Note: The cities of Novi Sad, Niš, Požarevac and Vranje which have two or more urban municipalities were taken as a whole, that is, the data was not given, nor mapped separately for those urban municipalities
education levels. In groups IV and V a share of citizens who have completed only primary education is much higher than the share of citizens with higher and high education (20.9%:12.3% and 30.6%:9.2%, respectively).
Noticeable differences in human capital on the territory of Serbia (Figure 1) are undoubtedly related to migrations (internal and external) and to the increasing depopulation of certain districts. According to the 2011 Census, population has increased only in 16 (11 on the territory of Belgrade) out of 168 municipalities/cities. The most severe decrease occurred in Bor District (by approximately 15%), followed by Zaječar and Pirot Districts (by approximately 13%), all on the region of Southern and Eastern Serbia.
REGIONAL AND INTRA-REGIONAL INEQUALITIES IN ENDOWMENT OF WORKFORCE
The Table 3 summarizes data by region according to the adopted typology of municipalities, that is based on the data of workforce stock (average completed education level). In comparison with Table 1, which shows workforce educational structure in the region, Table 3 presents the spatial distribution endowment of workforce. In addition, Table 3 presents regional and intra-regional educational inequalities within workforce, as well as its territorial polarization.
Belgrade region has by far the highest quality human capital - about 80% of workforce are above average quality, and the remaining 20% belong to category II – relatively good workforce.
Compared to that, Vojvodina has about 34% of the workforce with above average quality concentrated in city of Novi Sad and four in municipalities (15% area of the region), and 28% of workforce with relatively good education cover about 24% of the territory. The share of workforce with low educational attainment is around 15%; and a little bit more than one fifth of the workforce (21.5%), covering a large part of the territory (41%), has a very low educational attainment. This workforce is concentrated mainly in border municipalities in three districts (Northern Bačka, South Banat and Middle Banat).
The area south of Belgrade has a much lower quality human capital and intra-regional disparity is much more pronounced here.
Tipology according to EMN
Above average II (relatively good) III (bad/low) IV (very bad/low) V (extremely bad/low)
SERBIA
municipality (%) 12,4 15,5 21,1 33,5 17,4
workforce (%) 37,2 24,1 18,0 14,8 6,0
area (%) 9,3 21,1 23,1 31,9 14,6
BELGRADE
municipality (%) 58,8 35,3 5,9 0,0 0,0
workforce (%) 78,6 20,3 1,2 0,0 0,0
area (%) 31,4 60,0 8,6 0,0 0,0
VOJVODINA
municipality (%) 11,1 17,8 15,6 51,1 4,4
workforce (%) 33,7 28,1 14,7 21,5 2,0
area (%) 15,0 23,8 16,6 40,9 3,6
ŠUMADIJA AND
WESTERN SERBIA
municipality(%) 7,7 13,5 28,8 26,9 23,1
workforce (%) 20,3 25,5 26,4 17,0 10,8
area (%) 8,8 20,3 26,2 27,2 17,4
SOUTHERN AND EASTER SERBIA
municipality (%) 2,1 8,5 23,4 36,2 29,8
workforce (%) 17,4 21,4 30,1 19,7 11,4
area (%) 2,3 14,8 27,3 33,0 22,6
on approximately 20% of the territory. Almost similar percentage (26.4%) of the workforce with low education attainments settled in 15 municipalities that cover 26% of the territory. Workforce with weakest characteristics (IV and V category) – 28% covers 23% of the area. In total, human capital stock is bad on around 71% of the territory (categories III-V)
The region of Southern and Eastern Serbia has generally low EMN values (III-V categories) and human capital is the weakest in Serbia. Only the city of Niš has quality of the workforce above average (17,4%) but it covers only 2% of the territory of the region. The share of relatively good quality workforce is around 21%, but it covers relatively small territory of around 15%. The rest of the territory (around 83%) has low quality workforce: 28% of low quality workforce on 28% of the territory; around 20% of very low quality workforce on 33% of the territory; and extremely low quality workforce covers 23% of the area.
It is obvious that all regions, except Belgrade which has a strong concentration of human capital, are characterized by intra-regional inequalities in the spatial distribution of workforce, in particular the region of Southern and Eastern Serbia and the region of Šumadija and Western Serbia. Such state of spatial distribution and quality of human capital is the result of decades-long lack of appropriate regional development policies, which are supposed to respond to regional disparities. However, the increasing spatial imbalance had initiated permanent migration from the less developed territory (region of South and East Serbia and region of Šumadija and Western Serbia). This is best illustrated in the data on population numbers in Serbia in the period from 1991 to 2011. Two decades ago, there were 532,145, or more than half a million, more citizens in the South (Šumadija and Western Serbia, and Southern and Eastern Serbia regions) than in the North (Belgrade and Vojvodina regions). However, by 2011 the population in the North increased by 68,903 citizens, while it decreased by 460,000 inhabitants in the South. In total, the number of citizens in the region of Southern and Eastern Serbia decreased in the last two decades by around 300,000, out of which 160,000 due to migrations. In the region of Šumadija and Western Serbia the number of inhabitants decreased by 165,000, out of which 60,000 due to migrations.
When we add all this to the number of emigrants that left during the 1990s, when a large number of highly educated people left the country (so-called brain drain phenomenon), becomes clearer issue of human resources in Seria. According to data provided by Grečić (2002) in the period 1990–2000, a total of 73,000 citizens from Serbia and Montenegro went to transoceanic countries, of which number more than 17,000 were people with higher education. When it comes to Europe and other parts of the world as emigration targets, the author estimated that the exodus of university-degree citizens probably counted over 30,000 (Grečić, 2002: 255-257).
There is no data on the exact number of emigrants in the last decade of the 20th and the first decade of the 21st century. This lack of a data base presents a particular obstacle in analysing migration trends and drafting projections for the
future. It is evident that the process of migration of young educated population continues. In the last mid-census period (2002–2011), a total of 175,021 Serbian citizens left the country, of whom 96,000 have been abroad for longer than one year (the ones that left between 2002–2010). Also, in 2011, the number of Serbian citizens abroad equalled 313,000 (4.2% of total population), mostly people from the region of Southern and Eastern Serbia (6.7% of the population in this region) and Šumadija and Western Serbia (4.9%), with much fewer from the Belgrade region (2.8%) and Vojvodina (2.6%) (Stanković, 2014).
Moreover, in addition to 31,580 citizens with university degrees, in 2011 there were also 12,000 students abroad. The most intense brain drain is from the Belgrade area given that of the total number of students, a little under one-third (31.8%) are from this region, 31% are from Vojvodina, around 22% from Šumadija and Western Serbia and 15% from the Southern and Eastern Serbia region.
This constitutes one of the biggest problems for Serbia – a growing trend of highly educated and talented population leaving Serbia and depleting the country’s human capital. There is no doubt that the exodus of this category of population, increasing day by day, is an irreparable economic, demographic, cultural and intellectual loss for Serbia.
CONCLUSION
The issue of evidently unequal development of regions in Serbia that has been neglected for decades and the fact that the consequences of external and internal migrations that caused a demographic depopulation of certain parts of Serbia as early in the second half of the 20th century that were largely ignored led to a very pronounced territorial polarization in every respect (economic, social, demographic).
Results of the analysis into the quality of human capital in municipalities and cities suggest a high discrepancy and polarization regarding the total workforce. There are no significant differences in the younger contingent either, because migrations continued and increased in the first decade of the 21st century, both internally (from smaller towns mainly to Belgrade and Novi Sad) and externally (abroad), depleting the human capital particularly in areas with small stock of workforce.
In summary, the results have confirmed the existence of a very pronounced spatial discrepancy and polarization with regard to concentration and distribution of human capital quality. From this perspective, we can hardly talk of a balanced spatial development on the territory of Serbia.
It is obvious that Serbia is looking at an insoluble problem, and that is to retain (preserve its human capital) and, which is even harder, attract experts, as indicated by the data of the Global Competitiveness Report 2013–2014 (WEF, 2014). Two new indicators are used: the country’s capacity to keep talent, according to which Serbia ranks as 146th, and its capacity to attract talent, where Serbia occupies the second but last position out of 148 countries. Countries in the neighbourhood are in a somewhat better position (Bulgaria 142nd and 144th), Romania (138th and 132nd), Croatia (134th and 143rd), Hungary (126th and 115th), whereas Albania is far better ranked (60th and 63rd).
Evidently, Serbia today lacks the economic strength to provide employment for working-age population, most notably among the young. However, bearing in mind the biological exhaustion of rural areas and the increasing brain drain from towns and cities, Serbia must waste no time and start developing mechanisms and incentives to stop young people from leaving.
Acknowledgement
The paper was prepared within the research project „The Role and Implementation of the National Spatial Plan and Regional Development Documents in Renewal of Strategic Research, Thinking and Governance in Serbia“, number III 47014, financed by the Republic of Serbia, Ministry of Education, Science and Technological Development.
REFERENCES
Barro, R., Sala-I-Martin, X. Blanchard, O., Hall, R. (1991) Convergence Across States and Regions, Brookings Papers on Economic Activity, No. 1, pp. 107-182. http://www.bbk.ac.uk/ ems/faculty/zoega/research/barrosalaimartin.pdf, accessed on 21th Nov 2009.
Chen, D., Dahlman, C. (2004) Knowledge and Development – A Cross-Section Approach, World Bank Policy Research Working Paper 3366, accessed on 10th Oct 2015.
Davidović, M. (1989) Migracije u Srbiji: rezultati jednog istraživanja, Migracijske i etničke teme, Vo l6, No. 2, pp. 157-172.
European Commission, ECSC-EC-EAEC (2005) Key Data on Education in Europe 2005, Luxembourg: Office for Official
Publications of the European Communities, http://www.okm. gov.hu/doc/ upload/200601/key_data_2005.pdf, accessed on 5th
Oct 2009.
European Commission, Education, Audiovisual and Culture Executive Agency (2012) Key Data on Education in Europe 2012, P9 Eurydice, Brussels, Website: http://eacea,ec,europa,eu/ education/eurydice, accessed on 1th Sept 2015.
Gennaioli N., La Porta R., Lopez-de-Silanes, F., Shleifer, A. (2013) Human Capital and Regional Development, The Quarterly Journal of Economics, pp. 105–164.
Grečić, V. (2002) The Role of Migrant Professionals in the
Process of Transition in Yugoslavia, Migracije i tranzicija u Jugoslaviji, Vol. LIV, No. 3, pp. 253-271.
Hanushek, E. A. (2015) Why Standard Measures of Human Capital are Misleading, KDI Journal of Economic Policy, No. 37 (2), pp. 22–39.
Јоkić, V. (2013) Prоstоrni rаspоrеd i stаrоsnа strukturа kао fаktоr оgrаničеnjа (rаvnоmеrnоg) rаzvоја Srbiје, Аrhitеkturа i urbanizam, No. 38, pp. 17-32.
Jokić, V., Dželebdžić, O. (2014) Mаpirаnjе sоciјаlnе isključеnоsti – prоstоrnа dimеnziја stаrоsnе i оbrаzоvnе strukturе stаnоvništvа Srbiје, in Petrić, J. et al. (eds.) Obnova strateškog prostornog mišljenja, istraživanja i upravljanja u Srbiji 2, IAUS, Beograd, pp. 107-137.
Karahasan, B. López-Bazo, E (2013) The Spatial Distribution of Human Capital: Can It Really Be Explained by Regional
Differences in Market Access? International Regional Science Review No 36. (4), pp. 451-480.
Lucas, R. E. (1988) On the Mechanics of Economic Development, Journal of Monetary Economics No. 22, pp. 3-42.
Mitrović, M., Mitrović, I. (2015) The Role of Human Capital in
Increasing Competitiveness of the Serbian Economy, Synthesis 2015, Book of proceedings International scientific sonference of IT and Business-Related Research, Singidunum University, Belgrade.
Mirić, О. (2014) Unаprеđеnjе sistеmа strаtеškоg i оpеrаtivnоg plаnirаnjа u Rеpublici Srbiјi, Beograd: Еvrоpski pоkrеt Srbiје. Petrović, R. (1987) Društvo i stanovništvo – makrosociološki
i demografski aspekti razvoja Srbije, Beograd: Ekonomski institut.
Rapoport, H. (2002) Who is afraid of the brain drain? Human capital flight and growth in developing countries, Department of Economics, Bar-Ilan University, and CREDPR, Stanford University. Stanford Institute for Economic Policy Research,
http://web.stanford.edu/group/siepr/cgi-bin/siepr/?q=system/ files/shared/pubs/papers/briefs/policybrief_apr02.pdf, accessed on 6th Oct 2015.
Rodríguez-Pose, A., Tselios V. (2011) Mapping the European regional educational distribution, European Urban and Regional Studies, No. 18, pp. 358-374.
Rodríguez-Pose, A., Vilalta-Bufi, M. (2005) Education, migration,
and job satisfaction: the regional returns of human capital in the EU, Journal of Economic Geography, No. 5, pp. 545–566.
Statistical Office of the Republic of Serbia (SORS) (1999) Municipalities in Serbia, Belgrade: Statistical Office of the
Republic of Serbia.
Statistical Office of the Republic of Serbia (SORS) (2011)
Municipalities in Serbia, Belgrade: Statistical Office of the
Republic of Serbia.
Statistical Office of the Republic of Serbia (SORS) (2013), 2011 Census of Population, Households and Dwellimgs in the Republic of Serbia, Educational Attainment – special data processing
across age groups, Belgrade: Statistical Office of the Republic
of Serbia.
Stanković, V. (2014) Srbija u procesu spoljnih migracija,
Received October 2015; accepted in revised form December 2015. World Economic Forum (WEF) (2013) The Europe 2020
Competitiveness Report: Building a More Competitive Europe 2014, http://www.weforum.org/, accessed on 8th Oct 2015.
World Economic Forum (WEF) (2014) The Global Competitiveness Report 2013–2014, http://www.weforum.org/, accessed on 7th Oct 2015.
World Economic Forum (WEF) (2015) The Human Capital Report 2015, http://www.weforum.org/, accessed on 7th Oct