* Corresponding author. Tel: 886-3-4638800 ext 2515, Fax: 886-3-4638907 E-mail addresses: [email protected] (Y. M. Chen) © 2011 Growing Science Ltd. All rights reserved. doi: 10.5267/j.msl.2010.03.008
Contents lists available atGrowingScience
Management Science Letters
homepage: www.GrowingScience.com/msl
Social network analysis aided product development project management: IC Substrates case study
Yee Ming Chen a* and Mi-Yuan Chena
aDepartment of Industrial Engineering and Management,Yuan Ze University, Taiwan
A R T I C L E I N F O A B S T R A C T
Article history:
Received October 15 2010 Received in revised form 15 December 2010 Accepted 16 December 2010 Available online
16 December 2010
This paper proposes the social network analysis (SNA), to study interaction among various activities in a product development process (PDP). The implementation of SNA helps to measure the properties of information flow and identifies PDP activities and limitations. The findings of an exploratory research project which explores the potential of SNA, as an improve tool for visually mapping and analyzing the stakeholders relationships found across the IC substrates design/manufacturing’s PDP of the Unimicron Technology Corp. From the findings, the authors prescribe the necessary SNA recommendations to improve the social conditions within the PDP.
© 2011Growing Science Ltd. All rights reserved.
Keywords:
Social network analysis Stakeholder analysis Product development process SNA
PDP
1. Introduction
explores the potential of SNA, as an improve tool for visually mapping and analyzing the social relationships found across the integrated circuits (IC) substrates design/manufacturing’s PDP of the Unimicron Technology Corp in Taiwan. With a clear visualization of these relationships, the authors examine network maps to identify and understand barriers that are likely to restrict the successful identification of stakeholders' needs as a necessary factor for product innovation or development success. From the evaluation, the authors prescribe SNA specific recommendations to achieve higher levels of improvement, therefore, improve, and sustain their operations in the face of fiercely competitive and now deteriorated markets. The rest of the paper is organized as follows. In section 2, the research motivation and related theoretical background is illustrated. In section 3, the SNA procedure is proposed and a case study is employed to justify the proposed method. Finally, Section 4 is some conclusions reached by this paper.
2. Theoretical background and research motivations
PDP is a complex process composed of an integrated set of activities that collectively accomplish a defined objective—e.g., developing a new product (Browning et al., 2006). Product development processes have been modeled with a number of frameworks, including sets of activities, deliverables, and/or sequences of these components. We refer to the PDP of activities(denote A) and deliverables(denote D) as the PDP work (see Fig. 1).
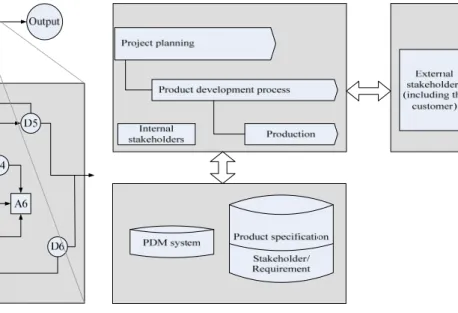
Fig. 1. The example of product development process Fig. 2. The PDP involvement in different stakeholders
Researchers have proposed a variety of models to explore iteration in PDP projects. Conventional network models such as program evaluation and review technique (PERT) (e.g., PMI, 2004) and critical path method (CPM), graphical evaluation and review technique (GERT) (Browning & Eppinger, 2002) and system dynamics models (e.g., Ford & Sterman, 2003), account for iteration explicitly. Product development projects, like projects in general, seek to do something new, once, rather than repeat a known process exactly. A distinct challenge in modeling such a situation is to anticipate which activities and deliverables will actually be needed. Today, in addition, product development is a complex process: the project manager continuously needs to consider new demands from different stakeholders and analyze how these demands can be fulfilled (Fig. 2).
Y-M. Chen and M-Y Chen / Management Science Letters 1 (2011)
109
management (PDM) system has lately been developed to support a more general handling of documents and objects created during a PDP. To support the dynamic phases, a model is needed that provides a common understanding of involved stakeholders, together with the requirements, functions and related sub-systems. In PDP, therefore, we need to identify the relevant stakeholders and their relationships with the product. Furthermore, we must determine the requirements of each stakeholder in a life cycle perspective. Normally, there are conflicting requirements from different stakeholders. These issues have to be negotiated and balanced in order to develop a competitive product. Therefore, we not only need to listen to customer's requirements, but also we need to consider both internal and external stakeholders' needs to create a well-balanced product.
For effectively managing the PDP project, it is more important to ensure rapid process improvement than to perform routine activities. At an interesting level of detail, PDP do not precede in a purely sequential fashion (Huchzermeier & Loch, 2001). The activities in a PDP interact by exchanging information. The structure of this information flow has a bearing on process efficiency and predictability (Hoffer et al., 2008). Therefore, PDP work can be described as a complex network of interactions, some of which precipitate a cascade of rework among activities. Models that highlight the characteristics of this network are helpful in improving our understanding of PDP and ultimately their efficiency and predictability. In this paper, we propose a methodology using SNA ability to map social relationships to aid in visualizing the mapping and analyzing PDP stakeholders. We use SNA to identify the role and influence of different stakeholders and stakeholder's categories according to their positions within the network. In trying to improve PDP, planners and managers become interested in how activities should be arranged within the process, how rework cascades through the process, cost and schedule tradeoffs. In particular, using SNA method to measure properties of information flow such as degree, centrality, etc provides a methodology to identify important product development tasks and interactions, information flow among two or more tasks, which constrain PDP execution. In this paper, our proposal is a systematic SNA method for improvement of new product development from an informational structure perspective. It can visualize the hierarchical structure of activities and rearrange the process for PDP.
2.1Social network analysis
SNA, as a technique, is the mapping and measuring the relationships and flow among stakeholders, organizations, and other information entities (Hanneman & Mark, 2005). SNA is based on an assumption of the importance of relationships among interacting units. Therefore, SNA techniques discover patterns of interaction among social actors in social networks. The social network perspective encompasses theories, models and applications, which are expressed in terms of relational of processes. According to Hanneman and Mark (2005), a process is an organized group of related activities that work together to create a result of value. Thus, PDP can be considered as a network of relationships among people, group, and other members. Social networks are comprised of actors, also referred to as ‘nodes’, who are tied to one another through socially meaningful relationships. Therefore, in this paper, we consider PDP as the nodes in the network while the links show relationships flows among the nodes. These relationships can then be analyzed for structural patterns that emerge among these actors. Thus, an analyst of social networks looks beyond attributes of individuals to examine the relationships among actors, how actors are positioned within a network, and how relationships are structured into overall network patterns (Roberts et al., 2000). Common SNA procedures include:
(1) Information flow analysis to determine the direction and strength of information flows through the network;
number of edges, linking a node to others and reveals the capacity of a node to be reached. The betweenness centrality focuses on the capacity of a node to be an intermediary between any two other nodes.
(3) The block grouping to discover key links between different subgroups in a network
2.2 SNA in IC substrate
Unimicron Technology Corp., established in Taiwan, is the leading professional printed circuit board(PCB) manufacturer in Taiwan, also ranked as number one worldwide. The company has production facilities in Taiwan and China. The major engineering services include multi-layer PCB and IC substrates design/manufacturing for international customers such as Nokia, Acer etc. The company was implementing a PDP program with a focus on improving the efficiency of engineering data flow in the PCB design/production chain. The design data was first released from an IC design firm, it is sent through an upstream IC packaging company, and then it is relayed to the PCB manufacturer. Such a sequential process inevitably compresses the development time of IC substrate, and can seriously delay the PDP project when any design change occurs, which is common in this industry. The PDP deployment enables direct communication with the customer (e.g. Nokia). It also results in intangible advantages to the downstream manufacturer such as early readiness and a balanced relationship with the IC packaging company. Technology roadmap exchange is another benefit of the program, through which the company can play a proactive role in understanding the stakeholders' needs on time. Therefore, we can obtain a longer lead-time for mass production and technology preparation.
3. Applications of SNA to PDP program evaluation
To employ SNA, we first, in here, identified the internal stakeholders involvement in the implementation of the effort based on our in-depth interviews. We asked the stakeholders to complete an internet survey to assess their interactions with the other stakeholders in the PDP program. The interviews took the document of a participant and it was capable of translating a participant's response (i.e. no; sometimes; often; very often; always) into a numerical value, allowing for direct input to the SNA software package.
3.1 Case Study
A case-study was conducted in order to explore the potential of SNA as an improved tool to identify the human barriers likely to restrict IC substrates product innovation from successfully occurring. Due to its size and complexity comprising of a vast social network of internal stakeholders only, a Unimicron Technology Corporation was identified and chosen to participate in the study. Hanneman and Mark (2005) suggested a four steps procedure for SNA implementation and the procedure is customized for the case study of this paper.
Step 1: Identify a strategic/operational of the company goals
The goals are to identify, to understand barriers, and to improve the processes by making the necessary decisions and increasing the corporation's abilities to innovate.
Step 2: Conduct in-depth interviews to capture data for the stakeholders’ meaningful relationship
Y-M. Chen and M-Y Chen / Management Science Letters 1 (2011)
111
software package. Data collection was undertaken via structured interviews. The aim of the questions was to reveal the strength of relationships found within the PDP. Table 1 shows the summary of the interactions and internal stakeholders’ relationships to be mapped in the next step.
Table 1
The internal stakeholders' interaction and their relationships
Stakeholders Activity Characteristic Relationship Type
Drawing measure (CAM group)
Transfers the design work Responsible for decompressing and editing the customer's design drawing
Transmission design drawing
Definition the design drawing Responsible for changing the customer's design drawing to the special-purpose machine platform
Level of the transmission design drawing leaves
Gauges and fills in the design drawing specification work
Responsible for the design drawing line width, the line-spacing and so on
Transmission design drawing basic information Preliminary design appraisal(Product design group)
Inspects the design drawing work
Responsible for the design drawing the preliminary assessment
Provides the service quoted price
Inspects the customer specification work
Responsible for inspecting customer's specification required
Transmission customer demand
Inspect and make a ability in the factory
Responsible for proposing customer's
specification, achieves the bilateral both acceptable scope
Bidirectional information transmission
Parameter establishing (Product conformity group)
Establish the procedure and the compensation value for the CAM group
Unidirectional
information transmission
Drills the work The procedure which drills the holes Unidirectional
information transmission
Layout the work Fill production which a product can one time produce
Bidirectional information transmission
Negative compensation work Responsible for compensating the film of the design drawing
Bidirectional information transmission
Process establishing(Product conformity group)
Select the PDP work Choose different sequences according to different products
Bidirectional information transmission
In-Plan process establishment Set up procedures Bidirectional information transmission
Manufacture operating condition Production parameter
establishment Production parameter to establish and reset
Bidirectional information transmission
In-Plane parameter setup In-Plane system establishment Bidirectional information transmission
Design drawing confirmation
(Product design group) After CAM group complete and confirm
Bidirectional information transmission
PDP work confirmation
(Product design group) The procedure is confirmed again
Bidirectional information transmission
Table 2
Matrix coding-Identified relationships
Stakeholder A B C D E F G H I J K L M N O P
Drawing measure (CAM group)
Transfers the design work A
Definition the design drawing B 1 1 1 1 1 1 1
Gauges and fills in the design drawing specification work C 1
Preliminary design appraisal(Product design group)
Inspects the design drawing work D 1 1 1 1 1 1
Inspects the customer specification work E 1 1 1 1 1 1 1 1
Inspect and make a ability in the factory F 1 1 1 1 1
Parameter establishing (Product conformity group) G 1 1 1 1
Drills the work H 1 1 1 1 1 1
Layout the work I 1 1
Negative compensation work J 1 1 1
Process establishing(Product conformity group)
Select the PDP work K
In-Plan process establishment L 1 1 1 1 1
Manufacture operating condition(Product conformity group)
Production parameter establishment M 1 1 1 1 1
Parameter system establishment N 1 1 1 1
Design drawing confirmation(Product design group) O 1 1
PDP work confirmation(Product design group) P 1 1 1 1
Step 3: Use a SNA software package visual map and analyze the results from the data gathering
process
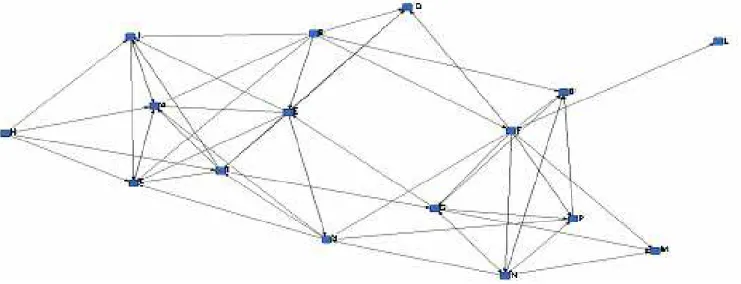
On completion of the data gathering process, the results are entered into a SNA package, UCINET (Scott, 2000), and the visual maps constructed. Fig. 3 displays the view of the SNA of the PDP program.
The bottom of Fig. 3 shows a network map of Unimicron Technology Corp’s internal stakeholders relationships. Each node is a stakeholder’s activity in the PDP. Lines between nodes indicate an information flow dependency between activities. The arrow shows the direction of information flow.
Step 4: Use a software package, quantitatively analyze and determine the centrality measures and groups within the network.
Y-M. Chen and M-Y Chen / Management Science Letters 1 (2011)
113
Fig. 3. View of the SNA
Therefore, there might be a room to improve the communication among stakeholders in the PDP program. In terms of degree centralities, the measures for activity D (i.e. Inspects the design drawing work) and activity E(i.e. Inspects the customer specification work) are all above average. It has a high level of activity compared with others in the network, in that it is in contact with the most activities or stakeholders. In terms of closeness centrality, activity H (i.e. Drills the work) is the most central organization. To reiterate, closeness centrality has to do with how quickly an actor can get in touch with others in the network. It is strategically situated to reach others. The measures of betweenness indicate that activity D is again the most central stakeholder. Compared to the activities with low betweenness measures, Inspects the design drawing work is more powerful in this network. This suggested there might be decompose activity D into two subgroups to improve the communication among subgroups in the PDP program.
project team contributed positively to the achievement of alignment of different requirements of key stakeholders. New process re-groups to two parallel operation process groups. This not only reduces the total PDP operation time from 21.46 minutes to 16~18 minutes (subject to group1:18.92minutes; group2:16.92minutes), but also it can relatively reduce the labor cost about 74.55% at the same time. Hence, the resulting provides strong support for the appropriateness of the improved PDP and contributes to the credibility of the findings. The SNA is found to be measured by having better PDP structure, and better levels for distribution of activities to perform processes, and users’ satisfaction.
4. Conclusions
This paper presents an empirical study on the implementation of SNA project as an improvement method for PDP program. The results indicate that we can reduce the product development time and associated cost through the implementation of SNA. Project managers can use the analysis to identify important or overloaded activities. They can also evaluate whether activities like stage gates and design reviews are acting as effective information flow regulators in the PDP. This approach provides a rigorous decision support tool for managers who must alter ideal activity sequences due to specific schedule, budget, and expertise constraints encountered on their projects.
Acknowledgment
This research work was sponsored by the National Science Council, R.O.C., under project number NSC 99-2622-E-155-005 -CC3. The authors would like to also thank the annonymous referees for their comments on eariler version of this work.
References
Browning, T. R., Fricke, E., & Negele, H. (2006). Key concepts in modeling product development
processes, Systems Engineering , 9(2), 104–128.
Browning, T. R. & Eppinger, S. D. (2002). Modeling impacts of process architecture on cost and
schedule risk in product development. IEEE Transactions On Engineering Management, 49(4),
428–442.
Durland, M. M., & Fredericks, K. (eds). (2005). New Directions For Evaluation: Social Network
Analysis in Program Evaluation. 107, San Francisco: Jossey-Bass.
Ford, D. N. & Sterman, J. D. (2003). Overcoming the 90% syndrome: Iteration management in
concurrent development projects, Concurrent Engineering Research Applications. 11, 177–186.
Hanneman, R. & Mark, R. (2005). Introduction to Social Network Methods, Riverside, CA:
University of California.
Huchzermeier, A. & Loch , C. H. (2001). Project management under risk: Using the real options
approach to evaluate flexibility in R&D. Management Science, 47(1), 85–101.
Hoffer, J. A., George, J. F. & Valacich, J. S. (2008). Modern systems analysis and design. Pearson
Education, Upper Saddle River, NJ.
PMI(2004), A Guide to the Project Management Body of Knowledge, 3rd ed. Newtown Square, PA:
Project Management Institute.
Roberts, T. L. J., Leigh, W. & Purvis, R. (2000). Perceptions of stakeholder involvement in the
implementation of system development methodologies. Journal of Computer Information
Systems, 40(3), 78-83.