Maria Inês Santos Silva
Bachelor Degree in Mechanical Engineering Sciences
Non-Destructive Testing for Polymer
Matrix Composites produced by
Additive Manufacturing
Thesis to obtain the Master Degree in Mechanical Engineering
Supervisor: Doctor Telmo Jorge Gomes dos Santos, Associate Professor with Habilitation, NOVA School of
Science and Technology
Co-Supervisor: Doctor Miguel Araújo Machado, Assistant Professor, NOVA School of Science and Technology
President: Doctor Carla Maria Moreira Machado
Examiner: Doctor Marta Isabel Pimenta Verdete da Silva Carvalho Examiner: Doctor Luís Filipe Soldado Granadeiro Rosado
Supervisor: Doctor Telmo Jorge Gomes dos Santos
Non-Destructive Testing for Polymer Matrix Composites produced by Additive Manufacturing
Copyright © 2020 Maria Inês Santos Silva
Faculdade de Ciências e Tecnologia, Universidade Nova de Lisboa
A Faculdade de Ciências e Tecnologia e a Universidade Nova de Lisboa têm o direito, perpétuo e sem limites geográficos, de arquivar e publicar esta dissertação através de exemplares impressos reproduzidos em papel ou de forma digital, ou por qualquer outro meio conhecido ou que venha a ser inventado, e de a divulgar através de repositórios científicos e de admitir a sua cópia e distribuição com objetivos educacionais ou de investigação, não comerciais, desde que seja dado
ACKNOWLEDGEMENTS
I would like to begin by thanking my master thesis supervisor, Professor Telmo Santos, for accepting me as his supervised student in the present research and for all his guidance and support during the past five years.
I also wish to thank Professor Miguel Machado, my master thesis co-supervisor, who also helped me get acquainted with this field of research and who has always shown availability and readiness to help me.
To the staff of the laboratories of the Mechanical Technology Group and to the master students and PhD students who have endlessly supported my work. A special mention to Tiago Rodrigues for all the help and advice given throughout the course.
To Professor João, who has inspired and helped me to pursue and achieve many of my academical deeds, and to Professor Carla Machado, for inviting me to assist one of the Mechanical and Industrial Engineering Department laboratories.
To Dr. Júlia Murta, for helping me realize that the solution to my problems lies within myself.
To Professor Pedro Vilaça and Professor Evgenii Malitckii, for accepting me as a researcher in their project and as their supervised PhD student.
To all the families I now belong to, through my volunteering work in organizations such as GASTagus and BEST Almada, that taught me the importance of interdependence and reciprocation, and that led me to a path of reinvention, of gratitude, empathy and inner growth.
To all my friends, and to those whom I came across during my journey. They all taught me something, among others, the importance of kindness, tolerance, and support for one another.
Above all, to my family and especially to my mother, my role model, who taught me the healing power of love, the true meaning of forgiveness and resiliency and the significance of having an inside-out approach in order to thrive and achieve peace of mind.
This work was funded by the Project POCI-01-0145-FEDER-016414 (FIBR3D), cofinanced by Programa Operacional Competitividade e Internacionalização and Programa Operacional Regional de Lisboa, through Fundo Europeu de Desenvolvimento Regional (FEDER) and by National Funds through Fundação para a Ciência e a
ABSTRACT
The increased use of composite materials produced by Additive Manufacturing (AM), in fields like automotive and aerospace, raises new demands in characterizing a variety of defects that may appear during its production and service life and which have an impact on the structural performance of the component. Conventional Non-destructive testing (NDT) cannot fulfil these new requirements, motivating the research and development of new, innovative approaches that increase the inspection reliability.
The purpose of this work is to apply and test the reliability of two innovative NDT techniques, Double Active Transient Thermography (DATT) and reflection mode Air-coupled Ultrasound (ACU), and its inspection parameters to evaluate polymer matrix composites produced by AM.
In the DATT experiments, the samples were excited by two heat sources, a cold flow and a heat flow, six different parameters were used (the instant for starting the cold flow and its duration, different defects and the influence of the lid, exposure time, curvature, and instant when the vortex is turned on) and the goal of developing this technique was to observe, with the same level of temperature contrast and at the same time, different defects at different depths and locations. In the ACU experiments, three parameters were studied (, d and dp), and the goal was to understand their effect in the reflection echo of
the wave.
The DATT results are promising, allowing an increased understanding of the influence of each parameter and a clearer observation of thethree defects with different locations and depths at the same time. The ACU results allow to understand the effect of the studied parameters but future improvements on equipment structure and assembly and the usage of different probes and samples will play a role in better understanding not only the wave’s behaviour but also the advantages of the technique.
RESUMO
O crescente uso de materiais compósitos produzidos por Fabrico Aditivo (FA), em indústrias como a automóvel e a aeroespacial, criam novas exigências na deteção e caracterização de defeitos que possam surgir durante a produção ou tempo de vida destes materiais e que podem comprometer o desempenho do componente. Os Ensaios Não Destrutivos (END) convencionais apresentam algumas limitações na inspeção destes materiais, pelo que é necessário estudar e desenvolver novas técnicas que permitam aumentar a fiabilidade da inspeção.
O objetivo desta tese foi o de implementar e testar a fiabilidade de duas técnicas END inovadoras, Double Active Transient Thermography (DATT) e Air-coupled Ultrasound (ACU), e os seus parâmetros de inspeção na caraterização de compósitos de matriz polimérica produzidos por FA.
Nas experiências de DATT, os provetes foram expostos a duas fontes de calor, uma fonte fria e uma quente, foram estudados seis parâmetros diferentes (o instante em que começa o frio e a sua duração, diferentes defeitos e a influência da tampa, tempo de exposição, curvatura, e instante em que se liga o vortex) e o objetivo destes testes foi o de observar, com o mesmo nível de contraste térmico e ao mesmo tempo, diferentes defeitos com diferentes espessuras e localizações. Nas experiências de ACU, foram estudados três parâmetros diferentes (, d and dp), com o objetivo de compreender o seu
efeito na onda refletida.
Os resultados de DATT são promissores e permitem uma melhor compreensão da influência de cada parâmetro e a observação dos vários defeitos ao mesmo tempo. Os resultados de ACU permitem compreender o efeito dos parâmetros, mas futuras melhorias na estrutura do equipamento e novos ensaios com diferentes sondas e diferentes provetes contribuirão para a compreensão do comportamento da onda e as vantagens da técnica.
CONTENTS
Acknowledgements ... v Abstract ... vii Key-words ... vii Resumo ... ix Palavras-chave ... ix CONTENTS ... xiList of figures ... xiii
List of tables ... xvii
Abbreviations ... xix Symbols ... xx 1 – Introduction ... 1 1.1 – Motivation ... 1 1.2 – Goals ... 3 1.3 – Thesis Structure ... 4 2 – Literature review ... 5 2.1 – Introduction ... 5
2.2 – Polymer Matrix Composites ... 6
2.2.1 – Polymer Matrix ... 7
2.2.2 – Reinforcement Material ... 8
2.2.3 – Defects in PMC... 9
2.3 – Additive Manufacturing ... 10
2.3.1 – Fused Filament Fabrication ... 10
2.3.2 - State-of-the-art of composites produced by AM ... 13
2.4 – Active Pulsed Thermography ... 14
2.4.1 – Properties and types of techniques ... 15
2.4.2 – Thermography data ... 18
2.4.3 – Limitations of IRT ... 18
2.4.4 - State-of-the-art of PT for Polymer Matrix Composites evaluation ... 19
2.5 – Air-Coupled Ultrasound ... 20
2.5.1 – Physics of Ultrasound ... 21
2.5.2 – Equipment and transducers ... 24
2.5.3 – Air-Coupled Ultrasound ... 25
2.5.4 – Data presentation ... 26
2.5.5 – Limitations of UT ... 26
2.5.6 - State-of-the-art of ACU for Polymer Matrix Composites evaluation ... 27
2.6 – Chapter resume and conclusions remarks ... 27
3.4 – Sample One ... 33 3.5 – Sample Two ... 35 3.6 – Sample Three ... 36 3.7 – Sample Four ... 37 3.8 – Sample Five ... 37 3.9 – Chapter resume ... 38
4 – Results and discussion of DATT characterization tests ... 39
4.1 – Introduction ... 39
4.2 – Sample One (1P) inspection ... 40
4.2.1 – Group One ... 40
4.2.2 – Group Two ... 44
4.2.3 – Group Three ... 46
4.2.4 – Group Four ... 49
4.3 – Sample One (1C) inspection... 51
4.4 – Cold flow experiment with air (Sample One) ... 54
4.4.1 – Group One ... 54
4.4.2 – Group Two ... 55
4.5 – Experiment with cooling fluid Regex G13 (Sample One) ... 56
4.6 – Sample Two inspection ... 58
4.7 – Chapter resume ... 60
5 – Results and discussion of ACU characterization tests ... 63
5.1 – Introduction ... 63
5.2 – ACU setup ... 63
5.3 – Sample Four inspection ... 65
5.3.1 – Group One ... 66
5.3.2 – Group Two ... 70
5.4 – Sample Three inspection ... 72
5.5 – Sample Five inspection ... 74
5.6 – Chapter resume ... 75
6 – Conclusions and suggestions for future works ... 77
6.1 – Conclusions ... 77
6.2 – Suggestions for future works ... 79
References ... 81
Appendix ... 89
Appendix 1. Common matrix materials and its properties ... 89
LIST OF FIGURES
Figure 2.1 - Example of the structure of a fibre-reinforced composite. ... 7
Figure 2.2 - Examples of defects in PMC. ... 9
Figure 2.3 - Schematic representation of a typical FFF setup. ... 10
Figure 2.4 - Examples of FFF parameters. ... 12
Figure 2.5 - Example of defects found in FFF: a) voids b) ‘staircase’ effect c) warping. ... 13
Figure 2.6 - Schematic view of a pulsed thermography inspection. ... 17
Figure 2.7 - Reflection and transmission modes. ... 18
Figure 2.8 - Examples of IRT applications a) temperature distribution of plastics in injection moulds b) temperature distribution of composite materials. ... 18
Figure 2.9 - Schematic representation of a) refraction b) diffraction. ... 24
Figure 2.10 - Ultrasound system. ... 25
Figure 2.11 - Methods of testing a) transmission b) shear wave c) plate waves. ... 26
Figure 3.1 – DATT schematic experiment setup ... 30
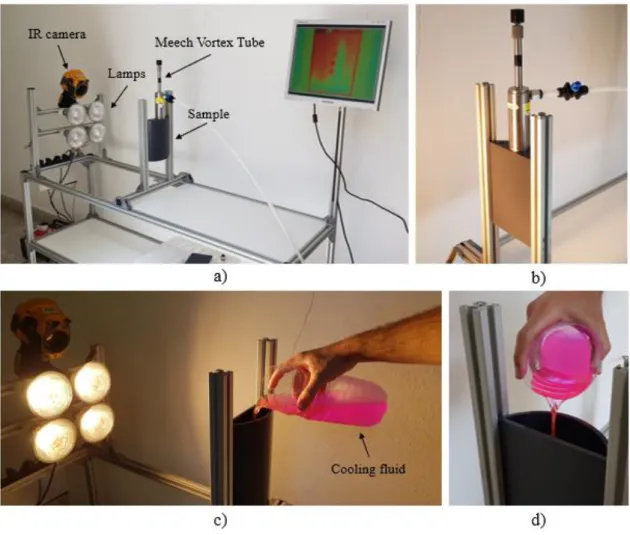
Figure 3.2 – a) DATT setup with the vortex b) Meech Vortex Tube and sample c) DATT setup with the cooling fluid d) pouring the cooling fluid into the sample. ... 31
Figure 3.3 - ACU equipment a) real experiment set-up in reflection mode b) equipment used and sample c) schematic experiment set up. ... 32
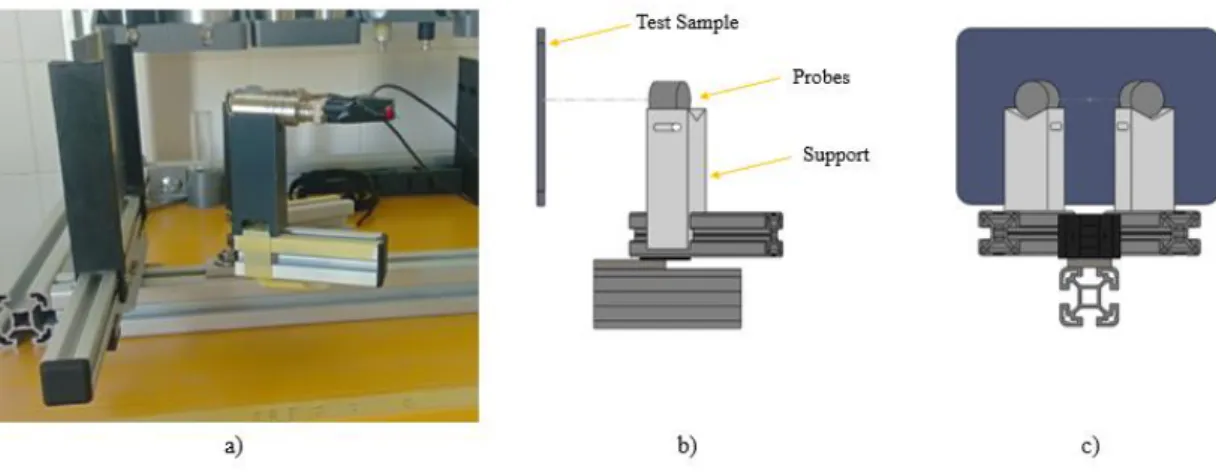
Figure 3.4 - ACU equipment a) placement of the probes b) flaw detector. ... 33
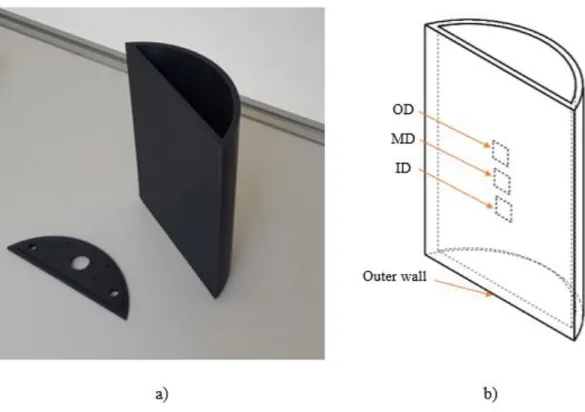
Figure 3.5 - Sample One a) printed version b) model showing the delaminations with the legend of the defects and outer wall. ... 34
Figure 3.6 - Representation of the delaminations of plain side, regarding their depths and locations. ... 34
Figure 3.7 - Lid with one entrance for the cold flow. ... 35
Figure 3.8 - Sample two a) printed model b) dimensions. ... 35
Figure 3.9 - Model of Sample two displaying the a) depth and b) position of each defect. ... 36
Figure 3.10 - Sample three a) dimensions b) model displaying the delamination. ... 37
Figure 3.11 - Sample four a) dimensions b) model displaying the metal washer. ... 37
Figure 3.12 - Sample five a) thickness and b) width of each area c) printed model. ... 38
Figure 4.1 - Nine groups of temperature values from the nine points of Sample One. ... 42
Figure 4.2 – Test 1 - evolution of temperature in each point. ... 42
Figure 4.3 – Results of Sample 1P Group one: a) outer defect 20s b) outer defect 30s c) middle defect 20s d) middle defect 30s e) inner defect 20s f) inner defect 30s. ... 43
Figure 4.6 – Test 3 - evolution of temperature in each point. ... 47
Figure 4.7 - Results of Sample 1P Group three: a) outer defect 20s b) middle defect 20s c) inner defect 20s. ... 47
Figure 4.8 – Comparison between DATT and conventional APT a) Tests 2 and 8 b) Tests 3 and 8 c) Tests 4 and 8. ... 48
Figure 4.9 – Test 2 – evolution of temperature in each point. ... 50
Figure 4.10 – Results of Sample 1P Group four: a) test 1 b) test 2. ... 50
Figure 4.11 - Sample 1P Group four thermograms where all three defects appear at the same time a) 37 s after the beginning of the hot flow for test 1 b) 38 s after the beginning of the hot flow for test 2. ... 51
Figure 4.12 – Sample 1P Group three thermograms (reference test – hot only): a) instant of 21 s where the outer defect has the higher contrast b) instant of 36 s where the outer and middle defect can be seen c) instant of 50 s where the three defects can hardly be seen. ... 51
Figure 4.13 - Test 5 - evolution of temperature in each point. ... 52
Figure 4.14 - Results of Sample 1C: a) outer defect 20s b) outer defect 30s c) middle defect 20s d) middle defect 30s e) inner defect 20s f) inner defect 30s. ... 53
Figure 4.15 - Group one cold flow experiment a) areas measured b) temperature variations across the four areas. ... 55
Figure 4.16 - Temperature variation results a) test 1 b) test 2. ... 56
Figure 4.17 - Results of experiments with cooling fluid: a) temperature variation b) outer defect c) middle defect d) inner defect. ... 57
Figure 4.18 - Twelve groups of temperature values from the twelve points of Sample two. ... 59
Figure 4.19 – Test 1 - evolution of temperature in each point. ... 59
Figure 4.20 - Results of Sample 2: a) test 1 b) test 2. ... 60
Figure 5.1 - Reflection mode set-up a) variables , d and dp b) relation between and d. ... 64
Figure 5.2 - Sample four experiments a) group one b) group two. ... 65
Figure 5.3 - Areas of sample four group one... 67
Figure 5.4 - Results of the experiment in which d=215.7 mm. ... 69
Figure 5.5 - Areas of sample four group two. ... 70
Figure 5.6 - Results of the experiment in which d=162.2 mm. ... 71
Figure 5.7 - Areas of sample three. ... 72
Figure 5.8 - Results of the experiment in which d=73.6 mm. ... 73
Figure 5.9 - Areas of sample three. ... 74
LIST OF TABLES
Table 2.1 - Thermal properties of different plastics. ... 15
Table 2.2 – Sound wave properties of three mediums. ... 22
Table 2.3 – Reflection and transmission coefficients of four boundaries. ... 23
Table 4.1 - First six experiments of Group one – 20 s. ... 41
Table 4.2 - Last six experiments of Group one – 30 s. ... 41
Table 4.3 - Experiments of Group three – 20 s... 46
Table 4.4 - Experiments of Group four. ... 49
Table 4.5 - Experiments of Group two. ... 55
Table 4.6 - Experiments with cooling fluid. ... 56
Table 4.7 - Experiments of Sample two. ... 58
Table 5.1 – Range of possible values for each variable. ... 65
Table 5.2 - Experiments of Sample Four Group One. ... 66
ABBREVIATIONS
3D Three dimensional
ABS Acrylonitrile Butadiene Styrene ACU Air-coupled Ultrasound
AM Additive Manufacturing DIC Digital Image Correlation FDM Fused Deposition Modelling
FFF Fused Filament Fabrication IR Infrared
IRT Infrared Thermography LIT Lock-In Thermography NDE Non-Destructive Evaluation NDT Non-Destructive Testing Ni-Ti Nickel Titanium alloy
PA Polyamide PC Polycarbonate
PEEK Polyetheretherketone PEI Polyetherimide PLA Polylactic Acid
PMC Polymer Matrix Composites PT Pulsed Thermography PTFE Polytetrafluoroethylene
UT Ultrasound
α Thermal diffusivity [mm2/s] ε Emissivity [] λ Wavelength [m] ρ Density [kg/m3] A Sound amplitude [dB] cp Specific heat [J/kgK] 𝑒𝑡 Effusiveness [] f Frequency [Hz] 𝑘 Thermal conductivity [W/mK] c Velocity [m/s] Z Acoustic impedance [kg/m2/s]
1 – INTRODUCTION
1.1 – Motivation
Recently, there has been an increased focus on the development of materials, like high-strength steels or composites produced by Additive Manufacturing (AM), in order to satisfy industrial and economic requirements, for example, in aerospace and automotive industries, where they seek reduced weight components, with enhanced strength, which improve productivity and fuel economy and reduce CO2 emissions. This
progress raises new demands in characterizing a variety of defects that may appear during its production and service life and which have an impact on the component’s performance [1,2].
Examples of defects found in AM produced parts are delaminations between matrix layers [3], lack of bonding between the matrix and reinforcements [4], porosities, either as an inter-filament discontinuity or path discontinuity [5–7], support material which is trapped between internal surfaces [5], dimensional inaccuracy [8], thickness divergence [8], fibre and other reinforcements’ misalignments [9], poor surface finish, such as the staircase defect [8,10], part warpage [8], and vibrations and ringing [11]. Among the consequences associated with these defects, there are the loss of mechanical properties,
There are currently some challenges regarding the inspection of composites, mainly in polymer matrix composites, such as the complexity of the produced model [12], the inspection accessibility (for example, in pipe and tube manufacturing), the exposure to heat and other relevant properties of plastics, such as low thermal and electrical conductivity [13].
According to a review made by Gholizadeh [14], many NDT techniques are used to evaluate composites (contact and non-contact), like Ultrasonic testing (traditional and other variants, such as Air-coupled Ultrasound), Electromagnetic testing, Eddy Current testing, Magnetic Particle testing, Dye Penetrant Testing, Infrared Thermography testing, Radiographic testing, Visual Inspection and Shearography Testing, to name a few.
Visual Inspection (VI) is a cheap and rather fast technique but it is very limited to superficial defects. Magnetic particles has the limitation of only working with ferromagnetic materials and Dye Penetrant testing only allows access to one surface of the sample and the inspection of surface defects, does not give the depth sizing and it is a time-consuming technique, not to mention the environmental concerns of its usage [14].
As a laser optical method, Shearography testing has the great advantage of detecting the degree of strain concentrations around a defect and it is less susceptible to noise, compared to other NDT techniques. However, it is an expensive technique and the characterization of defects that are not delaminations is extremely difficult [14].
One of the most used technique is Ultrasonic testing (UT), which has the advantage of great scan speed, good resolution, flaw detecting capabilities as well as the possibility to be used in the field. Moreover, there is a variant, Air-coupled Ultrasound (ACU), which works in low frequencies, typically between 50 – 400 kHz, which doesn’t require a contact coupling as the sound propagates through the air and can be used to inspect composites, since it avoids problems that arise from direct contact between the probe and sample. However, UT has a demanding assembly, requires skilled operators, especially to accurately interpret the results, and the defect size needs to be bigger than the wavelength to be detectable. Additionally, ACU represents a much slower inspection and doesn’t allow the inspection of defects on the surface or very far from it [2].
Another NDT technique used is Eddy Current testing (EC), which is based on the electromagnetic induction phenomena produced by a current in a conductive material [15,16]. These current’s strength relies in the electrical conductivity and magnetic permeability of the material, which are characteristics of electric conductor materials, so they are unfeasible for most composite materials with a polymeric matrix, although they
can be applied, in some extent, to inspect polymeric matrix with carbon fibres. However, unlike Infrared Thermography testing and Ultrasonic Testing, EC has proven to be a suitable technique for high-speed inspection of composites made of carbon fibres and reinforced plastic [17].
A NDT technique that can overcome some of the limitations presented so far is Infrared thermography testing (IRT), which acquires and processes the thermal response of an object, when excited by infrared radiation, and that uses an infrared camera and thermographic image software to acquire the surface temperature distribution of the object (thermograms) through time and space. Through the contrasts of temperature presented in these thermal images, it can be detected and identified superficial and internal defects in the object [18]. The main optically stimulated thermography techniques are active Lock-in Thermography (LIT) and active Pulsed Thermography (PT). LIT is an active IRT technique that detects and characterizes the internal damage based on the analysis of the thermal response of an object when stimulated by a thermal source with periodic modulation (stable state response). It requires few heat, as the thermal energy is concentrated in only one angular frequency, but is a rather slow technique, with expensive equipment, and the defects are only visible at a certain modulation frequency. PT is a technique where the detection and characterization of the internal damage are based on the analysis of the thermal response of an object when stimulated by a thermal pulse (transient response). It is a faster type of inspection and the thermal stimulation is shorter than the one from LIT but can only be used in composites that can be heated and may not be very effective at detecting internal defects at greater thickness.
One innovative technique that can overcome some of the problems mentioned is a variant of active IRT which uses two sources of heat, one of them being cold, which was addressed by Lei et al [19], and is a focal point of the present thesis.
Therefore, by continuing to research in order to understand and expand the techniques capability, we may increase awareness on how composite materials produced by AM may react in production and in-service phases and in turn, improve them for demanding jobs.
1.2 – Goals
The purpose of this work is to apply and test the reliability of different NDT techniques and its inspection parameters to evaluate composite material components
▪ The development and analysis of a new variant of the NDT technique Active Pulsed Thermography, Double Active Transient Thermography (DATT), to evaluate the temperature distribution and contrasts in the object surface and defect zone, through the application of heat and cold fluxes in different stages and different surfaces;
▪ The analysis of the NDT technique Air-coupled Ultrasound to evaluate the technique’s resolution capability for different defects and different geometries in reflection mode.
1.3 – Thesis Structure
The present thesis is divided into six chapters and two appendixes:
▪ Chapter 2 presents an overview of the state of the art for the characterization of polymer matrix composites produced by AM using the two NDT techniques; ▪ Chapter 3 gives a brief description of the equipment necessary and set-up used in
each NDT technique, and the five samples and their defects, produced by AM; ▪ Chapter 4 presents and discusses the results achieved with the Double Active
Transient Thermography experiments;
▪ Chapter 5 presents and discusses the results achieved with the Air-coupled Ultrasound experiments;
▪ Chapter 6 summarizes the main conclusions of the work presented and outlines topics and recommendations for future research;
2 – LITERATURE REVIEW
2.1 – Introduction
This chapter reflects the bibliographical review made with the goal of characterizing the two NDT techniques used to evaluate composites and polymer matrix composites produced by AM.
Composites have existed for a long time, since Ancient Mesopotamia and Egypt Civilization, with different types being developed for several applications. In the beginning of the 20th century, plastics like vinyl and polystyrene were developed, and Bakelite was created, marking the first step towards the modern era of composites, and around 1935, it was introduced the first glass fibre. Thenceforth, new materials were developed, with great advancements being made during World War II, until nowadays, with developments in industries like aerospace and renewable energy [20].
In turn, AM technology has been around for almost four decades, emerging in 1981, with the first 3D printing patent being awarded to Dr. Hideo Kodama, in Japan, who developed a photopolymer rapid prototyping technique, using UV light, to build up a solid,
businesses were developed and perfected. AM has become more and more industrialized, with applications in fields such as medical industry, aerospace industry, transportation industry and consumer products industry [21].
Non-Destructive Testing (NDT) have existed for many centuries, starting with Visual Inspection (VI), which was used to inspect components like clay pots and to inspect metal surfaces with chalk, for instance. One NDT technology, the Ultrasound technique (UT), started being studied for the purpose of detecting flaws in metal objects by soviet scientist Sergei Y. Sokolov, around the 1930’s, inspired by the sonar technique. During World War II, pulsed ultrasonic testing using a pulse-echo technique was developed and patented and in the decades that followed, UT was refined and became a trusted resource by manufacturers for flaw detection as well as an imaging technique for medical diagnostic. The UT equipment and techniques have evolved significantly, with digital instruments being developed to provide stable calibration, precise measurements, data retention, and screenshot sharing capabilities [22].
Regarding Infrared Thermography Testing (IRT), another NDT technology, most techniques were patented also in the Second World War, with applications in fields such as machinery and communications, and later developed to analyse temperature distribution in automobile brakes and overheating of electronic components, among others. Infrared radiation was firstly discovered in the beginning of the 19th century, by Sir W. Herschel, when he was conducting Sir Isaac Newton’s experiment decomposing white light into a range of colours. From then on, many inventions appeared, for example, the thermocouple, in 1829, and the first infrared image, in 1840, by means of a evaporograph [23]. Infrared-based tools are used for the inspection of components and structures in fields like wind power, automotive and aerospace industries, for example, to detect layer structures, delaminations and inserts in wind turbines blades and carbon fibre reinforced plastics (CFRPs) [18].
2.2 – Polymer Matrix Composites
A composite material is a material formed by two or more elements, usually different types of materials, which has properties that are different from those of the individual elements. One of the elements is the matrix material, a continuous phase, which can be metal, inorganic non-metallic or polymer, according to Wang et al. [24]. The other
element is the reinforcement material or auxiliary material, a dispersed phase, which can be of various types, such as particles, flakes and fibres [24].
Polymer Matrix Composite (PMC) is an example of composite material, in which the matrix is made of polymer and the reinforcement material, usually a fibre, is added to the matrix, as shown in Figure 2.1, toimprove the properties of polymers for higher-strength demand applications, making it a stronger and less ductile material [25].
Figure 2.1 - Example of the structure of a fibre-reinforced composite [24].
Some advantages of PMC are the ease of fabrication, compared to the other types of matrices; the ease of connection between polymers and fibres, the enhanced properties that result from the bonding and the low density of polymers [26].
2.2.1 – Polymer Matrix
Usually, additives are added to the resin matrix to improve or add properties that the polymer may not have, such as enhancing the stability of the polymer, as a prevention to the aging and degeneration of the material, enhancing the mechanical properties, improving processing performance, reducing the melting temperature and increasing the mobility and flexibility of the materials [24].
The most common matrix materials used are thermoplastics, which soften and melt when heated, such as Fluoropolymers, Polyamides, Polyesters, Styrenics, Polyimides, and Polyethers; and thermosets.
In Appendix 1, it is given a brief description of some matrix materials, namely, Polytetrafluoroethylene (PTFE), Polyamide (PA), Polylactic Acid (PLA), Acrylonitrile Butadiene Styrene (ABS), Polyetherimide (PEI), Polyetheretherketone (PEEK), Polycarbonate (PC) and Epoxy [27].
2.2.2 – Reinforcement Material
This material improves significantly the mechanical properties of the polymer matrix. The most effective are the fibrous materials, such as carbon fibres, glass fibres, alumina fibres, silicon carbide fibres and organic fibres, because their strength and elastic modulus is much higher than of the matrix material.
Some examples of reinforcement materials used are:
▪ Nickel Titanium alloy, Ni-Ti, which is composed of titanium (Ti) and nickel (Ni), in the same amount, and that are used in biomedical applications and structure engineering, for example, due to its properties, shape memory effect (free recovery) and super elasticity;
▪ Aromatic polyamide fibres (aramid), for example, Kevlar® (developed and traded by Dupont USA), which is an organic fibre used in demanding applications, such as ropes and cables, bulletproof vests, tennis strings, and snowboards, because of its toughness, thermal stability and corrosion endurance, among other features;
▪ Glass Fibre, an inorganic non-metallic material, in which silicon dioxide (SiO2)
is the main component of glass, used in fields like transportation and aerospace, among others, and with good performance, for example, noninflammability, resistance to heat-and toughness;
▪ Carbon Fibre, which is mostly composed of carbon atoms and with potential benefits due to its high stiffness and tensile strength, low weight, corrosion resistance and good conductivity. It is very used in fields like civil engineering and aerospace.
2.2.3 – Defects in PMC
There are many defects that occur during production and/or during the material’s operating life. Defects in fibres, such as fibre breakage, wrinkling and misalignment, induced in the production of the PMC material, may weaken them, and introduce stress concentrations in the material, therefore, reducing the mechanical properties.
In production and storage phases, problems in the matrix can arise due to contamination that leads to poor cure, because of incorrect storage, temperature and humidity. Porosity is also a concern, that can coalesce and become a void, with the outcome of introducing internal stress concentrations, and/or create delaminations in the material [28].
In-service, when the materials are subjected to cycles and loads, defects like matrix cracking and separation between fibre and matrix, which can lead to water infiltration and therefore, reduction in modulus; delamination, that can reduce the compressive strength and increase the chance of buckling, and fibre breakage, which reduces the tensile performance. Figure 2.2 represents some of the defects mentioned above [29].
a)
b)
2.3 – Additive Manufacturing
Additive Manufacturing (AM), also referred to as 3D printing, is the technology that manufactures an object by depositing layers of material [30].
According to the American Society for Testing and Materials (ASTM) group “ASTM F42 – Additive Manufacturing”, there are 7 categories of AM: VAT Photopolymerization, Material Jetting, Binder Jetting, Material Extrusion, Powder Bed Fusion, Sheet Lamination and Directed Energy Deposition [31].
2.3.1 – Fused Filament Fabrication
Fused Filament Fabrication (FFF) is a material extrusion process commonly used for 3D printing which uses a thermoplastic material. Although the terminology Fused Deposition Modelling (FDM®) is most used, it is trademarked by the company Stratasys
[32].
As shown in Figure 2.3, in this technology, the material, in the form of a filament, is loaded into a heating chamber, where it liquefies forming a high-viscosity material and then moves as a continuous stream through the extrusion nozzle.
Figure 2.3 - Schematic representation of a typical FFF setup [33].
The first layer of the material is extruded into the print bed, followed by other layers that are added on top of previous ones. The material is bonded to itself or another
Fig. STYLEREF 1 \s 2 SEQ Fig. \* ARABIC \s 1 3. Schematic representation of a typical FFF setup [3]
secondary material, usually by means of temperature control, to form a solid structure. There is usually the inclusion of support structures for supporting complex figures, during the fabrication process [34].
2.3.1.1 – Materials used in FFF
The current commercial materials directly processed by this material extrusion process are ABS, PLA, PA, PC, PEI and PEEK, according to Bourell et al. [35]. Material extrusion processes use thermoplastic polymers, most commonly amorphous thermoplastics, because they melt in a variety of temperatures, becoming ideally viscous for material extrusion through a 0.2–0.5 mm diameter nozzle [35].
Regarding PMC, according to the same authors, there are already commercial machines capable of printing composite filaments, for example, embedding continuous carbon fibre, chopped carbon fibre, Kevlar, and fiberglass in a nylon matrix [35].
2.3.1.2 – Parameters of FFF
The process parameters of FFF commonly considered are [36]:
▪ The layer thickness, the height of the deposited layer made by the FFF nozzle; ▪ The orientation of the part, defined as how the part should be positioned when
produced;
▪ The raster angle, the orientation of material deposition on the XY-plane; ▪ The raster width, the thickness of material deposition on the XY-plane;
▪ The material feed rate, the requested speed for the 4 axis, X, Y, Z and E. X, Y and Z are used for moving the printhead in space and E is used for the amount of filament to be moved into the printing head;
▪ The printing temperature, the temperature at which the filament turns into a viscous substance that can be extruded;
▪ The print bed temperature, the temperature of the surface where the extruded material will adhere, and the structure will be built layer-by-layer.
Figure 2.4 - Examples of FFF parameters [37]. 2.3.1.3 – Defects and disadvantages of FFF
The most common defects found in the FFF process are voids, anisotropy, poor surface quality, distortion and warping, dimensional and geometric deviations. Three of these defects are shown in Figure 2.5.
▪ Voids are areas with lack of material, usually between the deposited tracks of extruded material, though they’re rare and very dependent on the material (for example, Nylon) (Figure 2.5 a));
▪ Anisotropy is a feature of materials in which their physical and mechanical properties vary along different directions;
▪ Poor surface finish/quality vary from material and appears on finish pieces. One example is the staircase effect shown in Figure 2.5 b);
▪ Distortion and warping of the pieces happen due to expansion and contraction of the plastics, as they are printed, which causes the print to bend up from the build plate (Figure 2.5 c));
▪ Dimensional and geometric deviations are defects that can be crucial for functional parts [35,38].
a) b) c)
Figure 2.5 - Example of defects found in FFF: a) voids [39] b) ‘staircase’ effect
[40] c) warping [41].
Apart from the common defects presented, printing materials with FFF technology are limited by the nozzle radius and clogging, which can compromise the quality of the final model, the accuracy and speed, and the quality of the printed material is still low, comparing to other processes to manufacture composite materials, like automated tape laying and out-of-autoclave process, to improve the final part quality [35,38].
2.3.2 - State-of-the-art of composites produced by AM
Recent papers have been published regarding the advancements made to produce composites through AM, especially to meet the new requirements of the aerospace industry.
In their latest paper, Díaz-García et al. [42], present a laboratory scale methodology to extrude magnetic composite filaments using FFF, and which X-Ray Tomography results show to produce soft and consistent continuous filaments with great dimensional control, suitable for different polymer matrices and other particle types, rather than magnetic ones.
A recent paper written by Chang et al. [43], refers that continuous carbon fibre reinforced poly-ether-ether-ketone composites, produced by the Laser-assisted Laminated Object Manufacturing technique and hot press postprocessing, exhibit superior mechanical than carbon fibre reinforced thermoplastics produced by FFF.
produce thermal protection systems using AM. The results show that four of the eleven formulations present composites with enhanced features.
One review of the state-of-the-art of fibre-reinforced polymers was made by Blok, et
al.[45], in which they characterise and compare the mechanical properties of parts
produced by short fibre printing method and continuous fibre printing method, in which the latter provides better properties. They conclude that the quality of parts produced by FFF are still of low quality, with common formation of voids and limited control when placing a fibre, when compared to classical aerospace composites; that reinforced filament show great improvement in mechanical properties, when compared to unreinforced ones, but they still need to be higher if to be used in structural materials; and that there is lack of coherent information available regarding how different printing parameters affect the quality of the final product and detailed information of defects that may occur.
Another review was made by Brenken et al. [46], where they summarise the reporting of mechanical properties both for short and continuous fibres. As with the previous authors, they also mention the void formation, as well as fibre damage, that occur during the printing process and which prevent discontinuous fibre-reinforced polymers to be on the level of aircraft aluminium, but that continuous fibres show strengths close to the aluminium ones, although proper wetting of the fibres needs to be made during printing as well as increasing the fibre volume fraction. They outline some advantages of AM, such as time and cost savings, but refer that, to date, few relevant works in the area have been published.
2.4 – Active Pulsed Thermography
Infrared thermography testing (IRT) is a NDT technique that acquires and processes the thermal response of an object, excited by infrared radiation, and that uses an infrared camera and thermographic image software to produce thermograms (thermal images) where there can be detected and identified internal defects through the contrasts of temperature presented [18].
2.4.1 – Properties and types of techniques
The most important thermophysical properties when inspecting an object using IRT are thermal diffusivity, thermal conductivity, density, specific heat capacity, effusiveness and emissivity.
▪ Thermal conductivity, 𝑘 [W/mK], measures the ability of a material to conduct heat;
▪ Density, 𝜌 [kg/m3], is a measure of mass per volume unit;
▪ Specific heat, 𝑐𝑝 [J/kgK], at constant pressure, is the amount of heat necessary in one unit of mass of a substance in order to increase one unit of its temperature; ▪ Thermal diffusivity, 𝛼 [mm2/s], measures the ability of heat transfer of a material
when compared with its ability to store that heat. It is inversely proportional to 𝜌 and 𝑐𝑝 and directly proportional to k;
▪ Effusiveness, 𝑒𝑡, is a measure of the capability of a material to exchange heat with
its surrounding;
▪ Emissivity, ε, is the capability of a material to emit thermal radiation. Table 2.1 shows the thermal properties of some plastics.
Table 2.1 - Thermal properties of different plastics [47].
Material Specific Heat [J/kgK] Thermal Conductivity [W/mK] Thermal Diffusivity [mm2s-1] ABS 1468 0.18 0.12 PC 1300 0.23 0.15 PA 1700 0.26 0.13 PEEK 1340 0.25 0.14
Regarding the thermography techniques, there are two basic types:
▪ Passive thermography, where there is a difference between the natural temperature of the object and the defect, which must be sufficiently high to be detected by the IR sensor. One limitation is that, when the difference of
temperature between the object and defect is zero, the technique cannot detect the flaws;
▪ Active thermography, where there’s an external thermal stimulation of the object to create a heat flux within the material, which generates a difference in temperature between the object and defect and allows the detection and characterization of defects.
The main optically stimulated thermography techniques are active Lock-in Thermography and active Pulsed Thermography or Transient Thermography. There are other secondary techniques that are special cases of the two main ones and that differ in the thermal stimulation of the object and the thermographic data analysis.
Lock-In Thermography (LIT) is an active IRT technique that detects and characterizes the internal damage based on the analysis of the thermal response of an object when stimulated by a thermal source with periodic modulation (stable state response). This technique uses a continuous heat source that generates a thermal wave that propagates to the interior of the inspected object and reveals the presence of defects after reaching a stable state. This technique requires lower heat, as the thermal energy is concentrated in only one angular frequency and the determination of the depth of the defect is made almost direct since it’s inversely proportional to the angular frequency.
Pulsed Thermography (PT) is a technique where the detection and characterization of the internal damage is based on the analysis of the thermal response of an object when stimulated by a thermal pulse (transient response). It is a faster type of inspection and the thermal stimulation is shorter than the one from LIT. The surface of the object can be heated by a thermal pulse and then measure its temperature decay, or it can be applied a cold pulse and measure the increase in its temperature. Figure 2.6shows a schematic view of a PT system configuration consisting of lamps, specimen, camera and processing computer [48].
Figure 2.6 - Schematic view of a pulsed thermography inspection [48].
The heat sources produce thermal pulses that can last seconds depending on the thickness and material of the object. Examples of this sources are incandescent light bulbs and heat radiators. The IR cameras are designed to operate in specific infrared spectrum bands. Fluke Ti400, the camera used in the present work, has a spectral range of 7.5 to 14 µm [49].
There are two configurations when inspecting an object using PT: reflection mode and transmission mode, as shown in Figure 2.7 [50].
▪ In reflection mode, the IR camera and the heat sources are placed in the same side. The advantage of this configuration is that only one side of the object needs to be visible, but it’s limited to the detection of superficial defects; ▪ In transmission mode, the IR camera and the heat sources are placed in
different sides. It can detect subsurface defects although there’s loss of thickness depth notion and requires access to both surfaces. This configuration represents a great limitation when it isn’t possible to access both surfaces, for example, when inspecting pipes.
18
Figure 2.7 - Reflection and transmission modes [50].
2.4.2 – Thermography data
As mentioned before, IR cameras allow the acquisition of thermograms that show the temperature distribution in a specific object. The next pair of images show two examples where IRT can be used, namely in the plastics industry (Figure 2.8 a)) and aerospace industry (Figure 2.8 b)).
a) b)
Figure 2.8 - Examples of IRT applications a) temperature distribution of plastics in
injection moulds [51] b) temperature distribution of composite materials [52].
2.4.3 – Limitations of IRT
Although this type of inspection is a fast one, easy and safe to use, with many possible applications, there can be losses of heat, mainly through atmospheric absorption, it’s difficult to obtain an uniform heating, even more when using curvilinear objects, and for greater material thickness, the inspection may take more time and the defect may not be
Fig. . Reflection and transmission modes ADDIN CSL_CITATION {"citationItems":[{"id":"ITEM- 1","itemData":{"author":[{"dropping- particle":"","family":"Koui","given":"M.","non-dropping- particle":"","parse-names":false,"suffix":""},{"dropping- particle":"","family":"Theodorakeas","given":"P.","non-dropping- particle":"","parse-names":false,"suffix":""}],"id":"ITEM-1","issued":{"date-parts":[["0"]]},"title":"The use of pulsed thermography for the investigation of art and cultural heritage objects","type":"article"},"uris":["http://www.mendeley.com/document s/?uuid=24b043c9-ebea-3f61-b244-f5eedc164f38"]}],"mendeley":{"formattedCitation":"[40]","plainTextF ormattedCitation":"[40]","previouslyFormattedCitation":"[40]"},"prope rties":{"noteIndex":0},"schema":"https://github.com/citation-style-language/schema/raw/master/csl-citation.json"}[40]
Fig. .. Examples of IRT applications a) temperature distribution of plastics in injection molds ADDIN CSL_CITATION
{"citationItems":[{"id":"ITEM- 1","itemData":{"URL":"https://www.infratec.eu/thermography/industries-applications/plastics-
industry/","accessed":{"date-parts":[["2019","12","27"]]},"id":"ITEM-1","issued":{"date-parts":[["0"]]},"title":"Thermography in the plastics industry |
InfraTec","type":"webpage"},"uris":["http://www.mendeley.com/documents/?uuid=99540e7a-17dd-
395a-bb27-219648699085"]}],"mendeley":{"formattedCitation":"[41]","plainTextFormattedCitation":"[41]","pr eviouslyFormattedCitation":"[41]"},"properties":{"noteIndex":0},"schema":"https://github.com/citati
on-style-language/schema/raw/master/csl-citation.json"}[41] b) temperature distribution of composite materials ADDIN CSL_CITATION
{"citationItems":[{"id":"ITEM- 1","itemData":{"URL":"https://www.infratec.eu/thermography/industries-applications/aerospace-
industry/","accessed":{"date-parts":[["2019","12","27"]]},"id":"ITEM-1","issued":{"date-parts":[["0"]]},"title":"Thermography in the aerospace industry |
InfraTec","type":"webpage"},"uris":["http://www.mendeley.com/documents/?uuid=259baa8f-dc69-
3515-b251-visible through the camera, mostly with transmission mode, as the heat travels through the sample thickness [1].
Additionally, passive thermography only works with enough natural thermal contrast between the object and defect. LIT takes longer to inspect, when compared to PT and the defects are only visible at a certain modulation frequency. PT has the limitation of requiring, sometimes, the prior knowledge of the defect free zones [23].
2.4.4 - State-of-the-art of PT for Polymer Matrix Composites evaluation
Unlike Air-Coupled Ultrasound (ACU), infrared thermography has more research published, especially to test aerospace components. Not all articles are mentioned in this dissertation, as it was given priority to the most recent ones that address the use of this technique in PMC or composites in general to determine its detection limit and resolution and also the ones where the material is produced by AM.
In an experiment, published by Machado et al. [2], four different samples were evaluated, a flat PLA matrix sample with voids of 0.5 mm thickness to simulate delaminations, a similar sample but with a curved shape, a PLA matrix with three 0.1 mm thickness PTFE tapes and a PLA sample with two 0.25 mm NiTi wires imbedded. The fourth sample was evaluated using passive IRT, which clearly showed the contrast between defect and free zone. The other samples were evaluated using PT, both with reflection and transmission mode, where the defects were clearly visible with good resolution. With reflection mode, there were a clearer contrast, but the heat distribution was more heterogenic. For transmission mode, there was a more uniform heat distribution, but the void resolution was poorer and there was the need to access both sides of the object. With the curved sample, comparing with the flat one, in reflection mode there was a bigger lack of heat uniformity, which lowered the delaminations detection capability, but in transmission mode, the difference was insignificant.
In an article published by Cramer [53], of NASA Langley Research Center, it is mentioned the use of active PT for rapid, large-area inspection of complex composite structures used for aeronautics and space vehicles. They show an example of qualification of manufactured parts using IRT, a CFRP component of the Space Shuttle where it is
bonding They also use IRT for on-orbit inspection of manned vehicles and the International Space Station (ISS) using the solar heating as thermal source.
In an article published by Dattoma et al. [54], two T-shaped stringers and three laminated flat plates, made up of CFRP, were investigated through reflection mode, to identify the optimal configuration for defect detection. For the T-shape stringers, there were various set-up configurations with different distances between lamps, lamps and the object and between the camera and the object. For the laminated flat plates, there were used four halogen cameras and the distance between lamps and object were 100 cm; the experiments were performed with different heating and acquisition times and different distance between camera and object.
Lei et al. [19], conducted an experiment regarding three different stimulation techniques, PT (as reference), LIT and Liquid Nitrogen cooling, which was poured directly onto the surface of the sample, a steel specimen with flat-bottom voids with different depths and sizes, in reflection mode. The researchers concluded that all three techniques show parts of the defects, with the most detectable being those with higher diameter to depth ratio, and that with Liquid Nitrogen cooling, the defects only appeared at the beginning of the cooling process, probably due to the high conductivity of steel. In future researches, they propose analysing different types of specimens, changing the method of pouring the Liquid Nitrogen and to test the application of heat on one side of the object and cooling on the other side.
Additionally, Pastuszak [55] investigated the ability of PT to detect defects in Glass Fibre Reinforced Plastics (GFRP) cylindrical panels and proved the effectiveness of the technique to test curved composite structures and that it can be successfully simulated through numerical simulation.
2.5 – Air-Coupled Ultrasound
Ultrasonic testing (UT) characterizes the physical condition of an object through the use of high-frequency sound waves. The frequencies used for UT are higher than the limit of human hearing, usually between 0.5 and 25 MHz [56].
Ultrasonic technology is used in critical safety-related and quality-related applications, in industries like aerospace, marine and automobile, more specifically, in
manufacturing, weld inspection, infrastructures and in-service testing, and also in the biomedical field for diagnostic imaging and medical research.
2.5.1 – Physics of Ultrasound
Ultrasonic waves, or mechanical vibrations, are originated by the alternate compression and rarefaction zones produced by the vibration of the elementary particles that constitute the material. They can propagate through solid, liquid and gas mediums but not through a vacuum. The waves are described by a sinusoidal wave equation with amplitude A [dB], frequency f [Hz], wavelength λ [m] and velocity c [m/s]. The velocity of sound waves is fixed in a specific medium and the wavelength is of great importance when identifying a discontinuity [57].
In ultrasonic inspection, the technique’s ability to locate discontinuities is usually described by its sensitivity, which is the capacity of locating small discontinuities, and by its resolution, which is the capacity of the system to locate discontinuities that are close together with the material or near its surface. Both these terms increase with higher frequency, or shorter wavelengths. The ability to detect discontinuities by ultrasound are also affected by many other variables [57].
There are other features of sound wave important for UT, such as its attenuation, acoustic impedance, reflection and transmission coefficients, Snell’s law and critical angles:
▪ Attenuation is the reduction of the sound intensity / pressure, due to factors such as the sound reflecting in other secondary directions and its energy being converted into other forms of energy. The acoustic attenuation varies with the material and frequency;
▪ Acoustic impedance, 𝑍 [kg.m-2.s-1], reflects the resistance met by an
ultrasound beam, when it goes through a medium, and depends on the density of the medium, 𝜌 [kg/m3], and the speed of the sound wave, 𝑐 [m/s], as shown
in Equation 1;
▪ Reflection coefficient, R, indicates how much of the sound wave is reflected when it passes through the boundary between mediums 1 and 2 and it’s dependent on the acoustic impedance of each medium, as shown in Equation 2 (in terms of sound pressure);
𝑅 =𝑍2− 𝑍1
𝑍2+ 𝑍1 2
▪ Transmission coefficient, T, indicates how much of the sound wave is transmitted when it passes through the boundary between mediums 1 and 2 and it’s dependent on the acoustic impedance of each medium, as shown in Equation 3 (in terms of sound pressure);
𝑇 = 2𝑍2 𝑍2+ 𝑍1
3 ▪ Snell’s Law describes the relationship between the angles and velocities of
the waves. Through this formula, the first critical angle can be calculated; ▪ Critical angle is the angle of incidence in which the refracted wave has a
refraction angle of 90º. Above this critical value, the refracted wave will suffer an internal reflection.
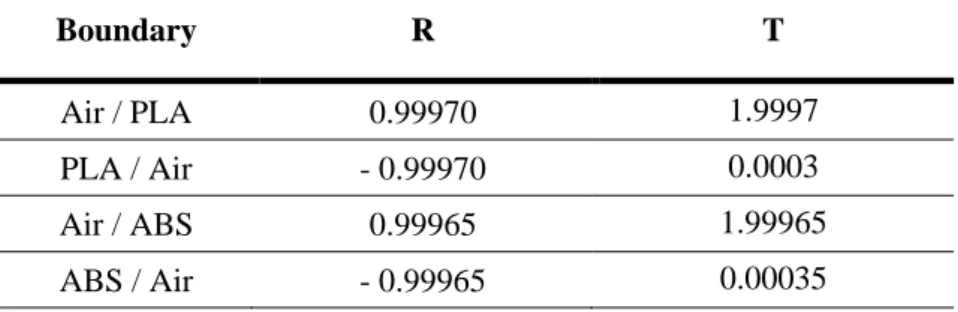
Table 2.3 presents the reflection and transmission coefficients of four types of boundaries, Air / PLA, PLA / Air, Air / ABS and ABS / Air, based on the values of Table 2.2 (air values at room temperature), which reflects the difficulty to transmit a sound beam across Air – PLA – Air and Air – ABS – Air. The reflection coefficient values are high because of the great difference of acoustic impedance between the air and the PLA.
Table 2.2 – Sound wave properties of three mediums [58,59].
Medium ρ [kg/m3] c [m/s] Z [kg.m-2.s-1]
ABS 1050 2250 2362500
PLA 1240 2220 2752800
Table 2.3 – Reflection and transmission coefficients of four boundaries. Boundary R T Air / PLA 0.99970 1.9997 PLA / Air - 0.99970 0.0003 Air / ABS 0.99965 1.99965 ABS / Air - 0.99965 0.00035
Regarding the sound waves propagation, the basic types are longitudinal waves (the most important waves for Air-coupled Ultrasound), where the trajectory of the waves is parallel to the direction of its oscillation and can propagate through solids, liquids and gases; and transverse waves, where the trajectory of the waves is at right angles with the direction of its oscillation and can propagate only through solids. The velocity of the sound wave can be calculated through Equation 4, given the medium’s frequency, f [Hz], and wavelength, λ [m].
𝑐 = 𝑓λ 4
In the air, the sound travels in the direction of the wave, although in solids, there can occur vibrations in other directions, so there are many more possible modes of wave propagation, useful for UT. Two of these modes are briefly presented in Appendix 2.
When the waves encounter a boundary with another medium with different acoustic properties (like air) or a discontinuity, there are different scenarios that may occur [57]:
▪ Some of the sound waves are reflected to the source and some are transmitted to the other medium, stablishing a relationship between reflected and transmitted sound dependent on the acoustic impedance;
▪ The beam falls obliquely into the surface, where some of the sound waves are reflected to the source and some are refracted, because of Snell’s Law. In this case, reflected sound encounters variation in angle and intensity and in case the beam reaches the surface with critical angle, as mentioned before, the angle of refraction will be 90º (Figure 2.9 a));
a)
b)
Figure 2.9 - Schematic representation of a) refraction [60] b) diffraction [61].
For the sound to be reflected and, therefore, the defect detected, the wavelength of the ultrasound must be smaller than the dimension of the defect. Otherwise, instead of reflection there will be diffraction. By analysing this behaviour and by knowing the travel time, the speed of propagation of the sound in the medium being inspected and the angle of emission, it is possible to find evidence of discontinuities.
2.5.2 – Equipment and transducers
In a general way, the UT equipment is composed of a transducer, pulser/receiver and a display device, as shown in Figure 2.10. The pulser/receiver is an electronic device that can produce high voltage electrical pulses. An ultrasonic transducer converts electrical energy into mechanical vibrations that propagate through the materials and again into electrical energy upon the reflected wave, which is then shown on the display device. During the inspection, the transducer is typically separated from the object by an ultrasonic couplant, which facilitates the transmission of sound between the transducer and the object, to avoid attenuation effects (because of the air) and acoustic impedance [62].
Fig. STYLEREF 1 \s 2 SEQ Fig. \* ARABIC \s 1 7. Schematic representation of a) refraction ADDIN CSL_CITATION {"citationItems":[{"id":"ITEM-
1","itemData":{"URL":"https://www.britannica.com/science/light/Reflection-and- refraction","accessed":{"date-parts":[["2020","1","5"]]},"id":"ITEM-1","issued":{"date-parts":[["0"]]},"title":"Light - Reflection and refraction | Britannica","type":"webpage"},"uris":["http://www.mendeley.com/documents/?uui
d=f3578f65-6deb-380e-8261-09f63d83f3c3"]}],"mendeley":{"formattedCitation":"[34]","plainTextFormattedCit ation":"[34]","previouslyFormattedCitation":"[34]"},"properties":{"noteIndex":0},
"schema":"https://github.com/citation-style-language/schema/raw/master/csl-citation.json"}[34] b) diffraction ADDIN CSL_CITATION
{"citationItems":[{"id":"ITEM-1","itemData":{"URL":"https://sites.google.com/site/wavebehaviourraft/diffraction
","accessed":{"date-parts":[["2020","1","5"]]},"id":"ITEM-1","issued":{"date-parts":[["0"]]},"title":"Diffraction - Wave Behaviour
RAFT","type":"webpage"},"uris":["http://www.mendeley.com/documents/?uuid=5 a2806de-a42a-3d8a-9716-581e339b5281"]}],"mendeley":{"formattedCitation":"[35]","plainTextFormattedC itation":"[35]","previouslyFormattedCitation":"[35]"},"properties":{"noteIndex":0 },"schema":"https://github.com/citation-style-language/schema/raw/master/csl-citation.json"}[35]
Figure 2.10 - Ultrasound system [62].
There exist various types of ultrasonic transducers, such as contact transducers, immersion transducers, angle beam transducers, delay line transducers and dual element transducers. Dual element transducers are composed of two elements, a transmitter and a receiver, which are assembled on a delay line at a small angle to create a crossbeam sound path in the test material. They are commonly used for thickness measurements of thin materials, high-temperature testing, since most duals will tolerate contact with hot surfaces, and for flaw detection in rough-surfaced castings [57].
2.5.3 – Air-Coupled Ultrasound
Air-coupled Ultrasound (ACU) has different equipment than the conventional Ultrasound because it’s a non-contact technique and uses the surrounding air as couplant. Air-Coupled transducers are dual element transducers that work as transmitter and receiver. They usually operate at frequencies between 50 and 400 kHz and can be used for evaluating materials such as foams, plastics and composites. The most used methods of testing are transmission, shear waves and plate waves, as shown in Figure 2.11. Air-Coupled Ultrasound (ACU) has the great advantage of using the surrounding air as the ultrasonic couplant, identifying defects such as voids, cracks and disbonds in a wide variety of water-incompatible materials [63].
Fig. STYLEREF 1 \s 2 SEQ Fig. \* ARABIC \s 1 8. Ultrasound system ADDIN CSL_CITATION
{"citationItems":[{"id":"ITEM- 1","itemData":{"URL":"https://www.nde-ed.org/EducationResources/CommunityCollege/Ultrasonics/In troduction/description.htm","accessed":{"date- parts":[["2019","11","28"]]},"id":"ITEM-1","issued":{"date-parts":[["0"]]},"title":"Introduction to Ultrasonic Testing","type":"webpage"},"uris":["http://www.mendeley.co m/documents/?uuid=d0f8ac07-6c86-303c-9a50-efefda5be8da"]}],"mendeley":{"formattedCitation":"[36]","pla inTextFormattedCitation":"[36]","previouslyFormattedCitatio n":"[36]"},"properties":{"noteIndex":0},"schema":"https://gith ub.com/citation-style-language/schema/raw/master/csl-citation.json"}[36]
Figure 2.11 - Methods of testing a) transmission b) shear wave c) plate waves [63].
2.5.4 – Data presentation
The data from the inspection can be presented in different formats that provide different ways of evaluating the region inspected.
▪ A-scan plots the amount of received ultrasonic energy as a function of time; ▪ B-scan provides a two-dimensional graphic presentation (linear scanning) that
plots the linear position of the transducer as a function of time, providing information about the size and the depth of a defect;
▪ C-scan presents a two-dimensional presentation (XY scanning), in which the location and size of discontinuities identified through the scanning are displayed in a top view of the material surface under test, allowing for an integrity diagnosis.
2.5.5 – Limitations of UT
Although Ultrasound Testing has high penetration capacity, good resolution, access to instantaneous results, high sensitivity to subsurface and in volume discontinuities, among other advantages, it is very sensitive to coupling, detection may require experienced operators and it’s inadequate for complex geometries and materials with high acoustic attenuation coefficients, such as cast iron.
Fig. STYLEREF 1 \s 2 SEQ Fig. \* ARABIC \s 1 9. Methods of testing a) transmission b) shear wave c) plate waves ADDIN CSL_CITATION
{"citationItems":[{"id":"ITEM-1","itemData":{"URL":"https://www.ndt.net/article/wcndt00/papers/idn507/id n507.htm","accessed":{"date-parts":[["2019","12","27"]]},"id":"ITEM-1","issued":{"date-parts":[["0"]]},"title":"Air-coupled Ultrasound - A Millennial Review","type":"webpage"},"uris":["http://www.mendeley.com/documents/?u uid=c8b3a6d8-8557-33f5-9376-655f3841aa9d"]}],"mendeley":{"formattedCitation":"[37]","plainTextFormatt edCitation":"[37]","previouslyFormattedCitation":"[37]"},"properties":{"noteI ndex":0},"schema":"https://github.com/citation-style-language/schema/raw/master/csl-citation.json"}[37]
![Figure 2.4 - Examples of FFF parameters [37].](https://thumb-eu.123doks.com/thumbv2/123dok_br/15470549.1034117/32.892.251.669.103.415/figure-examples-of-fff-parameters.webp)
![Figure 2.6 - Schematic view of a pulsed thermography inspection [48].](https://thumb-eu.123doks.com/thumbv2/123dok_br/15470549.1034117/37.892.197.699.114.341/figure-schematic-view-pulsed-thermography-inspection.webp)
![Figure 2.8 - Examples of IRT applications a) temperature distribution of plastics in injection moulds [51] b) temperature distribution of composite materials [52].](https://thumb-eu.123doks.com/thumbv2/123dok_br/15470549.1034117/38.892.134.784.608.856/examples-applications-temperature-distribution-injection-temperature-distribution-composite.webp)
![Figure 2.9 - Schematic representation of a) refraction [60] b) diffraction [61].](https://thumb-eu.123doks.com/thumbv2/123dok_br/15470549.1034117/44.892.166.724.138.361/figure-schematic-representation-refraction-b-diffraction.webp)
![Figure 2.11 - Methods of testing a) transmission b) shear wave c) plate waves [63].](https://thumb-eu.123doks.com/thumbv2/123dok_br/15470549.1034117/46.892.167.734.118.364/figure-methods-testing-transmission-shear-wave-plate-waves.webp)
![Figure 3.4 - ACU equipment a) placement of the probes b) flaw detector [68].](https://thumb-eu.123doks.com/thumbv2/123dok_br/15470549.1034117/53.892.182.754.110.418/figure-acu-equipment-placement-probes-b-flaw-detector.webp)