American Journal of Agricultural and Biological Science 2 (2): 106-117, 2007 ISSN 1557-4989
© 2007 Science Publications
Corresponding Author: Abdel Ghaly, Professor, Department of Process Engineering and Applied Science, Dalhousie University, Halifax Nova Scotia, Canada; Tel: (902) 494-6014; Fax: (902) 420-7639.
Potential Environmental and Health Impacts of High Land
Application of Cheese Whey
Ghaly, A. E., N. S. Mahmoud, D. G. Rushton and F. Arab Department of Process Engineering and Applied Science Dalhousie University, Halifax, Nova Scotia, Canada B3J 2X4
Abstract: A laboratory scale experiment was carried out to study the transformation and transport of nitrogenous compounds in soils receiving high application rates of cheese whey (twice the nitrogen requirement for crops). The experimental apparatus consists of 36 soil columns constructed of 20 cm inside diameter PVC pipes. Three types of soil (sandy loam, loam and sandy clay loam) and three soil depths (60, 120, 180 cm) were studied. The average monthly rainfall for the summer period in Halifax was used. The nitrogen in the soil was subject to biological transformations and downward movement in the soil. There were indications of the mineralization and nitrification processes taking place in the soil. The soil type and depth appeared to affect these processes. The ammonia volatilization occurred during the first 75 days with most (90 %) of the NH3 loss taking place during the first 30 days. The
amount of nitrogen losses to the air is about 3.41 kg/ha (0.59% of the total nitrogen). The amount of organic nitrogen lost in the leachates was 3.0-4.14 kg/ha (0.52-0.71% of the total nitrogen) whereas the amount of inorganic nitrogen (ammonium nitrogen, nitrate nitrogen and nitrate nitrogen) lost in the leachates was 18.63-24.09 kg/ha (3.54-4.56% of the total nitrogen). The presence of nitrite nitrogen in the leachate at high concentrations is a potential health hazard. Although cheese whey has been reported to have the potential to improve soil conditions, excess application has the potential of degrading soils and causing health problems. Additional research is, therefore, needed to better characterize the physical and chemical characteristics of soils receiving continuous high applications of cheese whey and their impact on crop yield and the qualities of groundwater and air.
Key words: Soil, cheese whey, land application, nitrate, nitrite, ammonium, organic nitrogen, health, environment
INTRODUCTION
Cheese whey is a by-product of the cheese making industry which contains approximately 5% lactose, 1.5% nitrogenous compounds, 0.8% minerals and small amounts of vitamins. It has been estimated that approximately 139 billion kilograms of whey are produced annually worldwide, of which about 35.2 and 3.1 billion kilograms are produced in the United States of America and Canada, respectively[1]. Ghaly and Singh[2] reported that only a little over one half of the whey produced is utilized mainly in the form of dried whey powder or as a liquid in hog feeding. The whey powder industry barely recovers its production cost because of poor markets and high energy expenditure[3] and feeding liquid whey to hogs is uneconomical due to high trucking costs[4]. Several value added products have been produced from cheese whey using various fermentation techniques. These included: single cell
protein[5-8], ethanol[9], organic acids[10], biopolymers[11], anti-icers[12,13] and biodegradable plastics[14]. Although, these processes have been proven to be technically feasible, they are still far from being economical.
Am. J. Agri. & Biol., 2 (2): 106-117, 2007
into these plants has, therefore, been panned by many municipalities[4]. Thus, land application of whey remains the ultimate end disposal.
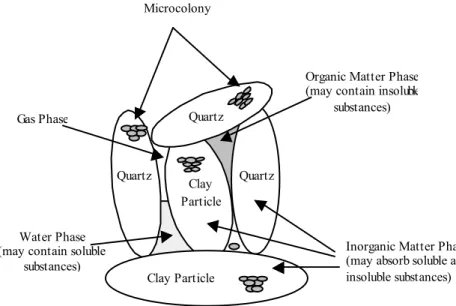
Soil consists of four phases (Fig. 1): gas phase (15-35%), water phase (15-35%) inorganic solids phase (38-45%) and organic solids phase (5-12%). Nutrients in cheese whey are distributed among the four phases in relation to their volatility, solubility and ion exchange capacity. When applied in large quantities at the soil surface, cheese whey will penetrate the soil surface and fill the pores in the soil. Its movement through the subsurface layer of the soil will be largely governed by the processes of advection, dispersion, sorption and transformation as well as the soil characteristics and the concentration and characteristics of its compounds[17]. Therefore, cheese whey should only be used as a valuable soil amendment and be applied onto the land in such a way as to minimize its negative environmental impact. Since nitrogen in cheese whey is water soluble and as such is subject to biological transformations, maximum whey application rates should be based on nitrogen loading that: (a) will be most effectively used by crops, (b) will cause no damage to crops and (c) will not result in excessive nitrogen concentrations in groundwater. Thus, more information is needed on the environmental impact of large quantities of whey being applied onto the soil. Understanding nitrogen transformation and transport in agricultural soils is paramount.
The objectives of this study were to (a) investigate
the whey nitrogen transformation and transport in three Nova Scotian agricultural soils receiving high whey application rates, (b) to evaluate the efficiency of the soil adsorption mechanism and (c) to determine the potential environmental and health impacts of land disposal of cheese whey.
MATERIALS AND METHODS
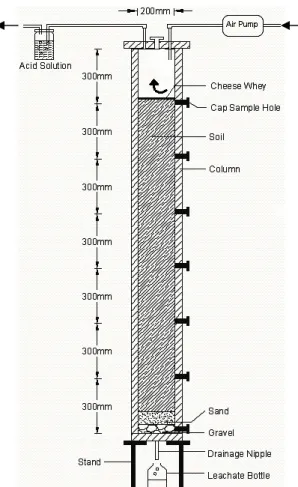
Experimental apparatus: Thirty six columns were constructed using Polyvinyl chloride (PVC) pipes of 20 cm inside diameter. Three sets of columns (lengths of 90, 150 and 210 cm) were built, with 12 columns in each set. The bottom of each column was closed with a circular PVC plate of 220 mm diameter, sealed with epoxy cement and screwed to obtain a water tight fit. A plastic nipple was mounted in a 6 mm diameter hole drilled at the center of the column bottom which provided a port for the collection of leachate water. Holes (30 mm diameter) were drilled at the side of each column at 300 mm intervals and plugged with screw stoppers. They were used as ports for the collection of soil samples at the end of the experiment. A hole drilled at the centre of each lid and plugged with a stopper was used to add water to the column when needed. Two other holes were drilled in lid and fitted with plastic nipples. These nipples were fitted with inlet and outlet tubes so that air could be circulated through the top of the columns for the removal of volatilized ammonia
Clay Particle Clay Particle
Quartz Quartz Quartz
Organic Matter Phase (may contain insoluble
substances)
Inorganic Matter Phase (may absorb soluble and insoluble substances) Gas Phase
Water Phase (may contain soluble
substances)
Microcolony
Am. J. Agri. & Biol., 2 (2): 106-117, 2007
(NH3). The outlet tube was connected to a BOD bottle
containing a standard acid solution (1 N HCL) for trapping the ammonia released from the cheese whey. A 5 cm gravel zone followed by 5 cm sand zone were constructed at the bottom of each column. Soils were then placed in the columns to predetermined heights (60, 120 or 180 cm). A 30 cm space was left at the top of each column above the soil surface for whey and water applications and ammonia volatilization. A detailed description of one soil column is presented in Fig. 2.
Fig. 2: Schematic diagram of the 210 cm high soil column
Cheese whey collection: Cheddar cheese whey was acquired from Farmer's Dairy Cheese Plant in Truro, Nova Scotia. It was collected in a 200 L tank, thoroughly mixed and then placed in 40 L plastic bags. The cheese whey bags weretransported to the Waste Management Laboratory at Dalhousie University in Halifax, Nova Scotia and stored in a freezer at -18°C. Prior to being applied to the soil, the cheese whey was removed from the freezer and allowed to thaw at room
temperature for 24 hours. Some characteristics of the whey are shown in Table 1.
Table 1: Characteristics of the cheese whey used in the study
Parameter Measured Value
Total Solids (mg/L) 56800 Volatile Solids (mg/L) 46850
Ash (mg/L) 9950
Total Chemical Oxygen Demand (mg/L) 78850 Soluble Chemical Oxygen Demand (mg/L) 58040 Total Nitrogen (mg/L) 1820 Organic Nitrogen (mg/L) 1765 Ammonium Nitrogen (mg/L) 25 Nitrite Nitrogen (mg/L) 2 Nitrate Nitrogen (mg/L) 28 Phosphorus (mg/L) 468
pH 5.9
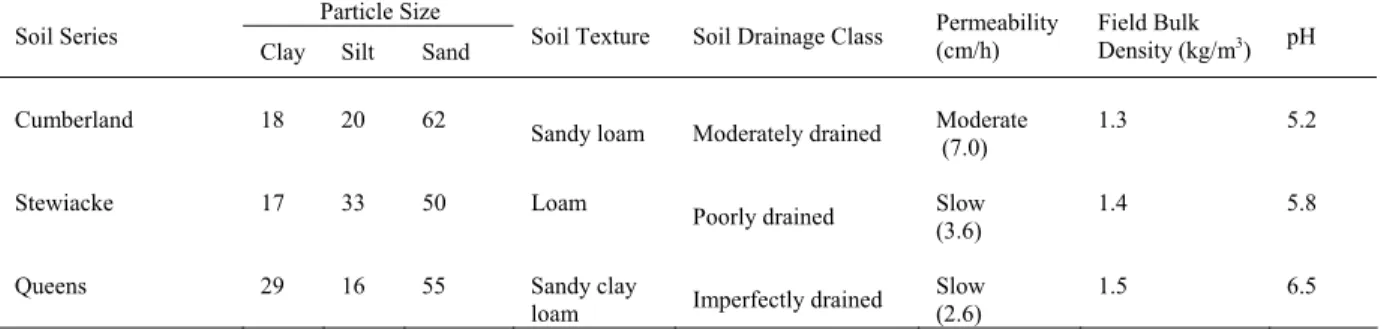
Soil collection ad analysis: Three Nova Scotian soils were used in this study: Cumberland, Stewiacke and Queens series. The top vegetal and trash cover of the soil was scraped away and the soil was collected with a shovel to a depth of 30 cm. Approximately 40 kg of soil were placed in a heavy duty (0.6 mm thick) polyethylene bag. Twenty bags of each type of soil (800 kg) were collected and transported from the collection sites to the Waste Management Laboratory at Dalhousie University in Halifax, Nova Scotia. Undisturbed soil samples were also collected at 30 cm depth for bulk density measurements. Particle size distribution was performed on the samples using the mechanical and hydrometer methods as recommended by Black et al.
[18]
. The three soils were found to be different from each other and were classified as sandy loam, loam and sandy clay loam as shown in Table 2.
Rainfall simulation and application: Using precipitation data issued by Environment Canada[19], the average monthly rainfall accumulations for the months of May to September were calculated as shown in Table 3. The five-month span was selected on the basis that it represents the average growing/harvesting season in Nova Scotia during which the microbial population in the soil is active. The average monthly rainfall for the period of May to September was 98.5 mm. This is equivalent to 3.1 L of water per column. The total rainfall accumulation for the five month period (15.55 L) was applied into each column at a rate of 1.55 L every 15 days starting on day 0. Leachates were also collected every 15 days just prior to each water application and analyzed for nitrogenous compounds.
Am. J. Agri. & Biol., 2 (2): 106-117, 2007
Table 2: Soil type and characteristics Particle Size Soil Series
Clay Silt Sand Soil Texture Soil Drainage Class
Permeability (cm/h)
Field Bulk
Density (kg/m3) pH
Cumberland 18 20 62
Sandy loam Moderately drained Moderate (7.0)
1.3 5.2
Stewiacke 17 33 50 Loam
Poorly drained Slow (3.6)
1.4 5.8
Queens 29 16 55 Sandy clay
loam Imperfectly drained
Slow (2.6)
1.5 6.5
Table 3: Thirty year average rainfall for Halifax during the growing season[19]
Month Rainfall (mm)
May 55.8
June 92.2
July 134.8 August 103.9 September 105.7
Monthly Average 98.5
made based on the assumptions that: (a) the nitrogen requirement for corn is 280 kg-N/ha and (b) only half of the organic nitrogen would be available for the crop. The total nitrogen in the cheese whey was 1820 mg/L (96.98% in the organic form). About 1 liter of whey was the amount applied onto the soil surface in each column on day 0. This is equivalent to 560 kg N/ha, which is twice the nitrogen requirement for corn.
Experimental protocol: Three Nova Scotian soils were selected in this study and three depths (60, 120, 180 cm) were investigated for each soil type. Four replicates were carried out for each treatment combination (soil type-soil depth) resulting in a total of 36 treatments. The soils were screened to remove large stones and trashy material. They were placed in the soil columns and compacted in 5 cm layers to achieve the same bulk densities measured in the field. The outlet in each column was closed and the soils were saturated with water to avoid gas trapping in the soil voids. After the soils were saturated with water for 3 days, the excess water was drained through the outlets. One liter of cheese whey was applied onto the surface of soil in each column on the first day. Then, 1.55 L of water was applied onto the surface of the soil in each column on the first day and then every 15 days.
Sampling and analyses: Water samples were collected from the leachate bottles every 15 days for measuring
the nitrogenous compounds. Air samples were collected for measuring the amounts of volatilized ammonia every five days until day 30, then every 15 days until the end of the experiment. The total solids and chemical oxygen demand were performed only on the cheese whey according to the procedures described in the Standard Methods for the Examination of Water and Wastewater[20]. The organic nitrogen, ammonium nitrogen, nitrite nitrogen and nitrate nitrogen analyses were performed on the cheese whey as well as the samples taken from the leachates according to the procedures described in the Methods of Soil Analysis by Black et al.[18]. Ammonia analysis was performed according to the procedure described by Zein El Abedin[21].
RESULTS
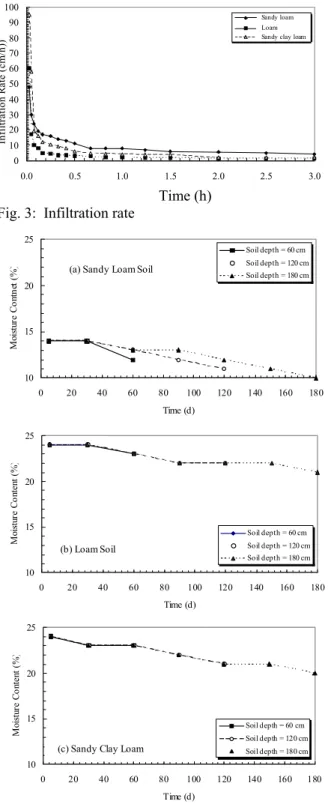
Infiltration rate: The infiltration rate for the three soils was measured before the start of the experiment to determine the permeability of each soil. The results shown in Fig. 3 indicated that Cumberland soil (sandy clay) has the highest permeability, followed by Stewiacke soil (loam) then Queens soil (sandy clay loam). The results also showed that the values of the infiltration rate were not significantly different for the three soils under complete saturation condition. However, there were significant differences in their permeability under unsaturated conditions, where it is desirable to investigate the nitrogen transformations and movement through the soil profile.
Am. J. Agri. & Biol., 2 (2): 106-117, 2007
0 10 20 30 40 50 60 70 80 90 100
0.0 0.5 1.0 1.5 2.0 2.5 3.0
In
filtr
a
tio
n
R
a
te
(
c
m
/h
))
Sandy loam
Loam Sandy clay loam
Time (h) Fig. 3: Infiltration rate
10 15 20 25
0 20 40 60 80 100 120 140 160 180
Time (d)
M
o
is
tu
re
C
o
n
tn
et (
%
)
Soil depth = 60 cm Soil depth = 120 cm Soil depth = 180 cm
(a) Sandy Loam Soil
10 15 20 25
0 20 40 60 80 100 120 140 160 180
Time (d)
M
o
is
tu
re
C
o
nte
nt (
%
)
Soil depth = 60 cm Soil depth = 120 cm Soil depth = 180 cm
(b) Loam Soil
10 15 20 25
0 20 40 60 80 100 120 140 160 180
Time (d)
M
o
is
tu
re
C
o
nte
nt (
%
)
Soil depth = 60 cm Soil depth = 120 cm Soil depth = 180 cm
(c) Sandy Clay Loam
Fig. 4: Soil moisture content
Stewiack (loam) and queens (sandy clay loam) soils at all soil depths. The moisture content in the topsoil profile appeared to have the same values regardless of the soil column depth used. There were, however, slight
decreases in moisture content with increases in the depth of the soil profile.
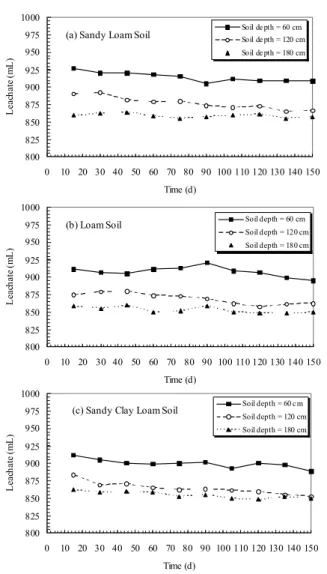
Leachates: The leachates from each water application were collected before the addition of the next water application (i.e. on days 15, 30, 45, 60, 75, 90, 105, 120, 135 and 150). The volumes of these leachates are presented in Fig. 5. Of the 1550 mL of water applied in each application, only about 848-927 mL were collected, depending on the soil type and soil depth. Since there were no statistical differences in the soil moisture contents observed at the end of the experiment among the various soil types and depths, it appears that about 40-45% of the water applied was lost by evaporation over the 15 day intervals between applications.
Ammonia volatilization: There were no significant differences in the amounts of ammonia volatilized from the various soil columns as shown in Fig. 6. In general, the release of ammonia from cheese whey was initially high, increased with time until day 15 and then declined until it finally ceased on day 75. The decrease in the ammonia volatilization could be due to low pH values of the three soils and whey (less than 7.0).
Organic nitrogen: The organic nitrogen concentration in the cheese whey was 1765 mg/L (96.98% of the total whey nitrogen). The concentrations of organic nitrogen in the leachate varied from a high of 2.1-2.6 mg/L (on day 15) to a low of 0.6-1.1 mg/L (on day 150) depending on the soil type and soil depth (Fig. 7). Generally, the organic nitrogen concentration in the leachate decreased with time for all the soil types and soil depths investigated. Most of the organic nitrogen in the cheese whey was retained by the soil and will, therefore, be made available for plants, after conversion to ammonium in subsequent years.
Am. J. Agri. & Biol., 2 (2): 106-117, 2007
Table 4: Average volumetric soil moisture content (%)
60 Cm 120 Cm 180 Cm
Sample Depth
Sandy Loam Loam Sandy Clay Loam
Sandy Loam
Loam
Sandy Clay Loam
Sandy Loam
Loam
Sandy Clay Loam
5 14 24 24 14 24 24 14 24 24
30 14 24 23 14 24 23 14 24 23
60 12 23 23 13 23 23 13 23 23
90 12 22 22 13 22 22
120 11 22 21 12 22 21
150 11 22 21
180 10 21 20
Values are the average of four replicates each
800 825 850 875 900 925 950 975 1000
0 10 20 30 40 50 60 70 80 90 100 110 120 130 140 150
Time (d)
L
eac
h
at
e (
m
L
)
Soil de pth = 60 cm Soil de pth = 120 cm Soil de pth = 180 cm
(a) Sandy Loam Soil
800 825 850 875 900 925 950 975 1000
0 10 20 30 40 50 60 70 80 90 100 110 120 130 140 150
Time (d)
L
eac
h
at
e (
m
L
)
Soil depth = 60 cm Soil depth = 120 cm Soil depth = 180 cm
(b) Loam Soil
800 825 850 875 900 925 950 975 1000
0 10 20 30 40 50 60 70 80 90 100 110 120 130 140 150
Time (d)
L
eac
h
at
e (
m
L
)
Soil depth = 60 c m Soil depth = 120 cm Soil depth = 180 cm
(c) Sandy Clay Loam Soil
Fig. 5: Leachate volumes
0 5 10 15
0 10 20 30 40 50 60 70 80 90 100 110 120 130 140 150 Time (d)
A
m
m
o
n
ia N
it
ro
g
en
(
m
g
/L
)
Fig. 6: Ammonia volatilization
Nitrite Nitrogen
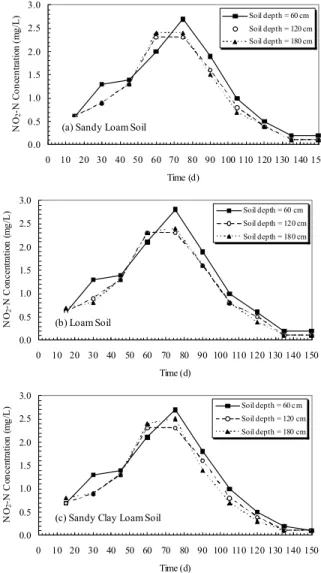
The initial concentration of nitrite nitrogen in cheese whey was 2 mg/L (0.11% of the total nitrogen). The concentration of nitrite nitrogen in the leachates on day 15 was in the range of 0.6-0.8 mg/L, then increased to a maximum of 2.3-2.8 mg/L on day 75 and finally declined gradually to 0.1-0.2 mg/L by the end of the experiment (Fig. 9). Neither soil depth nor soil type had any significant effect on the nitrite nitrogen concentration in leachates. The concentration of nitrite nitrogen in the leachate was lower than the allowable concentration in drinking water for both animals and humans[22].
Nitrate Nitrogen
Am. J. Agri. & Biol.,x(1):xx-xx, 2007 0.0 0.5 1.0 1.5 2.0 2.5 3.0
0 10 20 30 40 50 60 70 80 90 100 110 120 130 140 150
Time (d) Or ga n ic N it ro g en C o ncen tr at io n ( m g /L ).
Soil depth = 60 cm Soil depth = 120 cm Soil depth = 180 cm
(a) Sandy Loam Soil
0.0 0.5 1.0 1.5 2.0 2.5 3.0
0 10 20 30 40 50 60 70 80 90 100 110 120 130 140 150
Time (d) O rg ani c N it roge n C on ce nt ra tion (m g/ L ).
Soil depth = 60 cm Soil depth = 120 cm Soil depth = 180 cm
(b) Loam Soil
0.0 0.5 1.0 1.5 2.0 2.5 3.0
0 10 20 30 40 50 60 70 80 90 100 110 120 130 140 150
Time (d) O rg ani c N it roge n C on ce nt ra tion (m g/ L ).
Soil depth = 60 cm Soil depth = 120 c m Soil depth = 180 c m
(c) Sandy Clay Loam Soil
Fig. 7: Organic nitrogen concentration in leachates
150 (Fig. 10). The soil depth affected the concentration of nitrate nitrogen in the leachates while the soil type did not have any significant effect. Although the concentration of nitrate nitrogen in the leachate was below the maximum allowable level in drinking water for humans (10 mg/L), it was above the allowable concentration in drinking water for animals of 5 mg/L[22].
DISCUSSION
Nitrogen Transformations
Nitrogen in the soil is subject to biological and non biological transformations (Fig. 11) and movement in the air and soil-water complex. Organic nitrogen in the soil is mineralized and converted to ammonium nitrogen, some of which is lost to the atmosphere in the
0.0 0.2 0.4 0.6 0.8 1.0 1.2 1.4 1.6 1.8 2.0
0 10 20 30 40 50 60 70 80 90 100 110 120 130 140 150
Time (d) NH 4 -N C o n ce n tr a tio n ( m g /L
) Soil depth = 60 cm
Soil depth = 120 cm Soil depth = 180 cm
(a) Sandy Loam Soil
0.0 0.2 0.4 0.6 0.8 1.0 1.2 1.4 1.6 1.8 2.0
0 10 20 30 40 50 60 70 80 90 100 110 120 130 140 150
Time (d) NH 4 -N C o n ce ntr atio n ( m g /L
) Soil depth = 60 c m
Soil depth = 120 cm Soil depth = 180 cm
(b) Loam Soil
0.0 0.2 0.4 0.6 0.8 1.0 1.2 1.4 1.6 1.8 2.0
0 10 20 30 40 50 60 70 80 90 100 110 120 130 140 150
Time (d) NH 4 -N C o n cen tr at io n ( m g /L
) Soil depth = 60 cm
Soil depth = 120 cm Soil depth = 180 cm
c) Sandy Clay Loam Soil
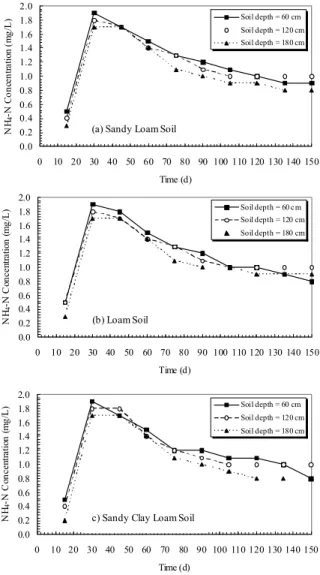
Fig. 8: Ammonium nitrogen concentration in leachates form of ammonia gas (NH3) by a non biological process
(volatilization). Generally, ammonium nitrogen will be retained by the soil in the form of the ammonium ion (NH4+) and made available for plants. Some of the
NH4+ is, however, subject to transformation under
Am. J. Agri. & Biol.,x(1):xx-xx, 2007 0.0 0.5 1.0 1.5 2.0 2.5 3.0
0 10 20 30 40 50 60 70 80 90 100 110 120 130 140 150
Time (d) NO 2 -N C onc e n tr at io n (m g/ L
) Soil depth = 60 cm
Soil depth = 120 cm Soil depth = 180 cm
(a) Sandy Loam Soil
0.0 0.5 1.0 1.5 2.0 2.5 3.0
0 10 20 30 40 50 60 70 80 90 100 110 120 130 140 150
Time (d) NO 2 -N C on cen tr at io n ( m g /L
) Soil depth = 60 cm
Soil depth = 120 cm Soil depth = 180 cm
(b) Loam Soil
0.0 0.5 1.0 1.5 2.0 2.5 3.0
0 10 20 30 40 50 60 70 80 90 100 110 120 130 140 150
Time (d) NO 2 -N C on cen tr at io n ( m g /L
) Soil depth = 60 c m
Soil depth = 120 cm Soil depth = 180 cm
(c) Sandy Clay Loam Soil
Fig. 9: Nitrite nitrogen concentration in leachates
0 1 2 3 4 5 6 7 8
0 10 20 30 40 50 60 70 80 90 100 110 120 130 140 150
Time (d) NO 3 -N C on cen tr at io n ( m g /L
) Soil depth = 60 cm
Soil depth = 120 cm Soil depth = 180 cm
(a) Sandy Loam Soil
0 1 2 3 4 5 6 7 8
0 10 20 30 40 50 60 70 80 90 100 110 120 130 140 150
Time (d) NO 3 -N C onc en tr a ti on ( m g/ L
) Soil de pth = 60 cm
Soil de pth = 120 cm Soil de pth = 180 cm
(b) Loam Soil
0 1 2 3 4 5 6 7 8
0 10 20 30 40 50 60 70 80 90 100 110 120 130 140 150
Time (d) NO 3 -N C onc ent ra ti on (m g/ L
) Soil depth = 60 cm
Soil depth = 120 cm Soil depth = 180 cm
(c) Sandy Clay Loam
Fig. 10: Nitrate nitrogen concentration in leachates
the nitrogen applied was lost from the soil through leaching and ammonia volatilization.
Ammonia volatilization: The rate of ammonia volatilization decreased with time and the process ceased completely on day 75. The soil type and soil depth did not affect the rate of volatilization. About 10.71 g of nitrogen were converted from ammonium ion to ammonia gas which was lost to the atmosphere. This represents 3.41 kg/ha (43% of applied NH4-N or
0.59% of the total nitrogen). Contrary to the findings of Mills et al[23] that about 70 % of NH3 volatilization
occurred during the first 3 days after the application of commercial fertilizer, the volatilization of ammonia in this study was gradual over a period of 75 days. However, 98% of the ammonia was released during the first 30 days.
Am. J. Agri. & Biol.,x(1):xx-xx, 2007
Table 5: Nitrogen losses in the leachates and air
* Values are the average of 4 replicates each ** Values are the average of 36 measurements
Applied organic nitrogen = 1765 mg/L Applied ammonium nitrogen = 25 mg Applied nitrite nitrogen = 2 mg Applied nitrate nitrogen = 28 mg
Generally, the rate of ammonia volatilization depends on the soil pH, moisture content, temperature and air circulation above the soil surface[24]. One reason for the observed decrease in ammonia volatilization in this study was the high initial moisture content at the soil surface. Several researchers[25,26] reported increased ammonia (NH3) losses over time and with decreased
moisture content. Saarijärvi et al.[27] reported volatilization of ammonia was highest with warm and dry soil. Another reason for the observed lower amounts of volatilized NH3 in this study was the low
rate of air exchange (320 cm3/min or 0.03 VVM). Termean et al.[28] and Terry et al.[29] reported that rapid movement of air across the soil surface promoted NH3
volatilization by maintaining a low partial pressure of NH3 in the atmosphere adjacent to the soil. Fillery and
Viek[30] reported that increased wind speed and high temperature promoted the loss of nitrogen through ammonia volatilization. The low pH of the soils (5.2-6.5) and cheese whey (5-9) also affected ammonia volatilization. Harrison and Webb[31] stated that fertilizers that increased the pH of the soil solution, increased the chance of ammonia emission. Whitehead[32] reported close correlation between
ammonia volatilization and soil pH and stated that soil pH>7.0 increased ammonia losses by increasing the NH3/NH4+ ratio.
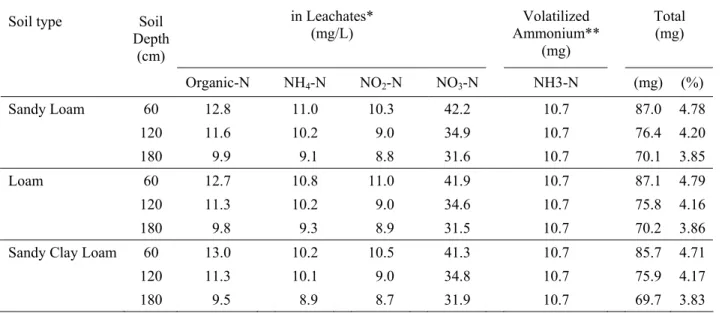
Nitrogen losses in Leachate: The amount of organic nitrogen in the leacates ranged from 9.5 to 13.0 mg. The soil type did not appear to have any significant effect on the amount of organic nitrogen found in the leachates. The organic nitrogen losses represent 3.02-4.14 kg/ha (0.54 – 0.74% of the organic nitrogen or 0.52-0.71% of the total nitrogen). Strahm et al.[33] reported that leaching losses of nitrogen occur when soils contain a significant quantity of nitrogen and water is moving downward through the soil. This, however, depends on the rate and time of waste or fertilizer application. Andersson et al.[34] found that organic nitrogen leaching was facilitated by increasing temperature, microbial activity and pH.
The total amount of inorganic nitrogen (NH4, NO2
and NO3 nitrogen) applied to each soil was 55 mg.
However, between 59.0-76.3 mg were collected in the leachates, depending on the soil type and soil depth. This indicated that both the nitrogen mineralization and nitrification processes have taken place in the soil profile. Kampbell et al.[35] reported increased nitrate in Leachates*
(mg/L)
Volatilized Ammonium**
(mg)
Total (mg) Soil type Soil
Depth (cm)
Organic-N NH4-N NO2-N NO3-N NH3-N (mg) (%)
Sandy Loam 60 12.8 11.0 10.3 42.2 10.7 87.0 4.78
120 11.6 10.2 9.0 34.9 10.7 76.4 4.20
180 9.9 9.1 8.8 31.6 10.7 70.1 3.85
Loam 60 12.7 10.8 11.0 41.9 10.7 87.1 4.79
120 11.3 10.2 9.0 34.6 10.7 75.8 4.16
180 9.8 9.3 8.9 31.5 10.7 70.2 3.86
Sandy Clay Loam 60 13.0 10.2 10.5 41.3 10.7 85.7 4.71
120 11.3 10.1 9.0 34.8 10.7 75.9 4.17
Am. J. Agri. & Biol.,x(1):xx-xx, 2007
concentrations in agricultural lands and in septic tanks areas as a result of mineralization and nitrification. Almasri and Kaluarachchi[36] found high levels of inorganic nitrogen in ground water samples taken from major agricultural centers as a result of fertilizer and/or manure application and subsequent nitrification.
Potential ecological and health problems: Nitrogen is lost from the soil, by leaching nitrite and nitrate and enters surface and groundwater which are often used as a source of drinking water[37]. The presence of nitrite and nitrate in the ground water at high concentrations as a result of high applications of cheese whey may result in serious health problems for both animals and humans. Nitrite is known to cause cancer and blue baby syndrome (sudden death in young animals and babies). Amino compounds and ferric iron (hemoglobin) in the blood stream combine with NO2 instead of molecular
oxygen to form nitrosamines (powerful carcinogens) and methemoglobinemia, respectively[38-40]. Nitrate is also known to cause health problems in humans and animals as well. These include abortion, muscle stiffness, abdominal pain, muscular weakness, infertility, lower weight gain, lack of coordination, diarrhea and reduced vitamin storage in the liver[38,39]. Although the concentration of nitrite nitrogen in the leachates was below the allowable limit in dirking water for both animals and humans, the nitrate nitrogen was above the allowable limit in drinking water for animals[22]. Therefore, continuous high application of cheese whey on land may pose serious health problems and should be investigated.
Cheese whey has been reported to have the potential to improve the chemical, physical and microbiological conditions of the soil[41-43]. However, excess application of whey has the potential of degrading soils. Robbins and Lehrsch[44] stated that whey may contain 50 000-75 000 mg/L of COD (34 000-50 000 mg/L of BOD) and at high application (50 mL), the soil remained wet for 24 h and caused wheat kills and severe crop damage to potatoes, alfalfa and barley. Sharralt et al.[45] reported crop kill as a result of high application of cheese whey due to rapid consumption of oxygen for the oxidation of readily decomposable milk sugars and proteins. Paterson et al.[46] reported reduced soil redox potential as a result of high whey application which caused solubilization of Fe and Mn and contamination of domestic drinking water wells. Sharralt et al.[47] reported that for each mm (103/ha) of whey applied to the soil, about 400-600 kg of total salt per hectare was added which resulted in high soil salinity and reduced crop yield. Jones et al.[48]
reported that acid whey can also adversely affect soil pH to the point of it becoming injurious to crops.
CONCLUSION
The nitrogen in the soil was subject to biological transformations and downward movement in the soil. There were indications of organic mineralization and nitrification processes taking place in the soil. The soil type and depth appeared to affect these processes. The ammonia volatilization occurred during the first 75 days with most (90 %) of the NH3 loss taking place
during the first 30 days. The amount of nitrogen losses to the air is about 3.41 kg/ha (0.59% of the total nitrogen). The amount of organic nitrogen lost in the leachates was 3.0-4.14 kg/ha (0.52-0.71% of the total nitrogen) whereas the amount of inorganic nitrogen lost in the leachates was 18.63-24.09 kg/ha (3.54-4.56% of the total nitrogen). The presence of nitrite nitrogen in the leachate at high concentrations is a potential health hazard.
Although cheese whey has been reported to have the potential to improve soil conditions, excess application also has the potential of degrading soils and causing health problems. Additional research is, therefore, needed to better characterize the physical and chemical characteristics of soils receiving high continuous application rates of cheese whey and their impact on crop yield and groundwater and air qualities. Many crop uses of whey are limited to seasonal applications in areas where very wet or frozen soil conditions exist for a part of the year such as in Canada.
ACKNOWLEDGEMENT
This study was financially supported by the National Science and Engineering Research Council (NSERC) of Canada.
REFERENCES
1. FAO, 2005. FAO Year Book. Food and Agricultural Organization of the United Nations, Rome, Italy.
2. Ghaly, A.E. and J.P. Singh, 2006. Reduction of microbial population in Cheese Whey in a single and conventional reactors. Am. J. Biochem. and Biotech., 2: 89-96.
Am. J. Agri. & Biol.,x(1):xx-xx, 2007
4. Ghaly, A.E., D.R. Ramkumar, S.S. Sadaka and J.P. Rochon, 1999. Effect of pH control and reseeding on the performance of a two-stage mesophilic anaerobic digester operating on acid Cheese Whey. Canadian Agri. Enging., 42: 173-183.
5. Atkin, C., L.D. Witter and A.J. Ordal, 1967. Continuous propagation of Trichosporon cutaneum in Cheese Whey. Appl. Microbio., 15: 1337-1344. 6. Bernstein, S., C.H. Tzeng and D. Sisson, 1977.
Commercial fermentation of cheese whey for production of protein and/or alcohol. Biotech. and Bioengineg. Symposium, 7: 1-9.
7. Ghaly, A.E., R.M. Ben Hassan and N. Ben-Abdallah, 1992. Utilization of Cheese Whey lactose by Kluyveromyces fragilis for growth and energy under continuous fermentation. Appl. Biochem. and Biotech., 36: 301-322.
8. Ghaly, A.E. and R.M. Ben Hassan, 1994. Kinetics of batch production of single cell protein from Cheese Whey. Appli. Biochem. and Biotech. J., 50: 79-92.
9. Ghaly, A.E. and A.M. El-Taweel, 1999. Continuous ethanol production from Cheese Whey by Candida Pseudotropicalis. Energy Sources, 19: 1043-1064.
10. Tangos, M.S.A. and A.E. Ghaly, 1999. Kinetic modeling of lactic acid production from batch submerged fermentation of Cheese Whey. Transactions of the ASAE, 42: 1791-1800.
11. Fitzpatrick, J.J., M. Ahrens and S. Smith, 2001. Effect of manganese on Lactobacillus casei
fermentation to produce lactic acid from Cheese Whey permeate. Process Biochem., 36: 671- 675. 12. Ghaly, A.E., A. Al Taweed, H. Goman, M. Tanga,
J. P. Pyke and C. Cooney, 2001. Production of anti-icing/deicing agents from Cheese Whey. In: Proceeding of the 11th World Conference of Food Sci. and Tech., Soul, Korea.
13. Talabardon, M., J.P. Schwitzguebel and P. Peringer, 2000. Anaerobic thermophilic fermentation of acetic acid production from milk permeates. J. Biotech., 76: 83-92.
14. Ghaly, A.E., M. Tango, J.B. Pyke and M. Davidson, 2001. The production of biodegradable plastics from cheese whey. In: Proceeding of the 11th World Conference of Food Sci. and Tech., Soul, Korea.
15. Muller, P.G., 1979. Economic evaluation of feeding liquid whey to livestock. Technical Report, Food Research Institute, Research Branch, Agriculture Canada, Ottawa, Ontario.
16. Singh, J.P. and A.E. Ghaly, 2006. Reduced fouling and enhanced microbial inactivation during online sterilization of Cheese Whey using a UV coil reactor. Bioprocess and Biosystems Enging., 24: 269-281.
17. Devinny, J.L., L. Everett, C. June and R. Stolar, 1990. Subsurface migration of hazardous wastes. Van Nostrand Reinhold Publisher, New York, New York.
18. Black, C.A., D.D. Evans, L.E. Ensminger, J.L. White and F.E. Clark, 1965. Methods of Soil Analysis. American Society of Agronomy Publishers, Madison, Wisconsin.
19. Environment Canada, 2005. The Weatheroffice, Environ. Canada, Halifax, Nova Scotia.
20. APHA, 1998. Standard Methods for the Examination of Water and Wastewater. Am. Public Health Associ., New York, New York.
21. Zein El Abedin, T. 1993. Manurial nutrients transformation and transport in the soil- water complex. Ph.D. Thesis, Agricultural Engineering Department, Technical University of Nova Scotia, Halifax, Nova Scotia.
22. CCME, 2004. Canadian Environmental Quality Guidelines. Canadian Council of Ministers of the Environment, Winnipeg, Manitoba.
23. Mills, H.A., A.V. Barker and D.N. Maynard. 1974. Ammonia volatilization from soils. Agronomy J. 66: 355-358.
24. Sevenson, L., 1994. Ammonia volatilization following application of livestock manure to arable land. J. Agri. Enging. Resea., 58: 241-260. 25. Fenn, L.B. and R. Escarzaga, 1976. Ammonium
volatilization from surface application of ammonium compounds on calcareous soils. V. Soil water content and method of nitrogen application. Soil Sci. Soci. Am. J. 40: 537-541. 26. Tian, G., Z. Cai, J. Cao and X. Li, 2001. Factors
affecting ammonia volatilization from a rice-wheat rotation system. Chemosphere, 42: 123-129. 27. Saarijärvi, K., P.K. Mattila and P. Virkajärvi, 2006.
Ammonia volatilization from artificial dung and urine patches measured by the equilibrium concentration Technique (JTI method). Atmospheric Environment, 40: 5137-5145.
28. Terman, G.L., F. Parr and S.E. Allen. 1968. Recovery of nitrogen by corn from solid fertilizer and solutions. J. Agri. Food Chemi. 16: 685-690. 29. Terry, R.E. and R.L Tate. 1978. Denitrification as a
Am. J. Agri. & Biol.,x(1):xx-xx, 2007
30. Fillery, J.R.P. and P.L.G. Viek, 1986. Reappraisal of the significance of ammonia volatilization as a N loss mechanism in flooded rice fields. Nutrient Cycling in Agroecosystems, 9: 79-98.
31. Harrison, R. and J. Webb, 2001. Review of the effect of N fertilizer type on gaseous emissions. Advances in Agronomy, 73: 65-108.
32. Whitehead, D. C. and N. Raistrick, 1993. The volatilization of ammonia from cattle urine applied to soils as influenced by soil properties. Plant and Soil, 148: 43-51.
33. Strahm, B.D., R.B. Harrison, T.A. Terry, B.L. Flaming, C.W. Licata and K.S. Petersen, 2005. Soil solution nitrogen concentrations and leaching rates as influenced by organic matter retention on a highly productive Douglas fir site. Forest Ecology and Management, 218: 74-88.
34. Andersson, S., S.I. Nilsson and P. Saetre, 2000. Leaching of dissolved organic carbon and dissolved organic nitrogen in humus as affected by temperature and pH. Soil Bio. and Biochem., 32: 1-10.
35. Kampbell, D.H., Y.J. An, K.P. Jewell, and J.R. Masoner, 2003. Groundwater Quality Surrounding Lake Texoma During Short-Term Drought Conditions. Environ. Pollu., 125: 183-191.
36. Almasri, M.N., J.J. Kaluarachchi, 2004. Assessment and Management of Long-Term Nitrate Pollution of Ground Water in Agriculture Dominated Watersheds. J. Hydrol., 298: 225-245. 37. Newbould, P., 1988. The use of Nitrogen Fertilizer
in Agriculture. Where do we go practically and ecologically. Plant and Soil, 115: 297-311. 38. Weyer, P.J., J. R. Cerhan, B.C. Kross, G.K.
Hallberg, J. Kantamneni, G. Breuer, M. Jones, W. Zheng and C.F. Lynch, 2004. Municipal drinking water nitrate levels and cancer risk in older women: the Iowa women’s health study. Epidemiology, 12: 327-338.
39. Mensinga, T.T., G.J. Speijers and J. Meulenbelt, 2003. Health implications of exposure to Environmental Nitrogenous compounds. Toxicological Reviews, 22: 41-51.
40. Hubbard, R.K., J.M., Sheriden, R. Lowrana, D.D. Bosch and G. Vellidia, 2004. Fate of Nitrogen from agriculture in the southeastern coastal plain. J. Soil and Water Conservation, 59: 72-86.
41. Lehrsch, G.A. and C.W. Robbins, 1994. Cottage Cheese (acid) Whey effects on sodic soil aggregate stability. Arid Soil Research and Rehabilitation 8: 19-31.
42. Watson, K.S., A.E. Peterson and R.D. Powell, 1997. Benefits of spreading whey on Agricultural land. J. Water Pollution Control Federation, 49: 24-34.
43. Radford, J.B., D.B. Galpin and M.F. Parkin, 1986. Utilization of whey as a fertilizer replacement for dairy pastor. New Zealand. J. Dairy Tech., 21: 51-61.
44. Lehrsch, G.A. and C.W. Robbins, 1996. Cheese whey effects on surface soil hydraulic properties. Soil Use and Management, 12: 205-208.
45. Sharralt, W.J., A.E. Peterson and H.E. Calbert, 1959. Whey as a source of plant nutrients and its effect on the soil. J. Dairy Sci., 42: 1126-1131. 46. Peterson, A.E., W.G. Williams and F.S. Watson,
1979. Effect of Whey application on
chemical properties of soils and crops. J. Agri. Food Chem., 27: 654-658.
47. Sharralt, W.J., A.E. Peterson and H.E. Calbert, 1962. Effects of Whey on soil and plant growth. Agronomy J., 54: 359-361.