Periphytic algal biomass in two distinct
regions of a tropical coastal lake
Biomassa de algas perifíticas em duas regiões distintas de uma lagoa costeira tropical
Stéfano Zorzal de Almeida1 and Valéria de Oliveira Fernandes21Programa de Pós-graduação em Biologia Vegetal, Universidade Federal do Espírito Santo – UFES, Av. Fernando Ferrari, 514, Goiabeiras, CEP 29075-910, Vitória, ES, Brazil
e-mail: stefanozorzal@gmail.com
2Departamento de Ciências Biológicas, Universidade Federal do Espírito Santo – UFES, Av. Fernando Ferrari, 514, Goiabeiras, CEP 29075-910, Vitória, ES, Brazil
e-mail: valeriaes@uol.com.br
Abstract: Aim: This study assessed the phycoperiphyton biomass in two regions submitted to different human impacts on Juara Lake, a coastal ecosystem with multiple uses, to order to test the hypothesis that the sampling sites that receive domestic sewage shows higher biomass values. Methods: It was installed three experimental structures with artificial substrate (glass slides) in December 2009 in two sampling sites: ED – near the domestic sewage’s release; TR – in the area of intensive fish farming (net cages). Samplings were conducted in each experimental structure, after 21, 26 and 31 days for colonization. We evaluated: transparency, electric conductivity, pH, turbidity, total suspended solids, alkalinity, dissolved oxygen, water temperature, total nitrogen, nitrate, nitrite, ammonia nitrogen, total phosphorus, orthophosphate and silicate. The phycoperiphyton was analyzed regarding biomass: biovolume (total and per class); pigments (chlorophyll-a and b and carotenoids) and phaeophytin; dry weight and ash-free dry weight. Results: TR featured higher values of transparency, water temperature and silicate. ED presented greater values of conductivity, turbidity, total suspended solids, alkalinity, total nitrogen, nitrate, ammonia nitrogen, and orthophosphate. No difference was detected between the sites and the succession of days for the dry weight, ash-free dry weight, chlorophyll-b, carotenoids, phaeopigments, and total biovolume. Conclusions: Nevertheless, the biovolume of Bacillariophyceae and Chlorophyceae were more representative in ED. Only the higher values of chlorophyll confirmed the hypothesis tested.
Keywords: domestic effluent, intensive fish farming, biovolume, pigments, dry weight.
and Lowe, 2006). Meanwhile, a better knowledge of the relationship between the responses of periphytic algae and environmental variables is required in order to develop an effective biomonitoring program (Stevenson and Smol, 2003). These relationships between nutrients and attributes with ecological value are important to document the effects on the ecosystems, generating data to support government actions (Stevenson et al., 2008).
The present study was performed in a tropical coastal lake with input of nutrients through tributaries, with high organic load and intensive fish farming, and aimed to evaluate the phycoperiphyton biomass in two regions submitted to different human impacts. The hypothesis tested was that the biomass of periphyton is improved in the region where domestic wastewater is discharged rather than intensive fish-farming region.
2. Material and Methods
2.1. Study area
Juara Lake covers an area of 2.9 km2 and is located in Jacaraipe River basin (area of 220 km2), in the municipality of Serra, Espírito Santo State, Brazil (Serra, 2010). The climate of this region is tropical hot and humid, with annual average temperature of 24 °C, ranging from 18 °C to 34 °C, with an unimodal rainfall regime, and annual range from 900 to 1,200 mm (Serra, 2010).
The lake is used for recreation, fishing, fish farming and other uses. The Fishermen Association of the Lake had worked with about 90 net cages (in December 2009) for tilapia farming (Oreochromis sp.). Some streams cross urban areas can transport organic load from domestic sewage into the lake, as in the case of Laranjeiras Stream that flows into a region that resembles a small bay, next to the Fishermen Association and widely used by the population for recreation.
2.2. Experimental design and sampling sites
Three circular rubbered supports have been assembled to hold about 50 glass slides, an artificial
1. Introduction
Coastal lakes are shallow water bodies, usually oriented parallel to the coast, connected with the ocean at least intermittently through one or more restricted connections (Kjerfve, 1994). These ecosystems along with estuaries are among the most productive worldwide, and a significant portion of this productivity is explained by the high biomass of periphytic algae, which develop dense populations in these shallow environments, where light can reach up to the sediment in most of the time (Tundisi and Matsumara-Tundisi, 2008). However, despite the great ecological importance, only recently this community has been a subject of investigation (Stevenson et al., 1996).
Several factors regulating the periphyton community have been investigated, among them the light (Hill and Fanta, 2008; Vadeboncoeur et al., 2008), temperature (Van der Grinten et al., 2005; Murakami and Rodrigues, 2009) and nutrients (Engle and Melack, 1993; Smith and Lee, 2006; Ferragut and Bicudo, 2010). In recent centuries, the urbanization and agriculture have increased the input of nutrients into shallow lakes around the world, changing the structure and biological dynamics of these environments (Jeppesen et al., 2005). The eutrophication caused by increased concentration of nutrients, mainly nitrogen and phosphorus, provides unpleasant taste and odor, and potential presence of toxins and anoxia (Molica and Azevedo, 2009), which may prevent the multiple use of ecosystems, such as intensive fish farming.
The increased concentration of nutrients in the water will raise the nutritional content of periphytic algae, followed by an increase in its biomass and productivity (Kahlert and Petterson, 2002). The biomass can be determined by several ways, including through biovolume (DeNicola et al., 2006), pigments (Brotas et al., 2007) and organic matter content (Dodds and Biggs, 2002), attributes that can be used to evaluate the ecosystem quality, since they respond to variations in nutrient concentrations (Ferragut and Bicudo, 2009; Blanco et al, 2008; DeNicola et al., 2006; Luttenton
ortofosfato. Não houve diferença para o peso seco, peso seco livre de cinzas, clorofila b, carotenóides, feopigmentos e biovolume total entre as estações e dias de sucessão. Contudo, os biovolumes de Bacillariophyceae e Chlorophyceae foram mais representativos em TR, onde a concentração de nutrientes foi menor, enquanto Coscinodiscophycae e Cyanophyceae foram mais representativas em ED. Conclusões: Somente os maiores valores de clorofila-a em ED confirmaram a hipótese testada.
V1.25), total suspended solids (APHA, 2005), total alkalinity (Carmouze, 1994), total nitrogen and total phosphorus (Valderrama, 1981), nitrate (Mackereth et al., 1978), nitrite and silicate (Golterman et al., 1978), ammonia nitrogen (Koroleff, 1976), orthophosphate (Strickland and Parsons, 1960). From the data of nutrients, the TN: TP molar ratio was estimated.
At each sampling, 10 colonized glass slides (substrate) were randomly collected, which were scraped into a single sample (integrated sample), from which it had been taken aliquots with known volume for biological analysis.
Samples for quantitative analysis of periphytic algae were fixed in acetic lugol solution (5%) and analyzed in an inverted microscope Nikon Eclipse TS 100 (400×), according to Utermöhl (1958), and the sedimentation time according to Lund et al. (1958). The count limit was given by the rarefaction curve of species (Bicudo, 1990) until the rate ruling reached 100 individuals. The biovolume was estimated according to Sun and Liu (2003) and Hillebrand et al. (1999), by multiplying the density of each taxon by the average of its volume; substrate to periphyton. On December 18th, 2009
each experimental structure was attached to the sediment and equipped with floats to maintain the substrate at 0.2 m under the water surface.
Two sampling sites were established: in area of the net cages (TR), at 40° 14’ 15’’ W and 20° 06’ 17’’ S, and near the entrance of Laranjeiras Stream (ED), at 40° 12’ 43’’ W and 20° 07’ 40’’ S (Figure 1). The distance between the sampling sites was around 3.7 km.
2.3. Sampling, limnological and biotic variables
The experimental structures have been installed in each sampling site on December 18th, 2009; the samplings were performed at 21st, 26th and 31st day of periphytic algae’s colonization (January 2010), period considered as representative of mature stage of succession (Pompêo and Moschini-Carlos, 2003).
The following variables were assessed during the experiment: water temperature (average daily) and rainfall (daily accumulated) (INCAPER, 2010); depth (depth gauge Speedtech), water transparency (Secchi disk), electric conductivity, water temperature and dissolved oxygen (YSI 85 probe), pH (portable digital potentiometer Alfakit AT 300), turbidity (turbidimeter Alfakit Plus
and EXCEL 2007 for Windows. The canonical correspondence analysis (CCA) (TerBraak, 1986) was used to assess the relationship between environmental variables and biovolume (total and per class). The significance of the CCA axes was tested through Monte Carlo permutation test (999 randomizations). The software PC-ORD 4.0 (McCune and Mefford, 1999) was used to perform the CCA and Monte Carlo test.
3. Results
3.1. Abiotic variables
High air temperatures were registered in the study period, with mean value of 27.6 °C (ranging from 23.8 and 29.7 °C) and low rainfall (70 mm accumulated rainfall), with maximum daily rainfall of 26.2 mm. Both sampling sites were shallow, but TR was deeper than ED (2.1 m and 1.2 m, respectively.
The Table 1 summarizes the limnological variables in each sampling site (n = 9) during the for this purpose 10 individuals of each taxon were
measured.
The pigments (chlorophyll-a and b and carotenoids) and phaeophytin were extracted using acetone, according to APHA (2005), and the concentration determined using the spectrophotometric method and formulas suggested by Parsons et al. (1984) and Lorenzen (1967).
The dry weight, ash-free dry weight and ash were determined through the gravimetric method described in APHA (2005).
2.4. Statistical analysis
The data obtained were analyzed by an exploratory univariate analysis, through mean, minimum, maximum, standard error and coefficient of variation. In order to test the differences between the mean values of limnological variables, a one-way ANOVA was employed (α = 0.05) and the
Mann-Whitney test was applied for the mean values of biotic variables. All these analyses were run in the software STATISTICA 7.0 (StatSoft, 2004)
Table 1. Exploratory univariate analysis (minimum, maximum, standard deviation and CV) and ANOVA (p < 0.05) of the environmental and limnological variables, considering the two sampling sites (TR and ED).
Variable Code TR ED ANOVA
Transparency (m) Tra 0.5-0.6 (0.6 ± 0.01; 6.9%)
0.4-0.5 (0.4 ± 0.01; 7.6%)
F = 14.78; p = 0.001
Electric conductivity (µS.cm–1) CE 135.5-149.9
(141.7 ± 2.0; 4.2%)
177.9-194.2 (188.2 ± 2.4; 3.8%)
F = 222.75; p = 0.000
Hydrogenionic potential pH 7.2-7.7 (7.3 ± 0.1; 2.4%)
7.2-7.4 (7.3 ± 0.02; 1.0%)
F = 1.60; p = 0.224
Turbidity(NTU) Tur 6.7-8.5
(7.3 ± 0.2; 8.9%)
8.8-11.6 (10.4 ± 0.4; 10.6%)
F = 52.65; p = 0.000
Total suspended solids (mg.L–1) STS 7.3-12.3
(10.0 ± 0.6; 16.8%)
11.0-19.0 (14.4 ± 1.0; 21.4%)
F = 13.987; 0.001
Total alkalinity (mEq.L–1) Alc 0.4-0.5
(0.4 ± 0.01; 8.4%)
0.5-0.7 (0.6 ± 0.02; 10.2%)
F = 57.91; p = 0.000
Dissolved oxygen (mg.L–1) OD 5.8-7.3
(6.4 ± 0.2; 10.1%)
6.5-7.6 (6.8 ± 0.1; 4.6%)
F = 2.90; p = 0.108
Water temperature (°C) Tag 31.4-32.5 (31.8 ± 0.1; 1.3%)
30.3-32.0 (30.8 ± 0.2; 1.9%)
F = 15.52; p = 0.001
Total nitrogen (µg.L–1) NT 255.9-631.4 (399.5 ± 34.9; 26.1%)
466.5-1242.9 (873.5 ± 97.7; 33.5%)
F = 20.88; p = 0.000
Nitrate (µg.L–1) NO3 1.0-31.3
(15.1 ± 3.8; 75.4%)
9.5-44.1 (28.2 ± 4.4; 47.3%)
F = 4.96; p = 0.041
Nitrite (µg.L–1) NO
2 5.9-20.9
(14.0 ± 1.9; 40.1%)
5.9-30.4 (15.1 ± 2.8; 55.7%)
F = 0.12; p = 0.738
Ammonia nitrogen (µg.L–1) NH3 29.7-98.0
(53.7 ± 7.2; 40.1%)
36.4-855.9 (471.3 ± 115.3; 73.4%)
F = 13.06; p = 0.002
Total phosphorus (µg.L-1) PT 10.6-43.7
(30.4 ± 4.2; 41.8%)
20.0-84.6 (44.0 ± 6.5; 44.2%)
F = 3.07; p = 0.099
Orthophosphate (µg.L–1) PO4 9.0-13.8 (10.7 ± 0.5; 13.6%)
11.4-21.7 (16.3 ± 1.1; 21.0)
F = 20.63; p = 0.000
Silicate (mg.L–1) SO
4 4.1-5.3
(4.7 ± 0.1; 7.2%)
2.1-3.0 (2.5 ± 0.1; 15.9%)
F = 174.68; p = 0.000
TN:TP 18.4-87.9
(36.2 ± 7.7; 63.8%)
17.3-88.4 (50.6 ± 8.1; 48.1%)
at ED at the 26th (545.94 mm3 m–2) and 31st (634.00 mm3 m–2) days of succession. In this same site, Cyanophyceae featured greater biovolume, at 21st (2,084.50 mm3 m–2) and 31st (1,858.94 mm3 m–2) days of succession. Bacillariophyceae presented higher value of biovolume on the 21st succession day (3,344.17 mm3 m–2) in the sampling site TR. The other Classes (Chlorophyceae, Oedogoniophyceae, Zy g n e m a p h y c e a e , X a n t h o p h y c e a e a n d Euglenophyceae) presented no difference between sites and succession days (Table 2).
Higher values of chlorophyll-a were recorded at ED, on the 21st (5.11 µg.cm–2) and 26th (5.82 µg.cm–2) days of succession. In the sampling TR site, lower concentrations of chlorophyll-a were verified on the 31st colonization day (1.78 µg.cm–2). Chlorophyll-b, carotenoids and phaeophytin were similar between both sampling sites and succession days (Figure 3).
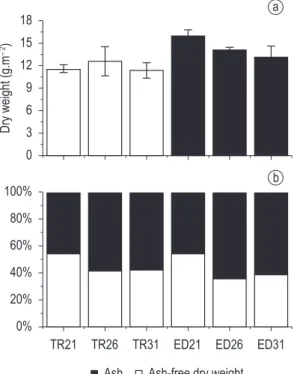
Dry weight and ash-free dry weight had no difference between sampling sites and succession days, as shown in Figure 4.
study period, as well as ANOVA results. In general, sampling sites were similar with high values of nutrients. However, the TR featured higher values of water transparency, temperature and silicate; and ED had greater values of total nitrogen, nitrate, ammonia nitrogen and orthophosphate, electric conductivity, turbidity, total suspended solids and total alkalinity. In the same way, high values of TN: TP ratio were found in both sites, especially at ED.
3.2. Biotic variables
The descriptive analysis of biotic data and Kruskal-Wallis test results are listed in Table 2. The total biovolume of periphytic algae had no difference between sampling sites and succession days (Figure 2a). The highest mean was recorded on 21st day of succession at ED (19,079.89 mm3 m–2) and the lowest on the 26th colonization day at TR (5,037.33 mm3 m–2).
The Class Zygnemaphyceae was the largest contributor for biovolume in the TR site, while Chlorophyceae, in the ED (Figure 2b). Coscinodiscophyceae had higher biovolume values
Table 2. Mean, standard error, and Kruskal-Wallis testof the biotic variables in the sites (TR and ED) and succession days.
Variable TR-21 TR-26 TR-31 ED-21 ED-26 ED-31
Total biovolume (mm3.m–2) 8783.83a
(4401.05) 5037.33a (1264.68) 5386.27a (5581.44) 19079.89a (9670.72) 9319.01a (3572.44) 12350.90a (10869.28) Coscinodiscophyceae (mm3.m–2) 195.84c
(23.43) 169.20c (69.24) 171.08d (6.66) 295.39b (97.98) 545.94a (118.45) 634.00a (254.13) Bacillariophyceae (mm3.m–2) 3344.17a
(722.96) 1828.76b (629.61) 871.89cd (289.93) 586.99e (192.38) 938.84c (284.84) 794.30d (402.47) Chlorophyceae (mm3.m–2) 785.37a
(700.71) 432.08a (65.42) 393.96a (78.62) 12718.92a (5866.52) 6469.09a (3228.73) 7887.34a (9349.84) Cyanophyceae (mm3.m–2) 60.30d
(26.17) 76.80c (22.49) 83.27c (15.53) 2084.50a (1061.83) 1170.47b (311.49) 1858.94ab (970.68) Oedogoniophyceae (mm3.m–2) 156.18a
(174.73) 326.26a (172.49) 365.26a (210.34) 223.79a (285.17) 181.63a (208.08) 118.06a (204.48) Zygnemaphyceae (mm3.m–2) 4237.24a
(3339.03) 2195.40a (1913.79) 3498.71a (5080.41) 3168.50a (5488.00) 3.31a (5.74) 1054.36a (924.36) Xanthophyceae (mm3.m–2) 0.00a
(0.00) 8.44a (14.62) 2.11a (3.65) 0.00a (0.00) 6.23a (6.59) 3.89a (6.75) Euglenophyceae (mm3.m–2) 4.71a
(8.16) 0.00a (0.00) 0.00a (0.00) 1.79a (3.10) 3.51a (6.07) 0.00a (0.00) Chlorophyll-a (µg.cm–2) 2.38c
(0.24) 2.92bc (0.67) 1.78d (0.20) 5.11a (1.76) 5.82a (0.53) 3.49b (3.27) Chlorophyll-b (µg.cm–2) 0.91ª
(0.24) 0.20a (0.10) 0.11a (0.05) 1.22a (0.96) 0.08a (0.08) 1.55a (1.37) Carotenoids(µg.cm–2) 0.67a
(0.07) 0.72a (0.17) 0.54a (0.09) 1.01a (0.57) 1.40a (0.04) 1.10a (1.03) Phaeophytin (µg.cm–2) 0.71ª
(0.09) 0.28a (0.27) 0.22a (0.05) 1.58a (0.61) 0.35a (0.25) 0.76a (0.67) Dryweight (g.m–2) 11.60a
(0.89) 12.63a (3.38) 11.40a (1.74) 15.98a (1.39) 14.10a (0.57) 13.10a (2.67) Ash-free dry weight (g.m–2) 6.32ª
The Canonical Correspondence Analysis (CCA) summarized 81.7% of total data variability on the first two axes. The Pearson correlation (species-environment) was strong for both axis 1 (r = 0.992) and axis 2 (r = 0.900), indicating a strong correlation between abiotic variables and biovolume of algal classes. Nevertheless, these correlations had been significant only for the axis 1 for the Monte Carlo test (p = 0.013). The CCA showed a clear differentiation between the sampling TR site, ordinated on the positive side of axis 1, and the site AP, on the negative side (Figure 5). The axis 1 (65.4%) was positively associated with the water transparency, pH, water temperature, silicate and biovolume of Bacillariophyceae, Zygnemaphyceae and Oedogoniophyceae. Negatively, the axis 1 was associated with electric conductivity, total suspended solids, total alkalinity, turbidity, total nitrogen, nitrate, ammonia nitrogen, total phosphorus, orthophosphate and biovolume of Chlorophyceae, Cyanophyceae and Coscinodiscophyceae. The biplot intra-set correlation of abiotic variables is presented in Table 3.
4. Discussion
The Laranjeiras Stream receives untreated domestic sewage, and might be the highest influencer of the trophic status of ED, which featured higher values of total nitrogen, ammonia nitrogen, nitrate, orthophosphate, electric conductivity, b
a
Figure 2. Total biovolume (a) and relative biovolume (b) of periphytic algae in the sampling sites (TR and ED) and days of succession. Cos = Coscinodiscophyceae; Bac = Bacillariophyceae; Chl = Chlorophyceae; Cya = Cyanophyceae; Zyg = Zygnemaphyceae; Others = Oedogoniophyceae and Xantophyceae.
respond distinctly according to their physiological characteristics (Liboriussen and Jeppesen, 2006; Ferragut and Bicudo, 2009). In the present study, the total biovolume of periphytic algae had no difference between sampling sites and succession days. A similar result was found by Blanco et al. (2008), working with mesocosms, Ferragut and Bicudo (2009), using nutrient diffuser substrate.
However, the biovolume per class of algae proved to be sensitive to the different impacts. At the sampling TR site, where it was registered lower values of inorganic nutrients, except for silicates, there was a greater relative contribution of Zygnemaphyceae and Bacillariophyceae for biovolume for all the evaluated days. Blanco et al. (2008) verified a similar trend, when observed that the biovolumes of these classes have been negatively related to the levels of total phosphorus. Despite the CCA had corroborated with these data, through the ordination of the biovolume of Bacillariophyceae and Zygnemaphyceae on the positive side of the axis 1, only the biovolume of Bacillariophyceae had higher values for the TR site.
Regarding the ED site, where the limnological variables indicator of organic pollution has presented the highest values, including the concentration of nutrients, it was observed a greater relative contribution of the classes Chlorophyceae turbidity, TSS, and alkalinity. Water bodies that
receive discharges of domestic organic waste present higher values of these variables, which are good indicators of pollution for this type of waste (Camargo et al., 1995; Henry-Silva and Camargo, 2000; Santos et al., 2008). Despite the values of these variables had been statistically greater, the ED and TR sites had similar limnological characteristics. Regions with intensive net cage fish farming usually release the leftovers and metabolites directly into the water (Alves and Baccarin, 2005), which can lead to an increase in the environment trophic status.
Despite the similarity among the sampling sites values of diverse limnological variables, the difference between some abiotic variables and between the biovolume of the classes was enough to ordinate the samplings of the site that receives the Laranjeiras Stream (ED) on the negative side of the axis 1, and the samplings of the site where are the net cages (TR) on the positive side. There were no groupings pointing out some pattern among the days of succession, which may have evidenced that the days have represented the most mature phase of the succession process, according to Pompêo and Moschini-Carlos (2003).
Periphytic algae respond positively to nutrient input in aquatic ecosystems (Pan et al., 2000; Dodds et al., 2002) and different algal groups
a
b
Figure 4. Spatial variation of the dry weight (a) and relative contribution of the ash-free dry weight (b) in the sampling sites TR and ED and over the days of sucession.
Table 3. Main results of the canonical correspondence analysis (CCA). The codes of the environmental variables are listed in Table 1.
Axes
1 2
Eigenvalue 0.265 0.064
Percentage of variance explained 65.4 16.2 Cumulative explanation 65.4 81.7 Pearson correlation (r) 0.992 0.900 P (Monte Carlo) 0.013 0.348 Biplot Intra-set correlation
Tra 0.607 –0.363
CE –0.939 0.307
pH 0.322 –0.222
Tur –0.887 0.229
STS –0.662 –0.044
Alc –0.869 0.295
OD –0.369 –0.108
Tag 0.651 –0.250
NT –0.757 0.304
NO3 –0.505 0.181
NH4 –0.689 0.304
PT –0.428 0.017
PO4 –0.757 0.385
between the sites and were higher at ED, pointing out the highest trophic status of this region and confirming the hypothesis. There was no short-term temporal variability, when considered the collection days, indicating that from the 21st day, the community had been more stable, characterizing the mature stage of the succession process. It must be considered that further studies should be performed in order to evaluate other community attributes as sensors of environmental quality of the lake, and to examine in details other stages of the succession process in these ones and in other regions of the lake to evaluate the responses of the community facing these stressing agents.
Acknowledgements
The authors thank to the Fishermen Association of the Juara Lake for logistic support during the samplings, to Dr. Carla Ferragut and Doctor graduate student Eduardo Schettini Costa for their suggestions and help in analyses of nutrients, and to CAPES/PPGBV for the scholarship to the first author.
References
ALVES, RCP. and BACCARIN, AE. 2005. Efeito da produção de peixes em tanques-rede sobre a sedimentação de materiais em suspensão e de nutrientes no córrego da Arribada (UHE Nova Avanhandava, Baixo Rio Tiete, SP). In NOGUEIRA, MG., HENRY R. and JORCIN, A., orgs. Ecologia de reservatórios: impactos potenciais, ações de manejo e sistemas em cascata. São Carlos: Rima. 472 p. American Publication Health Association - APHA. 2005.
Standart Methods for the Examination of Water and Wastewater. Washington: APHA.
BICUDO, DC. 1990. Considerações sobre metodologias de contagem de algas do perifiton. Acta Limnologica Brasiliensia, vol. 3, no. 1, p. 459-475.
BLANCO, S., ROMO, S., FERNANDEZ-ALAEZAND, M. and BÉCARES, E. 2008. Response of epiphytic algae to nutrient loading and fish density in a shallow lake: a mesocosm experiment. Hydrobiologia, vol. 600, no. 1, p. 65-76. http://dx.doi.org/10.1007/ s10750-007-9176-0
BROTAS, V., MENDES, CR. and CARTAXANA, P. 2007. Microphytobenthic biomass assessment by pigment analysis: comparison of spectrophotometry and High Performance Liquid Chromatography methods. Hydrobiologia, vol. 587, no. 1, p. 19-24. http://dx.doi.org/10.1007/s10750-007-0680-z CAMARGO, AFM., BINI, LM. and SCHIAVETTI,
A. 1995. Avaliação dos impactos provocados pelas descargas de esgotos orgânicos em alguns corpos and Cyanophyceae for the biovolume. The
greatest contribution of Chlorophyceae for algal biovolume was also registered in other studies (Blanco et al., 2008; DeNicola et al., 2006; Ferragut and Bicudo, 2009). Despite the relative predominance, Chlorophyceae was not different between sampling sites and succession days, considering its absolute biovolume. The classes Cyanophyceae and Coscinodiscophyceae have presented a greater biovolume in the ED site, in all succession days. Blanco et al. (2008) reported an opposite pattern, i.e. with increasing nutrient levels there was no increase in Cyanophyceae biovolume. However, in the present study it was observed that this increase in biovolume can be due to the occurrence of filamentous algae in ED (with greater biovolume), once the unicellular algae have been more representative in the TR site.
Luttenton and Lowe (2006) related the differences in the biovolume of green algae to the higher molar concentration of nitrogen, rather than the N: P ratio. This observation was corroborated by our results, where the class Chlorophyceae was favored in the ED site due to the greater values of nitrogen. Both sites presented a high TN: TP ratio, especially in the ED site. The values of total phosphorus were similar between the two sites, evidencing the similar availability of phosphorus, strengthening the hypothesis that nitrogen explains the greater development of green algae at ED.
Chlorophyll-b and carotenoids had no significant differences between the sites, despite the change in representativeness of the classes for the biovolume. Chlorophyll-a presented significant responses for
the different impacts, being higher at ED. The increase in Chlorophyceae biovolume in the ED site is related to the higher values of chlorophyll-a
on this site, which might be associated with the nutrients’ concentration of this region of the lake.
The dry weight and the ash-free dry weight did not present variation along the colonization days neither between sampling sites, highlighting a similarity between the effects caused by the different human impacts on the limnological conditions and consequently on the periphyton community.
5. Conclusion
T. 1999. Biovolume calculation for pelagic and benthic microalgae. Journal of Phycology, vol. 35, no. 2, p. 403-424. http://dx.doi.org/10.1046/j.1529-8817.1999.3520403.x
Instituto Capixaba de Pesquisa, Assistência Técnica e Extensão Rural - INCAPER. 2010. SIAG - Serviço de Informações Agrometereológicas. Available from: <http://www.incaper.es.gov.br>. Access in: 13 abr. 2010.
JEPPESEN, E., SONDERGAARD, M., MAZZEO, N., MEERHOFF, M., BRANCO, CC, HUSZAR, V. and SCASSO, F. 2005. Lake restoration and biomanipulation in temperate lakes: relevance for subtropical and tropical lakes. In REDDY, MV., ed. Restoration and management of tropical eutrophic lakes. Oxford: Oxford and IBH Publishing Co. Pvt. Ltd. 534 p.
KAHLERT, M. and PETTERSON, K. 2002. The impact of substrate and lake trophy on the biomass and nutrient status of benthic algae. Hydrobiologia, vol. 486, no. 1998, p. 161-169.
KJERFVE, B. 1994. Coastal lagoon processes. In KJERFVE, B., ed. Coastal lagoon processes. Amsterdam: Elsevier Oceanography Series. 598 p. KOROLEFF, F. 1976. Determination of nutrients. In
GRASSHOFF, K., ed. Methods of sea water analysis. New York: Verlag Chemie. 317 p.
LIBORIUSSEN, L. and JEPPESEN, E. 2006. Structure, biomass, production and depth distribution of periphyton on artificial substratum in shallow lakes with constrasting nutrient concentrations. Freshwater Biology, vol. 51, no. 1, p. 95-109. http://dx.doi. org/10.1111/j.1365-2427.2005.01481.x
LORENZEN, CJ. 1967. Determination of chlorophyll and pheopigments: spectrophotometric equations. Limnology and Oceanography, vol. 12, no. 2, p. 343-346. http://dx.doi.org/10.4319/ lo.1967.12.2.0343
LUND, JWG., KIPLIND, C. and LECREN, ED. 1958. The inverted microscope method of estimating algal number and the statistical basis of estimating by counting. Hydrobiologia, vol. 11, no. 2, p. 143-170. http://dx.doi.org/10.1007/BF00007865
LUTTENTON, MR. and LOWE, RL. 2006. Response of a lentic periphyton community to nutrient enrichment at low N:P ratios. Journal of Phycology, vol. 42, no. 5, p. 1007-1015. http://dx.doi. org/10.1111/j.1529-8817.2006.00254.x
MACKERETH, FJH., HERON, J. and TALLING, JF. 1978. Water analysis: Some revised methods for limnologists. Kendall: Titus Wilson and Son Ltd. 120 p.
McCUNE, B. and MEFFORD, MJ. 1999. PC-ORD: Multivariate Analysis of Ecological Data. Version 4.0.MjM Software Design. Oregon: Gleneden Blach.
d’água do município de Rio Claro. Oecologia Brasiliensis, vol. 1, p. 395-406.
CARMOUZE, J. 1994. O metabolismo dos ecossistemas aquáticos: Fundamentos teóricos, métodos de estudo e análises químicas. São Paulo: Edgard Blücher. 254 p. DENICOLA, DM., EYTO, E., WEMAERE, A. and
IRVINE, K. 2006. Periphyton responses to nutrient addition in 3 lakes of different benthic productivity. Journal of the North America Benthological Society, vol. 25, no. 3, p. 616-613. http://dx.doi. org/10.1899/0887-3593(2006)25[616:PRTNAI] 2.0.CO;2
DODDS, WK. and BIGGS, BJF. 2002. Water velocity attenuation by stream periphyton and macrophytes in relation to growth form and architecture. Journal of the North America Benthological Society, vol. 21, no. 1, p. 2-15. http://dx.doi.org/10.2307/1468295 DODDS, WK., SMITH, VH. and LOHMAN, K. 2002.
Nitrogen and phosphorus relationships to benthic algas biomass in temperate streams. Canadian Journal of Fisheries and Aquatic Sciences, vol. 59, no. 5, p. 865-874. http://dx.doi.org/10.1139/f02-063 ENGLE, DL. and MELACK, JM. 1993. Consequences
of riverine flooding for seston and the periphyton of floating meadows in an Amazon floodplain lake. Limnolog y and Oceanography, vol. 38, no. 7, p. 1500-1520. http://dx.doi.org/10.4319/ lo.1993.38.7.1500
FERRAGUT, C. and BICUDO, DC. 2009. Efeitos de diferentes níveis de enriquecimento por fósforo sobre a estrutura da comunidade perifítica em represa oligotrófica tropical (São Paulo, Brasil). Revista Brasileira de Botânica, vol. 32, no. 3, p. 569-583. http://dx.doi.org/10.1590/S0100-84042009000300015
FERRAGUT, C. and BICUDO, DC. 2010. Periphytic algal community adaptative strategies in N and P enriched experiments in a tropical oligotrophic reservoir. Hydrobiologia, vol. 646, no. 1, p. 295-309. http://dx.doi.org/10.1007/s10750-010-0168-0 GOLTERMAN, HL., CLYMO, RS. and OHNSTAD,
MAM. 1978. Methods for chemical analysis of freshwater. Oxford: Blackwell Scientific Publications. 172 p.
Google Earth. 2012. Google Earth Software v. 6.01. HENRY-SILVA, GG. and CAMARGO, AFM. 2000.
Impacto do lançamento de efluentes urbanos sobre alguns ecossistemas aquáticos do município de Rio Claro-SP. PUC-SP Ciências Biológicas e do Ambiente, vol. 2, no. 3, p. 317-330.
HILL, WR. and FANTA, SE. 2008. Phosphorus and light colimit periphyton growth at subsaturating irradiances. Freshwater Biology, vol. 53, no. 2, p. 215-225.
relationships, thresholds and frequency distributions guide nutrient criterion development. Journal of the North America Benthological Society, vol. 27, no. 3, p. 783-799. http://dx.doi.org/10.1899/07-077.1 STEVENSON, RJ., BOTHWELL, ML. and LOWE,
RL., eds. 1996. Algal Ecology: Freshwater benthics ecosistems. San Diego: Academic Press. 753 p. STRICKLAND, JDH. and PARSONS, TR. 1960. A
Manual of Sea Water Analysis. Canada: Fisheries Research Board. 203 p.
SUN, J. and LIU, D. 2003. Geometric models for calculating cell biovolume and surface area of phytoplankton. Journal of Phytoplankton Research, vol. 25, no. 11, p. 1331-1346. http://dx.doi. org/10.1093/plankt/fbg096
TERBRAAK, CJF. 1986. Canonical correspondence analysis: A new eigenvector technique for multivariate direct gradient analysis. Ecology, vol. 67, no. 5, p. 1167-1179. http://dx.doi.org/10.2307/1938672 TUNDISI, JG. and MATSUMURA-TUNDISI, T. 2008.
Limnologia. São Paulo: Oficina de Textos. 632 p. UTERMÖHL, H. 1958. Zur vervollkommung der
quantitativen phytoplankton: methodik. Mitteilungen Internationale Vereinigung für Theoretische und Angewandte Limnologie, vol. 9, p. 1-38.
VA D E B O N C O E U R , Y. , P E T E R S O N , G . , ZANDENAND, MJV. and KALFF, J. 2008. Benthic algal production across lake size gradients: interactions among morphometry, nutrients and light. Ecology, vol. 89, no. 9, p. 2542-2552. PMid:18831175. http://dx.doi.org/10.1890/07-1058.1
VALDERRAMA, JC. 1981. The simultaneous analysis of total nitrogen and phosphorus in natural waters. Marine Chemistry, vol. 10, no. 2, p. 109-122. http:// dx.doi.org/10.1016/0304-4203(81)90027-X VAN DER GRINTEN, E., JANSSEN, APHM.,
MUTSERT, K., BARRANGUETAND, C. and ADMIRAAL, W. 2005. Temperature- and light-dependent performance of the cyanobacterium Leptolyngbya foveolarum and the diatom Nitzschia perminuta in mixed biofilms. Hydrobiologia, vol. 548, no. 1, p. 267-278. http://dx.doi.org/10.1007/ s10750-005-5324-6
Received: 21 March 2012 Accepted: 29 October 2012 MOLICA, R. and AZEVEDO, S. 2009. Ecofisiologia de
cianobactérias produtoras de cianotoxinas. Oecologia Brasiliensia, vol. 13, no. 2, p. 229-246. http://dx.doi. org/10.4257/oeco.2009.1302.02
MURAKAMI, EA. and RODRIGUES, L. 2009. Resposta das algas perifíticas às alterações de temperatura e ao enriquecimento artificial de nutrientes em curto período de tempo. Acta Scientiarum. Biological Sciences, vol. 31, no. 2, p. 273-284.
PAN, Y., STEVENSON, RJ., VAITHIYANATHAN, P., SLATE, J. and RICHARDSON, CJ. 2000. Changes in algal assemblages along observed and experimental phosphorus gradients in a subtropical wetland, U.S.A. Freshwater Biology, vol. 44, no. 2, p. 339-353. http://dx.doi.org/10.1046/j.1365-2427.2000.00556.x
PARSONS, TR., TAKAHASHI, M. and HARGRAVE, B. 1984. Biological Oceanographic Process. Oxford: Pergamon Press Ltd. 344 p.
POMPÊO, MLM. and MOSCHINI-CARLOS, V. 2003. Macrófitas aquáticas e perifíton: aspectos ecológicos e metodológicos. São Carlos: Rima. 134 p. SANTOS, IR., COSTA, RC., FREITAS, U. and
FILLMANN, G. 2008. Influence of effluents from a wastewater treatment plant on nutrient distribution in a coastal creek from southern Brazil. Brazilian Archives of Biology and Technology, vol. 51, no. 2, p. 153-174.
Serra (Municipio). 2010. Available from: <http://www. serra.es.gov.br>. Access in: 21 set. 2010.
SMITH, SM. and LEE, KD. 2006. Responses of periphyton to artificial nutrient enrichment in freshwater kettle ponds of Cape Cod National Seashore. Hydrobiologia, vol. 571, no. 1, p. 201-211. http://dx.doi.org/10.1007/s10750-006-0239-4 StatSoft. 2004. STATISTICA (data analysis software
system). version 7. StatSoft Inc.
STEVENSON, RJ. and SMOL, JP. 2003. Use of algae in environmental assessments. In WEHR, JD. and SHEATH, RG., eds. Freshwater algae of North America: ecology and classification. San Diego: Academic Press. 917 p.