pristine and impacted regions of Brazil
Martinelli, LA.
a*, Coletta, LD.
a, Ravagnani, EC.
a, Camargo, PB.
a,
Ometto, JPHB.
b, Filoso, S.
cand Victoria, RL.
aaCentro de Energia Nuclear na Agricultura – CENA, Universidade de São Paulo – USP, Av. Centenário, 303, CEP 13416-000, Piracicaba, SP, Brazil
bPrograma Internacional Geosfera-Biosfera – IGBP, Brazilian Office, Instituto Nacional de Pesquisas Espaciais – INPE, Av. dos Astronautas, 1756, São José dos Campos, SP, Brazil
cChesapeake Biological Lab, University of Maryland Center for Environmental Science – UMCES, 1 Williams St., Solomons, MD20688, USA
*e-mail: [email protected]
Received January 8, 2010 – Accepted June 5, 2010 – Distributed October 31, 2010 (With 6 figures)
Abstract
Riverine nitrogen distribution is increasingly controlled by anthropogenic activities in their watersheds, regardless of spatial scale, climate, and geographical zone. Consequently, modelling efforts to predict the export of nitrogen from rivers worldwide have used attributes such as population density, land use, urbanization and sanitation. These models have greatly enhanced our understanding of the sources and fate of nitrogen added to terrestrial systems and transported to rivers and streams, especially for developed countries of the North temperate zone. However, much of the world’s population lives in developing countries of the tropics, where the effects of human activities on riverine N exports are still poorly understood. In an effort to close this gap, we compare riverine nitrogen data from 32 Brazilian rivers draining two contrasting regions in this tropical country in terms of economic development - the State of São Paulo and the Amazon. Our data include nitrogen in different dissolved forms, such as Dissolved Inorganic Nitrogen (DIN) and Dissolved Organic Nitrogen (DON). The results show that nitrogen concentrations decreased as river runoff increased in both study areas, and that concentrations were significantly higher in rivers draining the most economically developed region. The relationships between nitrogen concentrations and fluxes with demographic parameters such as population density were also determined and compared to those in temperate systems. In contrast to temperate watersheds, we found that nitrogen fluxes increased only after population densities were higher than 10 individuals per km2.
Keywords: nitrogen, river, pollution, Piracicaba basin, Amazon basin, Brazil.
Nitrogênio dissolvido em rios de regiões distintas do Brasil
Resumo
A carga do nitrogênio em rios é cada vez mais controlada por atividades humanas independentemente da escala espacial, do clima, ou da região geográfica. Consequentemente, esforços de modelagem que predizem exportação de nitrogênio usam atributos que refletem atividades humanas, tais quais, densidade populacional, uso do solo, urbanização e saneamento ambiental. Estes modelos têm aumentado significativamente nosso entendimento sobre as fontes e destino do nitrogênio adicionado ao sistema terrestre e transportado aos sistemas aquáticos, especialmente em países desenvolvidos localizados no Hemisfério Norte. Entretanto, a maioria da população mundial vive em países em desenvolvimento dos trópicos, onde os efeitos das atividades humanas sobre a carga de nitrogênio nos rios são pobremente entendidos. Em um esforço para aumentar nossa compreensão sobre este fenômeno, comparamos a distribuição de nitrogênio dissolvido em 32 rios brasileiros, drenando duas regiões contrastantes em termos de desenvolvimento econômico – rios do Estado de São Paulo e da região Amazônica. Nossos dados incluem nitrogênio em duas formas dissolvidas: inorgânica (NID) e orgânica (NOD). Os resultados mostraram que, em ambas as áreas de estudo, a concentração de nitrogênio decresceu com o volume de água dos rios e as concentrações mais elevadas foram encontradas na região economicamente mais desenvolvida. A correlação entre as concentrações e fluxos de nitrogênio com parâmetros demográficos tais quais densidade de população demonstraram que o fluxo de nitrogênio aumenta somente após a densidade populacional atingir 10 indivíduos por km2.
1. Introduction
Mankind has substantially altered the nitrogen cycle at the local, regional and global scales by doubling the amount of reactive N inputs on Earth. This is especially important because as nitrogen is limiting to the growth of plants and animals, the increase in the amount of reactive nitrogen added to ecosystems worldwide acts like a global nitrogen fertilisation experiment, for which several environmental consequences have already been fully described in the literature (Vitousek et al., 1997; Galloway et al., 2008).
In aquatic systems worldwide, the most significant effect of high rates of nitrogen inputs is euthrophication (UNEP, 2003). The same problem that affects the Gulf of Mexico (Rabalais, 2002) affects water bodies in China (Li and Zhang, 1999) and in Brazil (Matsumura-Tundisi and Tundisi, 2005), impacts fisheries, and results in great biodiversity and economic losses associated with degradation of water quality.
As anthropogenic inputs of nitrogen increases worldwide, various models have attempted to determine the total flux of riverine nitrogen into oceans, which has been recently estimated to range from 40 to 60 Tg.N.yr–1 (Boyer et al., 2006). This quantity is relatively small in comparison to the amount of new nitrogen created by human activities in 2005 (190 Tg.N.yr–1) and by natural nitrogen biological fixation (110 Tg.N.yr–1) (Galloway et al., 2004). However, despite being a fraction (~20%) of the total amount added to the global landscape, riverine N fluxes are clearly controlled by human activities in their watersheds, regardless of spatial scale, climate, and geographical zone (Boyer et al., 2006; Filoso et al., 2006). Bouwman et al. (2005) estimated that on a global scale, half of N riverine fluxes originate from anthropogenic activities.
Accordingly, most modelling efforts to estimate the export of nitrogen from rivers worldwide have used attributes such as population density, land use, urbanisation and sanitation (Howarth et al., 1996; Seitzinger and Kroeze, 1998; Green et al., 2004; Bouwman et al., 2005; Dumont et al., 2005; Boyer et al., 2006).
Much less information about nitrogen content in rivers is available for the developing countries of the world located in tropical areas. So far, we know that in pristine rivers and streams of the tropics, N export is high when compared to those in the temperate zone (Lewis et al., 1999), perhaps as a result of lower N limitation in tropical terrestrial ecosystems. In human altered watersheds of the tropics, higher N export rates have also been reported (Filoso et al., 2003; Boyer et al., 2006; Borbor-Cordova et al., 2006). In particular, the loading of domestic sewage directly into rivers and water bodies without any previous treatment, assumes a very important role in developing countries of the tropics (UNESCO, 2003).
Considering the above mentioned facts, we ask the following questions:
1) Do human-altered regions of the tropics have higher nitrogen concentrations than less altered regions?
2) Does the correlation observed for temperate rivers between dissolved N loads and landscape attributes or human population hold for tropical rivers? 3) Are dissolved N loads higher in tropical than
temperate watersheds with similar runoff? We address these questions by assessing the concentrations and loads of Dissolved Inorganic Nitrogen (DIN), Dissolved Organic Nitrogen (DON), and Total Dissolved Nitrogen (TDN) in Brazilian rivers draining tropical and sub-tropical watersheds with different degrees of impact. Rivers located in the State of São Paulo drain mostly highly developed watersheds which, like in disturbed watersheds of developed countries, combine traces of original vegetation with areas of intensive managed crops and fairly high rates of nitrogen fertilizer application, high population densities with most people living in urban and suburban regions, and industrialisation (Filoso et al., 2006). Rivers in the Amazon region drain mostly pristine areas, with low population densities and low rates of urbanization (Filoso et al., 2006). In areas with high deforestation rates, the original forest is generally replaced by pasture with low intensity management practices and no use of nitrogen fertilizer.
2. Study Area
Two contrasting regions - We studied rivers of the State
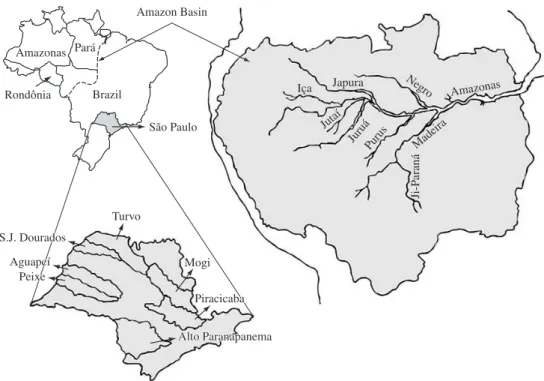
of São Paulo and rivers in the Amazon region, including three States: Amazonas, Pará and Rondônia (Figure 1). The State of São Paulo is located in Southeastern Brazil and encompasses approximately 250,000 km2, a population of 42 million people in 2007, and a population density of 168 inhabitants per km2. São Paulo produces 30% of the Brazilian Gross Domestic Product (GDP) through a variety of services and a vigorous agribusiness sector concentrated mainly on sugarcane and citrus (SEADE, 2006).
Figure 1. Study area showing a map of Brazil and the Amazon basin with the three main states involved in this study –
Amazonas, Pará and Rondônia; and the State of São Paulo with the seven major watersheds included in this study.
and associated with low intensity practices such as large livestock ranches.
In economic terms, the sum of the GDP from the three States of the Amazon is equivalent to approximately 15% of the GDP of the State of São Paulo (IBGE, 2008).
Across all study sites, population densities and percentage area of forest within watersheds were negatively correlated (Figure 2a). The smallest rural catchments, which were not populated but have been forested to different degrees, are evident outliers. Study sites are clearly divided into two groups: one that represents the larger watersheds of the Amazon region (Figure 2b), where population density is low and percentage forest cover high, and a second group including smaller rivers in São Paulo State, where population densities are high and forest cover much lower.
The rivers of the State of São Paulo – We sampled a total of 19 rivers in São Paulo in seven different watersheds (Figure 1). As we sampled in more than one site in some rivers, we had a total of 36 sampling sites (Table 1). Ten of these 19 rivers belong to watersheds that are among the largest of the State (Table 1). These watersheds were sampled once or twice a month for at least 18 months and their size varies from 5,000 to 20,000 km2, discharging approximately 10 to 300 m3.s–1 (Table 1). The most pristine is the Paranapanema and the most impacted the Piracicaba, which has a population density ten times greater than in sub-catchments of the Paranapanema basin (Table 1), and receives large sewage discharges. As most of the sewage is not treated in the State of São Paulo (Martinelli et al., 2002) and in Brazil in general (IBGE 2000, 2002) rivers
draining highly populated areas receive a high load of labile organic matter, proportional to the population density.
Nine out of the 19 rivers sampled in the State of São Paulo are small streams belonging to watersheds varying approximately from 10 to 100 km2 and with discharges from 0.2 to 3 m3.s–1 (Table 1). We sampled these small rivers monthly for approximately 12 months (Table 1). Some of these streams drain the most pristine areas registered in our database for the State of São Paulo, with 100% of intact forest cover and no inhabitants within a protected state park. The other streams drain catchments with relatively low population densities but a low percentage of original vegetation (Table 1). The Piracicamirim stream (sampling site Pisca), especially the outermost reach, is different for all of the other streams because it drains a large urban area.
The rivers of the Amazon Region – The Amazon is
30,000 m3.s–1. We sampled these large rivers roughly 3 times a year for 3 years (Table 1).
The Ji-Paraná River is a tributary of the Madeira River (Figure 1), and at sampling site number 4, the watershed size was almost 30,000 km2 and the discharge for the sampling period close to 2,000 m3.s–1 (Table 1). The two sampling sites of the Ji-Paraná correspond to catchment areas with the highest population densities in the Amazon, varying from 11 to 14 inhabitants per km2, and also with one of the highest percentage of deforested areas in the entire region with only 50% of the original forest remaining (Table 1). The Comemoração and Pimenta Bueno rivers are tributaries of the Ji-Paraná River (Figure 1) and their watersheds are 5,000 to 10,000 km2 and discharges range from approximately 150 to 200 m3.s–1 (Table 1). Population densities are smaller in these two catchments compared to those of the Ji-Paraná sampling sites while the percentage forest cover is slightly higher (Table 1). These rivers were sampled approximately 3 times per year for two years (Table 1).
The two smallest study watersheds of the Amazon region are also located in the Ji-Paraná basin, on a cattle ranch in the rural area. The forest watershed is covered with 25% of pastureland and 75% of forest (Table 1). These watersheds were sampled 10 to 14 times a year for approximately 3 years (Table 1).
3. Material and Methods
The area of each watershed and land cover data were obtained using remote sensing techniques combined with geographic information systems described in Bernardes et al. (2004). The only exception to this procedure was the Óbidos sampling site on the Amazon River, where we assumed that the percentage deforested area was the same as for the Brazilian Amazon estimated by Instituto Nacional de Pesquisas Espaciais (INPE).
Figure 2. a) Population density versus forest cover (%) of basins of the State of São Paulo and Amazon region. The unpopulated small watersheds are highlighted in the graphic. b) Basin area versus average river discharges of basins of the State of São Paulo and Amazon region.
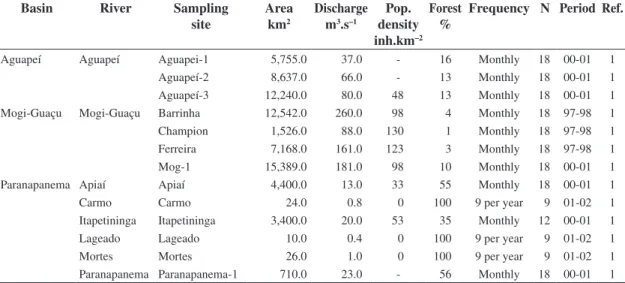
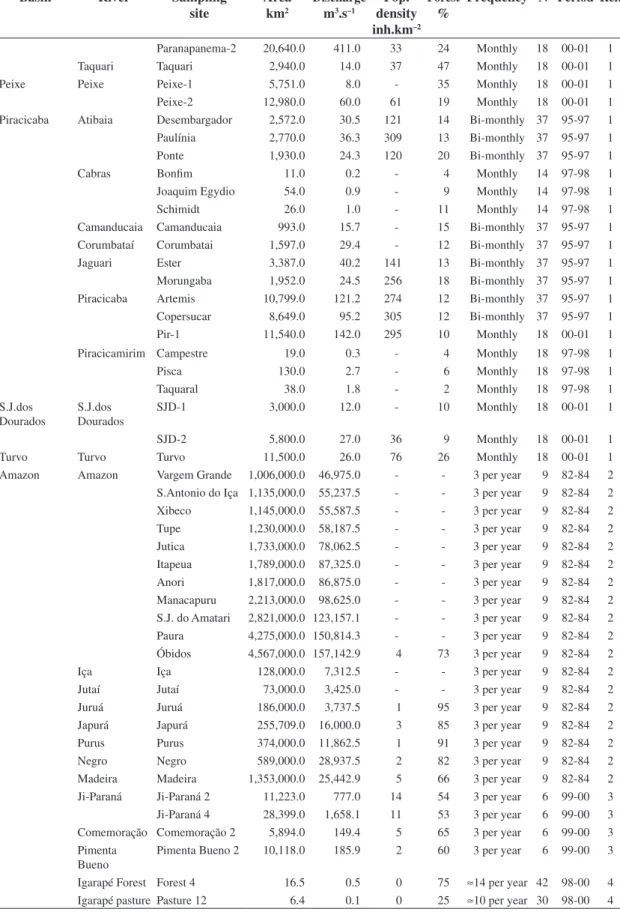
Table 1. Basins, rivers, sampling sites, basin areas, discharges, population density, forest cover, sampling frequency and
period of the data used in this study.
Basin River Sampling site
Area km2
Discharge m3.s–1
Pop. density inh.km–2
Forest %
Frequency N Period Ref.
Aguapeí Aguapeí Aguapei-1 5,755.0 37.0 - 16 Monthly 18 00-01 1
Aguapeí-2 8,637.0 66.0 - 13 Monthly 18 00-01 1
Aguapeí-3 12,240.0 80.0 48 13 Monthly 18 00-01 1
Mogi-Guaçu Mogi-Guaçu Barrinha 12,542.0 260.0 98 4 Monthly 18 97-98 1
Champion 1,526.0 88.0 130 1 Monthly 18 97-98 1
Ferreira 7,168.0 161.0 123 3 Monthly 18 97-98 1
Mog-1 15,389.0 181.0 98 10 Monthly 18 00-01 1
Paranapanema Apiaí Apiaí 4,400.0 13.0 33 55 Monthly 18 00-01 1
Carmo Carmo 24.0 0.8 0 100 9 per year 9 01-02 1
Itapetininga Itapetininga 3,400.0 20.0 53 35 Monthly 12 00-01 1
Lageado Lageado 10.0 0.4 0 100 9 per year 9 01-02 1
Mortes Mortes 26.0 1.0 0 100 9 per year 9 01-02 1
Paranapanema Paranapanema-1 710.0 23.0 - 56 Monthly 18 00-01 1
Basin River Sampling site
Area km2
Discharge m3.s–1
Pop. density inh.km–2
Forest %
Frequency N Period Ref.
Paranapanema-2 20,640.0 411.0 33 24 Monthly 18 00-01 1
Taquari Taquari 2,940.0 14.0 37 47 Monthly 18 00-01 1
Peixe Peixe Peixe-1 5,751.0 8.0 - 35 Monthly 18 00-01 1
Peixe-2 12,980.0 60.0 61 19 Monthly 18 00-01 1
Piracicaba Atibaia Desembargador 2,572.0 30.5 121 14 Bi-monthly 37 95-97 1
Paulínia 2,770.0 36.3 309 13 Bi-monthly 37 95-97 1
Ponte 1,930.0 24.3 120 20 Bi-monthly 37 95-97 1
Cabras Bonfim 11.0 0.2 - 4 Monthly 14 97-98 1
Joaquim Egydio 54.0 0.9 - 9 Monthly 14 97-98 1
Schimidt 26.0 1.0 - 11 Monthly 14 97-98 1
Camanducaia Camanducaia 993.0 15.7 - 15 Bi-monthly 37 95-97 1
Corumbataí Corumbatai 1,597.0 29.4 - 12 Bi-monthly 37 95-97 1
Jaguari Ester 3,387.0 40.2 141 13 Bi-monthly 37 95-97 1
Morungaba 1,952.0 24.5 256 18 Bi-monthly 37 95-97 1
Piracicaba Artemis 10,799.0 121.2 274 12 Bi-monthly 37 95-97 1
Copersucar 8,649.0 95.2 305 12 Bi-monthly 37 95-97 1
Pir-1 11,540.0 142.0 295 10 Monthly 18 00-01 1
Piracicamirim Campestre 19.0 0.3 - 4 Monthly 18 97-98 1
Pisca 130.0 2.7 - 6 Monthly 18 97-98 1
Taquaral 38.0 1.8 - 2 Monthly 18 97-98 1
S.J.dos Dourados
S.J.dos Dourados
SJD-1 3,000.0 12.0 - 10 Monthly 18 00-01 1
SJD-2 5,800.0 27.0 36 9 Monthly 18 00-01 1
Turvo Turvo Turvo 11,500.0 26.0 76 26 Monthly 18 00-01 1
Amazon Amazon Vargem Grande 1,006,000.0 46,975.0 - - 3 per year 9 82-84 2 S.Antonio do Iça 1,135,000.0 55,237.5 - - 3 per year 9 82-84 2
Xibeco 1,145,000.0 55,587.5 - - 3 per year 9 82-84 2
Tupe 1,230,000.0 58,187.5 - - 3 per year 9 82-84 2
Jutica 1,733,000.0 78,062.5 - - 3 per year 9 82-84 2
Itapeua 1,789,000.0 87,325.0 - - 3 per year 9 82-84 2
Anori 1,817,000.0 86,875.0 - - 3 per year 9 82-84 2
Manacapuru 2,213,000.0 98,625.0 - - 3 per year 9 82-84 2 S.J. do Amatari 2,821,000.0 123,157.1 - - 3 per year 9 82-84 2
Paura 4,275,000.0 150,814.3 - - 3 per year 9 82-84 2
Óbidos 4,567,000.0 157,142.9 4 73 3 per year 9 82-84 2
Iça Iça 128,000.0 7,312.5 - - 3 per year 9 82-84 2
Jutaí Jutaí 73,000.0 3,425.0 - - 3 per year 9 82-84 2
Juruá Juruá 186,000.0 3,737.5 1 95 3 per year 9 82-84 2
Japurá Japurá 255,709.0 16,000.0 3 85 3 per year 9 82-84 2
Purus Purus 374,000.0 11,862.5 1 91 3 per year 9 82-84 2
Negro Negro 589,000.0 28,937.5 2 82 3 per year 9 82-84 2
Madeira Madeira 1,353,000.0 25,442.9 5 66 3 per year 9 82-84 2
Ji-Paraná Ji-Paraná 2 11,223.0 777.0 14 54 3 per year 6 99-00 3 Ji-Paraná 4 28,399.0 1,658.1 11 53 3 per year 6 99-00 3 Comemoração Comemoração 2 5,894.0 149.4 5 65 3 per year 6 99-00 3 Pimenta
Bueno
Pimenta Bueno 2 10,118.0 185.9 2 60 3 per year 6 99-00 3
Igarapé Forest Forest 4 16.5 0.5 0 75 ≈14 per year 42 98-00 4
Igarapé pasture Pasture 12 6.4 0.1 0 25 ≈10 per year 30 98-00 4 1 – This study; 2 – Richey et al. (1986); 3 – Bernardes et al. (2004); and 4 – Neill et al. (2001).
The population densities of the watersheds of the State of São Paulo and Ji-Paraná in the Amazon were estimated by determining the size of the watershed and the population living in these areas obtained by demographic census of the counties for each watershed (IBGE, 2008), as described in Martinelli et al. (2002). For the entire Amazon watershed and its major tributaries, the population densities were obtained from Revenga et al. (1998).
Water discharge of streams was measured using classical hydrological techniques such as the cross-sectional method or weir, depending on the equipment available for each study stream. For the major rivers of the Amazon basin, water discharge data were obtained by a methodology described in Richey et al. (1986). Discharge data for the Ji-Paraná basin was obtained from the Brazilian Water Resources Agency, while data for rivers in São Paulo were obtained from the local state agency (DAEE, 2008).
We assessed the concentrations and loads of N in our study rivers and streams using total dissolved nitrogen (TDN) data, which includes NO3, NH4 and NO2, and dissolved organic nitrogen (DON). We also report concentrations and loads of NO3 because this was the main form of TDN in the study rivers. The concentrations of these parameters were expressed in µM (micro molar) and the loads on an aerial basis in kg of N per hectare per year, calculated using water discharge data and watershed area.
As most of our data did not follow a normal distribution we use appropriate transformations techniques to achieve normality. We first use a Box-Cox transformation in order to indicate the most suitable type of transformation; in our case we choose to convert our data using a natural logarithm. To test for differences between rivers of São Paulo and the Amazon region we used ANCOVA analysis with the transformed data, assuming the basin area as a covariate, because of the difference in river size between the two
areas (Figure 2b). In order to correlate runoff with nitrogen concentrations and trends, we used the Pearson correlation with the transformed data.
We choose to express central trends as median, due to the known normal distribution of our data prior of transformation. However, for the comparison between rivers of São Paulo and rivers of the Amazon region we also showed means values that were back-transformed from means of transformed values (Reich et al., 1999). In order to estimate flux per area basin we multiplied the median nitrogen fraction concentration by the median river discharge and divided by the basin area. In order to correlate flux per area basin with population density we used linear regression between the averages of the transformed data (using natural logarithm) for each basin against population density of each basin.
4. Results
4.1. Comparisons between rivers and streams of the State of São Paulo and of the Amazon region
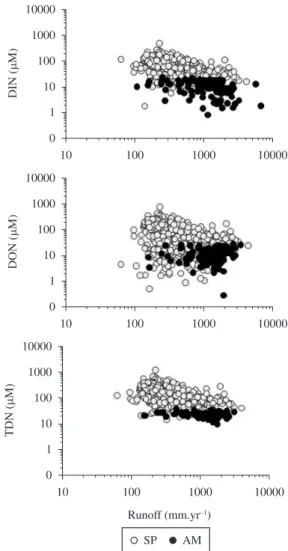
We found significant variability in terms of N concentration among our sampling sites. Dissolved inorganic N varied from 2 to 350 µM, dissolved organic N (DON) from 10 to 500 µM, and total dissolved N (TDN) from 20 to 900 µM (Table 2).
When comparing rivers in the State of São Paulo with those rivers in the Amazon, we observed statistically higher values of nitrogen fractions (P < 0.05) in the rivers of the State of São Paulo (Table 3). The dissolved inorganic nitrogen (DIN) and dissolved organic nitrogen (DON) contributed equally to the composition of TDN concentrations in both regions (Table 3). In São Paulo rivers, however, ammonium accounted for 20% and nitrate for 80% of
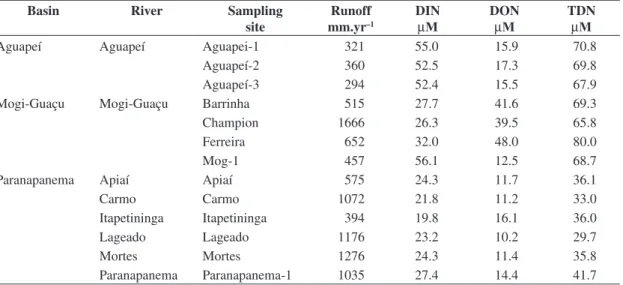
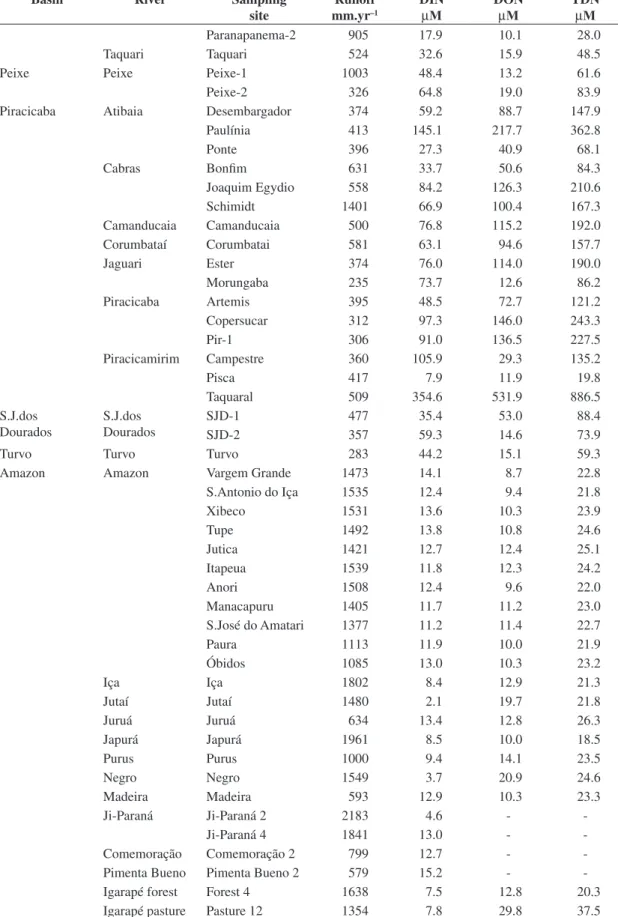
Table 2. Basin, rivers and runoff and dissolved inorganic nitrogen (DIN), dissolved organic nitrogen (DON), total dissolved nitrogen (TDN) median values of the sampling sites.
Basin River Sampling
site
Runoff mm.yr–1
DIN
µM
DON
µM
TDN
µM
Aguapeí Aguapeí Aguapei-1 321 55.0 15.9 70.8
Aguapeí-2 360 52.5 17.3 69.8
Aguapeí-3 294 52.4 15.5 67.9
Mogi-Guaçu Mogi-Guaçu Barrinha 515 27.7 41.6 69.3
Champion 1666 26.3 39.5 65.8
Ferreira 652 32.0 48.0 80.0
Mog-1 457 56.1 12.5 68.7
Paranapanema Apiaí Apiaí 575 24.3 11.7 36.1
Carmo Carmo 1072 21.8 11.2 33.0
Itapetininga Itapetininga 394 19.8 16.1 36.0
Lageado Lageado 1176 23.2 10.2 29.7
Mortes Mortes 1276 24.3 11.4 35.8
Basin River Sampling site
Runoff mm.yr–1
DIN
µM
DON
µM
TDN
µM
Paranapanema-2 905 17.9 10.1 28.0
Taquari Taquari 524 32.6 15.9 48.5
Peixe Peixe Peixe-1 1003 48.4 13.2 61.6
Peixe-2 326 64.8 19.0 83.9
Piracicaba Atibaia Desembargador 374 59.2 88.7 147.9
Paulínia 413 145.1 217.7 362.8
Ponte 396 27.3 40.9 68.1
Cabras Bonfim 631 33.7 50.6 84.3
Joaquim Egydio 558 84.2 126.3 210.6
Schimidt 1401 66.9 100.4 167.3
Camanducaia Camanducaia 500 76.8 115.2 192.0
Corumbataí Corumbatai 581 63.1 94.6 157.7
Jaguari Ester 374 76.0 114.0 190.0
Morungaba 235 73.7 12.6 86.2
Piracicaba Artemis 395 48.5 72.7 121.2
Copersucar 312 97.3 146.0 243.3
Pir-1 306 91.0 136.5 227.5
Piracicamirim Campestre 360 105.9 29.3 135.2
Pisca 417 7.9 11.9 19.8
Taquaral 509 354.6 531.9 886.5
S.J.dos Dourados
S.J.dos Dourados
SJD-1 477 35.4 53.0 88.4
SJD-2 357 59.3 14.6 73.9
Turvo Turvo Turvo 283 44.2 15.1 59.3
Amazon Amazon Vargem Grande 1473 14.1 8.7 22.8
S.Antonio do Iça 1535 12.4 9.4 21.8
Xibeco 1531 13.6 10.3 23.9
Tupe 1492 13.8 10.8 24.6
Jutica 1421 12.7 12.4 25.1
Itapeua 1539 11.8 12.3 24.2
Anori 1508 12.4 9.6 22.0
Manacapuru 1405 11.7 11.2 23.0
S.José do Amatari 1377 11.2 11.4 22.7
Paura 1113 11.9 10.0 21.9
Óbidos 1085 13.0 10.3 23.2
Iça Iça 1802 8.4 12.9 21.3
Jutaí Jutaí 1480 2.1 19.7 21.8
Juruá Juruá 634 13.4 12.8 26.3
Japurá Japurá 1961 8.5 10.0 18.5
Purus Purus 1000 9.4 14.1 23.5
Negro Negro 1549 3.7 20.9 24.6
Madeira Madeira 593 12.9 10.3 23.3
Ji-Paraná Ji-Paraná 2 2183 4.6 -
-Ji-Paraná 4 1841 13.0 -
-Comemoração Comemoração 2 799 12.7 -
-Pimenta Bueno Pimenta Bueno 2 579 15.2 -
-Igarapé forest Forest 4 1638 7.5 12.8 20.3
Igarapé pasture Pasture 12 1354 7.8 29.8 37.5
the DIN fraction, while in the Amazon region the DIN fraction was entirely composed of nitrate (Table 3). A weak inverse correlation between runoff and DIN (r = -0.41), DON (r = -0.20), and runoff and TDN (rs = -0.37) was observed for rivers in São Paulo (Figure 3). Runoff was also negatively correlated with DIN (rs = -0.32) in Amazon rivers, but positively correlated with DON (rs = 0.22). No significant correlation was observed for TDN (Figure 3) in Amazonian rivers.
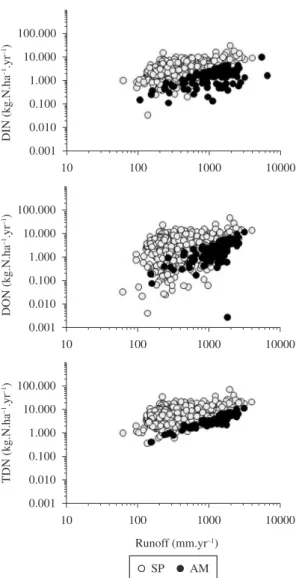
In terms of fluxes on a per area basis, São Paulo rivers exported significantly higher (P < 0.05) amounts of N in all forms than Amazon rivers, despite the fact that the differences between the two regions were not as high as for concentrations (Table 3). Especially in rivers of the Amazon region, N fluxes on a per area basis were significantly correlated to runoff (Figure 4). However, the autocorrelation between N fluxes on a per area basis and runoff created by the calculation of fluxes, where N concentrations are multiplied by runoff, limits our capacity to discuss the implications and consequences of such correlations.
4.2. Comparison between population density and nitrogen fractions
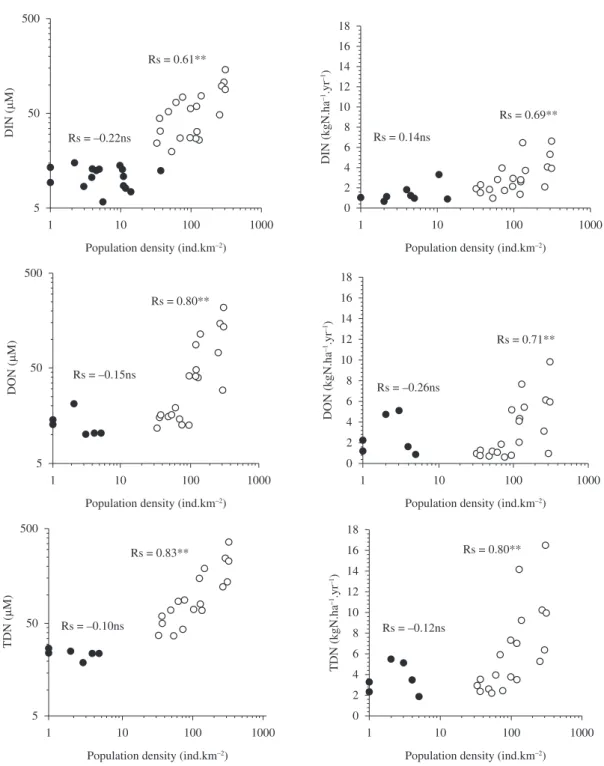
Population density is one of the most commonly used parameters for expressing demographic-human impact on N concentrations and fluxes in large rivers. In our study, we found significant positive correlations between population densities and concentrations and fluxes of N for all forms analysed (DIN, DON and TDN) (Figure 5). In general,
N concentrations progressively increased with population densities above the threshold of 10 inhabitants per km2.
5. Discussion
All forms of N considered in the present study had concentrations and estimated fluxes on a per area basis higher in rivers draining watersheds in the State of São Paulo than in the Amazon region.
We hypothesised that, like in temperate basins, human activities in tropical watersheds increase the amount of nitrogen loaded to rivers and streams from disturbed terrestrial systems (Vitousek et al., 1997; Boyer et al., 2006). We found that population density is a stronger predictor of riverine N export in sub-tropical watersheds, as shown by the strong correlation between population and riverine export in the main basins of the State of São Paulo. Table 3. Number of data, median, and lower and upper
quartile of rivers of the State of São Paulo, and of the Amazon region. Concentrations are expressed in µM and flux in kg.ha–1.yr–1. Different letters indicate statistically
different results at 5% level.
São Paulo
N Median Back-transformed mean
DIN 868 48.46 45.20a
DON 635 43.54 37.64a
TDN 635 91.37 91.48a
Flux DIN 790 2.83 2.90a
Flux DON 612 2.73 2.11a
Flux TDN 618 5.44 5.39a
Amazon
N Median Back-transformed mean
DIN 425 9.00 7.16b
DON 271 11.69 12.02b
TDN 282 22.38 22.78b
Flux DIN 235 1.74 1.64b
Flux DON 194 1.91 1.43b
Flux TDN 197 3.99 3.01b
Figure 3. Runoff versus concentrations of Dissolved
For DIN, 60% of the concentration data variance was explained by population density, in addition of approximately 70% of the variance in DIN and DON fluxes on a per area basis (Figure 5). In the case of DON and TDN concentrations, and TDN flux per basin area, approximately 80% of the variance was explained by population density (Figure 5).
We compared DIN fluxes on a per area basis between tropical and temperate watersheds by plotting this parameter against population densities and, overall, the data from tropical and temperate watersheds yielded similar correlations (Figure 6). The only difference was that for population density of less than 10 individuals per km2, DIN fluxes on a per area basis in the tropical basins yielded values higher than 1 kg.N.ha-1.yr–1, while in temperate basins, the same population density yielded values lower than that. For higher
population densities, data from both regions overlapped along the population density gradient (Figure 6).
This is an important result because it confirms predictions from models that assume that anthropogenic activities in watersheds affect N export in tropical rivers the same way that they affect N export in rivers of other regions of the world. At least for Brazilian watersheds, this assumption seems to be correct regardless of climatic zones and characteristic of human impacts associated with population demographics.
If human activities are indeed responsible for the higher N concentrations and fluxes observed in the State of São Paulo, like in temperate basins, population density can be used to model nitrogen fluxes in tropical rivers, and assess the main sources of riverine N from tropical basins.
Using estimates of N inputs to watersheds, including biological nitrogen fixation (BNF) that occurs in original vegetation biomes; biological nitrogen fixation from agricultural crops (BNF-agr.); fertilizer application, atmospheric deposition and imported/exported food and feed (Galloway et al., 2004; Van Drecht et al., 2005), Filoso et al. (2006) calculated that approximately 25 kg.N.ha–1.yr–1 is added to the entire Amazon basin in contrast to 30 kg.N.ha-1.yr–1 in the State of São Paulo (Table 5). Imported/exported food and feed were not considered because no data were available to calculate these parameters (Filoso et al., 2006).
These inputs are similar to the area weighted average of 31 kg.N.ha-1.yr–1 determined for the sixteen watersheds in the NE USA by Boyer et al. (2002), but less than half the value calculated for the Guyas tropical watershed in Ecuador (Borbor-Cordova et al., 2006), and for Oder and Vistula watersheds of Poland in 2000 (Eriksson et al., 2007).
One of the most disturbed basins of the State of São Paulo is the Piracicaba River basin, which is in our data set and where Filoso et al. (2003) made a detailed study of nitrogen mass balance. Reflecting the degree of its disturbance, the total added nitrogen to this basin was approximately double that of São Paulo State as a whole and similar to the basins of Ecuador and Poland.
Natural biological nitrogen fixation (BNF) is the main nitrogen source in the Amazon basin, being responsible for almost of 85% of the total N added to the system (Filoso et al., 2006). This seems to be case also for other regions of Latin America, as well as for Africa and Oceania (Galloway et al., 2004; Boyer et al., 2006).
In the State of São Paulo and, particularly in the Piracicaba basin, the most important N sources are fertilizers and agricultural BNF (BNF-agr.) (Table 5). In the State of São Paulo natural BNF is responsible for only 6% of the inputs, while in the Piracicaba basin it is less than 4% (Table 5). Fertilizers are also the main N input in watersheds of Ecuador and Poland (Borbor-Cordova, 2006; Eriksson et al., 2007) as well as in continents such as Asia, North America and Europe (Boyer et al., 2006).
Figure 5. Population density of each watershed versus the median concentration and flux per area basin of Dissolved
Figure 6. Population density versus dissolved inorganic average concentration and flux per area basin of rivers l ocated in temperate and tropical regions listed in Table 4.
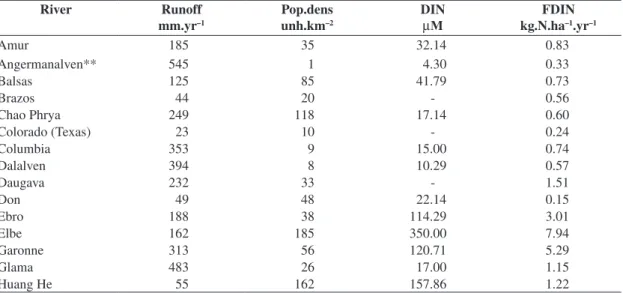
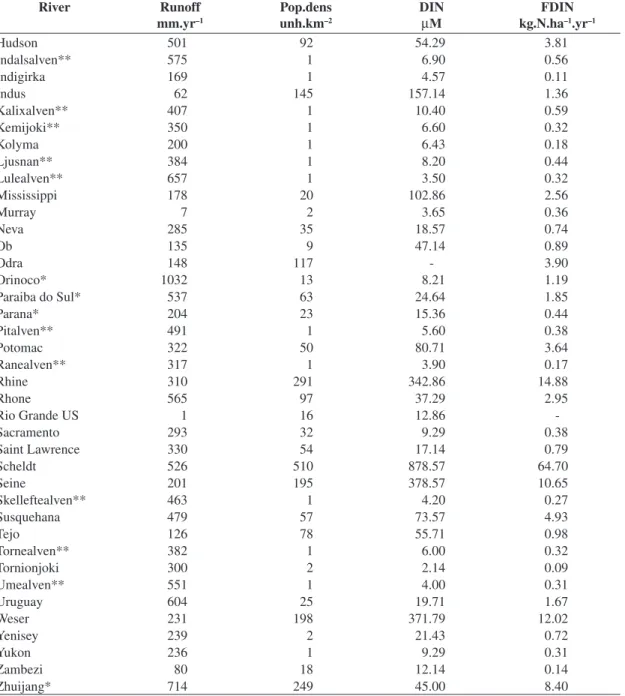
Table 4. Runoff, population density and dissolved inorganic nitrogen (DIN) concentration and flux of dissolved inorganic nitrogen (FDIN) of rivers used to compare with rivers of this study. *Large tropical rivers other than those tropical rivers included in this study. **Large temperate rivers with unknown low population density. To those rivers we assigned a population density of 1 unh.km–2 because we use a logarithm scale on the horizontal axis of Figure 6.
River Runoff
mm.yr–1
Pop.dens unh.km–2
DIN
µM
FDIN kg.N.ha–1.yr–1
Amur 185 35 32.14 0.83
Angermanalven** 545 1 4.30 0.33
Balsas 125 85 41.79 0.73
Brazos 44 20 - 0.56
Chao Phrya 249 118 17.14 0.60
Colorado (Texas) 23 10 - 0.24
Columbia 353 9 15.00 0.74
Dalalven 394 8 10.29 0.57
Daugava 232 33 - 1.51
Don 49 48 22.14 0.15
Ebro 188 38 114.29 3.01
Elbe 162 185 350.00 7.94
Garonne 313 56 120.71 5.29
Glama 483 26 17.00 1.15
Huang He 55 162 157.86 1.22
Although there are extensive areas being burned every year in the Amazon basin as well as in the State of São Paulo, atmospheric deposition, such as in the Guayas Basin in Ecuador (Borbor-Cordova et al., 2006), is a minor source of nitrogen (8%) compared to fertilizers and BNF-ag. On the other hand, atmospheric N deposition comprised approximately 30% of all N inputs in New England watersheds (Boyer et al., 2002), 15-20% in Poland’s watersheds (Eriksson et al., 2007), and 20% in the Piracicaba basin, where extensive areas of sugarcane area are burned every year during the dry season (Lara et al., 2001).
Therefore, it is clear that most of the nitrogen input in the Amazon basin is derived from natural sources, whereas in watersheds of the State of São Paulo, New England, Ecuador and Poland, most of the sources were anthropogenic. It is important to note that in specific areas of developing countries where economic development is vigorous, such as in the Piracicaba and Guayas basins in Brazil and Ecuador, respectively, anthropogenic inputs of nitrogen are in the same order of magnitude or even higher than inputs in highly populated regions of developed countries such as New England in the USA or in transition economies like in Poland (Table 5).
River Runoff mm.yr–1
Pop.dens unh.km–2
DIN
µM
FDIN kg.N.ha–1.yr–1
Hudson 501 92 54.29 3.81
Indalsalven** 575 1 6.90 0.56
Indigirka 169 1 4.57 0.11
Indus 62 145 157.14 1.36
Kalixalven** 407 1 10.40 0.59
Kemijoki** 350 1 6.60 0.32
Kolyma 200 1 6.43 0.18
Ljusnan** 384 1 8.20 0.44
Lulealven** 657 1 3.50 0.32
Mississippi 178 20 102.86 2.56
Murray 7 2 3.65 0.36
Neva 285 35 18.57 0.74
Ob 135 9 47.14 0.89
Odra 148 117 - 3.90
Orinoco* 1032 13 8.21 1.19
Paraiba do Sul* 537 63 24.64 1.85
Parana* 204 23 15.36 0.44
Pitalven** 491 1 5.60 0.38
Potomac 322 50 80.71 3.64
Ranealven** 317 1 3.90 0.17
Rhine 310 291 342.86 14.88
Rhone 565 97 37.29 2.95
Rio Grande US 1 16 12.86
-Sacramento 293 32 9.29 0.38
Saint Lawrence 330 54 17.14 0.79
Scheldt 526 510 878.57 64.70
Seine 201 195 378.57 10.65
Skelleftealven** 463 1 4.20 0.27
Susquehana 479 57 73.57 4.93
Tejo 126 78 55.71 0.98
Tornealven** 382 1 6.00 0.32
Tornionjoki 300 2 2.14 0.09
Umealven** 551 1 4.00 0.31
Uruguay 604 25 19.71 1.67
Weser 231 198 371.79 12.02
Yenisey 239 2 21.43 0.72
Yukon 236 1 9.29 0.31
Zambezi 80 18 12.14 0.14
Zhuijang* 714 249 45.00 8.40
Table 5. Nitrogen balance for basins and regions. Nitrogen inputs (kg N.ha–1.yr–1) included biological nitrogen fixation (BNF), agricultural biological nitrogen fixation (BNF-agr), fertiliser applications, atmospheric deposition and import/export of food and feed.
Basin/Region BNF BNF-agr. Fertiliser Atm deposition Food & feed Total
Amazon basin 21.4 2.6 0.4 0.2 ? 24.6
São Paulo 2.0 14.5 12.1 2.5 ? 31.1
Piracicaba basin 3.4 14.5 23.8 12.0 6.1 59.8
Guayas basin 6.2 4.4 36.8 5.3 -12.9 39.8
NE-USA basins 1.7 7.4 4.7 9.6 7.5 30.9
Oder basin 0 16.0 60.0 14.0 3.4 93.4
Vistula basin 0 16.0 44.0 11.0 3.1 74.1
References
BERNARDES, MC., MARTINELLI, LA., KRUSCHE, AV., GUDEMAN, J., MOREIRA, MZ., VICTORIA, RL., OMETTO, JPHB., BALLESTER, MVR., AUFDENKAMPE, AK., RICHEY, JE. and HEDGES, JI., 2004. Riverine organic matter composition as a function of land use changes, southwest Amazon. Ecological Applications, vol. 14, no. 4, p. 263-279.
BORBOR-CORDOVA, MJ., BOYER, EW., McDOWELL, WH. and HALL, CA., 2006. Nitrogen and phosphorus budgets for a tropical watershed impacted by agricultural land use: Guayas.
Biogeochemistry, vol. 79, no. 1-2, p. 135-161.
BOUWMAN, AF., van DRECHT, G., KNOOP, JM., BEUSEN, AHW. and MEINARDI, CR., 2005. Exploring changes in river nitrogen export to the world’s oceans. Global Biogeochemical Cycles, vol. 19, no. 1.
BOYER, EW., GOODALE, CL., JAWORSK, NA. and HOWARTH, RW., 2002. Anthropogenic nitrogen sources and relationships to riverine nitrogen export in the northeastern USA. Biogeochemistry,
vol. 57, no. 1, p. 137-169.
BOYER, EW., HOWARTH, RW., GALLOWAY, JN., DENTENER, FJ., GREEN, PA. and VÖRÖSMARTY, CJ., 2006. Riverine nitrogen export from the continents to the coasts. Global Biogeochemical Cycles, vol. 20, no. 1.
Brasil. Ministério da Ciência e Tecnologia. Instituto Nacional de Pesquisas Espaciais -INPE., 2008. Projeto Prodes: monitoramento da floresta Amazônica Brasileira por satélite. Available from: <http://www.obt.inpe.br/prodes>. Access in: Maio de 2009.
Brasil. Ministério do Planejamento, Orçamento e Gestão. Instituto Brasileiro de Geografia e Estatística – IBGE., 2008. Available from: <http://www.ibge.gov.br>. Access in: Junho de 2009.
Brasil. Ministério do Planejamento, Orçamento e Gestão. Instituto Brasileiro de Geografia e Estatística, 2002. Pesquisa Nacional de Saneamento Básico 2000 - PNSB. Rio de Janeiro:
IBGE, 431 p.
DRECHT, G. van, BOUWMAN, AF., BOYER, EW., GREEN, P. and SIEBERT, S., 2005. A comparison of global spatial distributions of nitrogen inputs for nonpoint sources and effects on river nitrogen export. Global Biogeochemical Cycles, vol. 19, no. 4.
DUMONT, E., HARRISON, JA., KROEZE, C., BAKKER, EJ. and SEITZINGER, SP., 2005. Global distribution and sources of dissolved inorganic nitrogen export to the coastal zone: results from a spatially explicit, global model. Global Biogeochemical Cycles, vol. 19, no. 4.
ERIKSSON, H., PASTUSZAK, M., LÖFGREN, S., MÖRTH, CM. and HUMBORG, C., 2007. Nitrogen budgets of the Polish agriculture 1960-2000: implications for riverine nitrogen loads to the Baltic Sea from transitional countries. Biogeochemistry, vol. 85, no. 2, p. 153-168.
FILOSO, S., MARTINELLI, LA., HOWARTH, RW., BOYER, E. and DENTENER, F., 2006. Human activities changing the nitrogen cycle in Brazil. Biogeochemistry, vol. 79, no. 1-2, p. 61-89.
FILOSO, S., MARTINELLI, LA., WILLIAMS, MR., LARA, LB., KRUSCHE, A., BALLESTER, MV., VICTORIA, RL. and CAMARGO, PB., 2003. Land use and nitrogen export in the Piracicaba River basin, southeast Brazil. Biogeochemistry,
vol. 65, no. 3, p. 275-294.
GALLOWAY, JN., DENTENER, FJ., CAPONE, DG., BOYER, EW., HOWARTH, RW., SEITZINGER, SP., ASNER, GP., CLEVELAND, CC., GREEN, PA., HOLLAND, EA., KARL, DM., MICHAELS, AF., PORTER, JH., TOWNSEND, AR. and VÖRÖSMARTY, CJ., 2004. Nitrogen cycles: past, present and future. Biogeochemistry, vol. 70, no. 2, p. 153-226.
GALLOWAY, JN., TOWNSEND, AR., ERISMAN, JW., BEKUNDA, M., CAI, ZC., FRENEY, JR., MARTINELLI, LA., SEITZINGER, SP. and SUTTON, MA., 2008. Transformation of the nitrogen cycle: recent trends, questions, and potential solutions. Science, vol. 320, no. 5878, p. 889-892.
GREEN, PA., VÖRÖSMARTY, CJ., MEYBECK, M., GALLOWAY, JN., PETERSON, BJ. and BOYER, EW., 2004. Pre-industrial and contemporary fluxes of nitrogen through rivers: A global assessment based on typology. Biogeochemistry, vol. 68, no. 1,
p. 71-105.
HOWARTH, RW., BILLEN, G., SWANEY, D., TOWNSEND, A., JARWORSKI, N., LAJTHA, K., DOWNING, JA., ELMGREN, R., CARACO, N., JORDAN, T., BERENDSE, F., FRENEY, J., KUDEYAROV, V., MURDOCH, P. and ZHU, ZL., 1996. Regional nitrogen budgets and riverine N and P fluxes for the drainages to the North Atlantic Ocean: natural and human influences.
Biogeochemistry, vol. 35, no. 1, p. 75-139.
LARA, LBSL., ARTAXO, P., MARTINELLI, LA., VICTORIA, RL., CAMARGO, PB., KRUSCHE, A., AYERS, GP., FERRAZ, ESB. and BALLESTER, MV., 2001. Chemical composition of rain water and anthropogenic influences in the Piracicaba River basin, southeast Brazil. Atmospheric Environment, vol. 35, no. 29,
p. 4937-4945.
LEWIS Jr, WM., MELACK, JM., McDOWELL, WH., McCLAIN, M. and RICHEY, JE., 1999. Nitrogen yields from undisturbed watersheds in the Americas. Biogeochemistry, vol. 46, no. 1-3, p. 149-162.
LI, Y. and ZHANG, J., 1999. Agricultural diffuse pollution from fertilizers and pesticides in China. Water Science and Technology, vol.39, no. 3, p. 25-32.
MARTINELLI, LA., SILVA, AM., CAMARGO, PB., MORETTI, LR., TOMAZELLI, AC., SILVA, DML., FISCHER, EG., SONODA, KC. and SALOMÃO, MSMB., 2002. Levantamento das cargas orgânicas lançadas nos rios do Estado de São Paulo. Biota Neotrópica, vol.2, p. 1-18.
MATSUMURA-TUNDISI, T. and TUNDISI, JG., 2005. Plankton richness in a eutrophic reservoir (Barra Bonita Reservoir, SP, Brazil).
Hydrobiologia, Aquatic Biodiversity II, vol. 542, p. 367-378.
NEILL, C., DEEGAN, LA., THOM,AS, SM. and CERRI, CC., 2001. Deforestation for pasture alters nitrogen and phosphorus in small Amazonian Streams. Ecological Applications, vol. 11,
no. 6, p. 1817-1828.
RABALAIS, NN., 2002. Nitrogen in aquatic ecosystems. Ambio, vol. 31, no. 2, p. 102-112.
REICH, PB., ELLSWORTH, DS., WALTERS, MB., VOSE, JM., GRESHAM, C., VOLIN, JC. and BOWMAN, WD., 1999. Generality of leaf trait relationships: a test across six biomes.
Ecology, vol. 80, no. 6, p. 1955-1969.
REVENGA, C., MURRAY, S., ABRAMOVITZ, J. and HAMMOND, A., 1998. Watersheds of the world: Ecological Value and Vulnerability.
marine ecosystems. Global Biogeochemical Cycles, vol. 12, no. 1, p. 93-113.
United Nations Educational, Scientific, and Cultural Organization - UNESCO., 2003. Water for People Water for Life: the United
Nations Water Development Report. Paris: Unesco Publishing. 573 p.
United Nations Environment Program - UNEP, 2003. Available from: <http://www.unep.org>. Access in: Março de 2009.
VITOUSEK, PM., ABER, JD., HOWARTH, RW., LIKENS, GE., MATSON, PA., SCHINDLER, DW., SCHLESINGER, WH. and TILMAN, DG., 1997. Human alteration of the global nitrogen cycle: Sources and consequences. Ecological Applications, vol. 7, no. 3, p. 737-750.
RICHEY, JE., MEADE, RH., SALATI, E., DEVOL, AH., NORDIN, CF. and DOS SANTOS, U., 1986. Water discharge and suspended sediment concentrations in the Amazon River 1982-1984. Water Resources Research, vol. 22, no. 5, p. 756-764.
São Paulo (Estado). Departamento de Águas e Energia Elétrica – DAEE, 2008. Available from: <http//:www.daee.sp.gov.br>. Access in: Abril de 2009.
São Paulo (Estado). Secretaria de Economia e Planejamento. Fundação Sistema Estadual de Análise de Dados – SEADE., 2006. Available from: <http://www.seade.gov.br>. Access in: de Junho de 2009.