FUNDAÇÃO GETULIO VARGAS ESCOLA DE ECONOMIA DE SÃO PAULO
FLÁVIO LUIZ RUSSO RIVA
COMPUTERIZATION, OCCUPATIONAL TASKS AND THE LABOR
MARKET: EVIDENCE FROM A NATURAL EXPERIMENT IN
BRAZIL
FLÁVIO LUIZ RUSSO RIVA
COMPUTERIZATION, OCCUPATIONAL TASKS AND THE LABOR
MARKET: EVIDENCE FROM A NATURAL EXPERIMENT IN
BRAZIL
Dissertação apresentada à Escola de Economia de São Paulo da Fundação Getulio Vargas como requisito para obtenção do título de Mestre em Economia de Empresas
Campo de Conhecimento: Economia do Trabalho
Orientador: Prof. Dr. Sergio Pinheiro Firpo Co-orientador: Profa. Dra. Cristine Campos de Xavier Pinto
Riva, Flávio Luiz Russo.
Computerization, Occupational Tasks and the Labor Market: Evidence from a Natural Experiment in Brazil / Flávio Luiz Russo Riva. - 2016.
50 f.
Orientador: Cristine Xavier Pinto
Dissertação (mestrado) - Escola de Economia de São Paulo.
1. Mercado de trabalho. 2. Computadores. 3. Rotina de trabalho -
Automação. 4. Salários. I. Pinto, Cristine Xavier. II. Dissertação (mestrado) - Escola de Economia de São Paulo. III. Título.
COMPUTERIZATION, OCCUPATIONAL TASKS AND THE LABOR
MARKET: EVIDENCE FROM A NATURAL EXPERIMENT IN
BRAZIL
Dissertação apresentada à Escola de Economia de São Paulo da Fundação Getulio Vargas como requisito para obtenção do título de Mestre em Economia de Empresas.
Campo de Conhecimento: Economia do Trabalho
Data de Aprovação: / /
Banca examinadora:
Prof. Dr. Sergio Pinheiro Firpo (Orientador) Insper
Profa. Dra. Cristine Campos de Xavier Pinto FGV-EESP
Prof. Dr. Rodrigo Reis Soares FGV-EESP
At a practical level, Polanyi’s paradox means
that many familiar tasks, ranging from the quo- tidian to the sublime, cannot currently be com-
puterized because we don’t know ’the rules’. At an economic level, Polanyi’s paradox means so- mething more. The fact that a task cannot be computerized does not imply that computeriza- tion has no effect on that task. On the contrary: tasks that cannot be substituted by computeri- zation are generally complemented by it. This point is as fundamental as it is overlooked.
AGRADECIMENTOS
ACKNOWLEDGMENTS
RESUMO
A hipótese de “rotinização"ou de “mudança tecnológica enviesada em direção à rotina"estabelece que computadores substituem por tarefas rotineiras — aquela que seguem procedimentos que podem ser codificados em um programa de computador — e complementam tarefas abstratas não rotineiras. Essa dissertação de mestrado test algumas predições naturais sobre o impacto
“rotinização"sobre o mercado de trabalho de uma grande economia em desenvolvimento. Uso o
final da política de reserva de mercado para mini e micro-computador (Outubro de 1992) como um experimento natural que gera variação exógena nos preços de tecnologia para identificar os efeitos de computarização em salários e insumos de trabalho. Usando dados logintudinais que pareiam empregados e empregadores, mostro que os insumos de trabalho se deslocaram proemenimente em direção a atividades manuais não rotineiras e se afastaram de atividades rotineiras após o choque. Ademais, dois (três) anos depois do choque, o efeito parcial da medida ocupacional sobre salários reais é aproximadamente 5%(6%) maior, seguindo o começo do crescimento do mercado de computadores. Conjuntamente, esses resultados contribuem para a
crescente literatura sobre “perspectiva das tarefas"por trazer implicações testáveis de um queda
exógena de preços de computador em um contexto com uma estratégia de identificação crível.
Palavras-chaves: Computarização, Tarefas Ocupacionais, Mercado de Trabalho, Experimento
ABSTRACT
The “routinization"or “routine-biased technological change"hypothesis states that computers
substitute for routine tasks — those that follow procedures that can be codified into computer software — and complement nonroutine abstract tasks. This paper tests some natural predictions
of “routinization"on labor market outcomes of a large developing economy. We use the end
of the Brazilian market reserve policy on mini- and microcomputers (October 1992) as a natural experiment generating exogenous variation in technology prices to identify the effects of computerization on wages and labor inputs. Using matched employer-employee longitudinal data, we show that labor input shifted more prominently toward nonroutine manual and away from routine tasks after the price shock. Also, two (three) years after the shock the partial effect of our occupational measure on real wages was approximately 5%(6%) higher, following the begin of the growth in the IT hardware market size. Jointly, these results contribute to a growing literature based on “task approaches"by bringing testable implications of a plausibly exogenous computer price decline to a setting with a more credible source of identification.
List of Figures
Figura 1 – IT Hardware Market and IT Imports for Brazil (1991-1997) ... 22
Figura 2 – Table of Activities: “Receptionist"(CBO 2002) ... 27
Figura 3 – Measures of Substitutability and Complementarity (Examples) ... 32
Figura 4 – Labor Input Shifts with Year Dummies Centered at 1991... 38
Figura 5 – Distribution of Task Proportions ... 43
Figura 6 – Distribution of Real Wage Changes ... 44
Figura 7 – Distribution of Percentual Change in Employment Share ... 44
Figura 8 – Job and Wage Polarization in the U.S. (1980-2005) ... 50
List of Tables
Tabela 1 – Typology of Tasks and ExamplesAutor, Levy e Murnane(2003),Spitz-Oener
(2006) ... 25
Tabela 2 – Classification of tasks (Spitz-Oener(2006)) and CBO correspondence. . . 26
Tabela 3 – Examples of Tasks Classification (Receptionist) ... 28
Tabela 4 – Labor Input Shifts Post 1992 ... 36
Tabela 5 – Differential Partial Effects of Occupational Measures on Wages (Basis: pre-
shock) ... 39
Tabela 6 – Robustness of Differential Partial Effects of Occupational Measures on Wages
(Placebo Results) ... 41
Tabela 7 – Robustness of Differential Partial Effects of Occupational Measures on Wages
(Alternative Measures) ... 42
Tabela 8 – Differential Partial Effects of Occupational Measures on Wages (Heteroge-
TABLE OF CONTENTS
1 INTRODUCTION ... 14
2 RELATED LITERATURE ... 17
3 HISTORICAL BACKGROUND AND DATA ... 21
3.1 IT policy in Brazil ... 21
3.2 Primary Data ... 22
3.3 Occupational Measures of Task Intensity ... 23
4 EMPIRICAL FRAMEWORK ... 29
4.1 Computers and the Labor Market: Theoretical Benchmark ... 29
4.2 Measuring Substitution and Complementarity ... 31
4.3 Labor Input Shifts ... 33
4.4 Wage Equations ... 33
5 RESULTS ... 36
6 CONCLUDING REMARKS ... 45
References ... 46
APPENDIX A – TASK MEASURES IN AUTOR ET AL. (2003). . . 49
14
1 Introduction
The impacts of technology on employment and earnings have been a topic of impassioned debate for at least two centuries. From Sismondi’s prediction in 1819 of a world “where the King sits alone on his island, endlessly turning cranks to produce, with automatons, all that England
now manufactures"to the more recent rumors about the “end of work"(RIFKIN; KRUGER,
1996), the specter of machines replacing humans and lowering wages through negative demand shifts seems to have great appeal among the public opinion. Researchers suggest from time to time that these concerns may not be totally unjustified: in a colloquium at the Federal Reserve Bank of New York in 1997, technological change was viewed as the leading single contribution
1
factor to rising U.S. wage inequality in a poll of experts (AUTOR; KATZ; KRUEGER,1998) . In the last years, several researchers argued that the effects of technological change should be studied with focus in specific innovations and their potential to affect the demand for activities. Accordingly, agreement on the empirical and theoretical fruitfulness of the distinction between
“skills"and “tasks-– units of work activity that directly participate in production — to study the
effects of technology adoption on the labor market emerged. It has been argued convincingly that models that overemphasize the role of skills in the determination of work earnings and
composition (such as models of “skill-biased technological change") end up missing important
features of recent labor market trends. Therefore, “task approaches"(AUTOR,2013) have been
extensively used in the last years to describe in a more nuanced way how the most recent technological revolution of our time — the adoption of computers and, more broadly, computer- based information technologies — altered the structure of labor demand and, thereby, the work earnings distribution, labor inputs and employment structure. In this setting, occupations assume a prominent role, since the task content of work is typically determined at the occupational level. Causal identification of the effects of computerization is nevertheless a challenging ende- avor, primarily because labor market outcomes are endogenous and determined simultaneously with the adoption of specific technologies.Acemoglu(2002) suggests that the rapid increase in the supply of skilled workers induced the development of technologies complementary to skills (such as computers) in the twentieth century. Also, since occupational choice is influenced by secular trends in wages, a problem of the same type might arise if some occupations become more attractive than others following the gradual adoption of computers. Disentangling demand and supply effects is virtually impossible for contexts where these descriptions are suitable, and, even though descriptions of an exogenous price decline are commonly the driving force behind
1
Also, in a poll of leading academic economists conducted by the Chicago Initiative on Global Markets in 2014,
43% of the participants agreed with the statement “information technology and automation are a central reason why median wages have been stagnant in the U.S. over the past decade, despite rising productivity" (AUTOR,
Capítulo 1. Introduction 15
models in the empirical literature, sources of exogenous variation in prices have not yet been explored to address a causal reasoning.
In this paper, we explore a particularity of the Brazilian industrial policy on the computer sector to investigate the effects of a specific technological change on the labor market of a large developing economy. We use the end of the Brazilian market reserve policy on mini- and microcomputers (October 1992) as a natural experiment generating exogenous variation in prices to identify the effects of computerization on work earnings and labor inputs. We concentrate on a ten year time window between 1988 and 1997, using a sample of compulsory administrative
records of the Labor’s Annual Social Information Reports and measures of occupational task
intensity based on the Ministry of Labor’s Brazilian Occupational Classification (“Classificação Brasileira de Ocupações"). Our empirical strategy explores time series and regional variation to compare task inputs and wages before and after the year of the shock.
Consistent with the prediction that computers substitute for routine tasks — those that follow understood procedures that can be codified into computer software —, labor input shifted away from the former more prominently after than before the shock. Also, nonroutine manual inputs followed an inverse pattern. Appending occupational measures of substitution and complementarity with respect to computer capital, we also that the importance of this covariate in Mincerian wage equations increases significantly after 1992. Importantly, placebo results indicate that this was not a trend during in the four years prior to the policy change. According to our preferred specification, two (three) years after the shock the partial effect of that measure on real wages was approximately 5%(6%) higher than in 1992, following the beginning of the growth in the IT hardware market size between 1993 and 1994. We shed light on the nature of the phenomenon analysing the heterogeneity of effects across sub-samples and show that results are qualitatively robust to the use of different sets of controls and measures of occupational task content. Also, after replicating descriptive exercises of the literature, we suggest that the driving
forces behind “job and wage polarization"in the U.S., i.e., simultaneous growth of the share of
employment and real wages in high wage occupations and low wage occupations, harmonize with the empirical patterns of wage growth during the period in the Brazilian formal labor market. We view our contribution as twofold. First, we believe that it is possible to benefit from the particularity in the Brazilian industrial policy history to argue that the conditions under which the estimated effects have a causal interpretation are more likely to be present. In other words, our empirical strategy improves upon the literature by providing a more credible source of identification. Also, to our knowledge, there is almost no evidence on the effects of computers on labor markets of developing economies. More precisely, even though there evidence on the shift in the demand for tasks during the 1990s and 2000s in Brazil due to technological incorporation (FUNCHAL; SOARES,2012) is available, its short-term impact on wages and task inputs has not yet been accessed empirically.
Capítulo 1. Introduction 16
17
2 Related Literature
The most important hypothesis relating technological change, the structure of labor demand and the distribution of work earnings is the so-called “skill-biased technological change", which presents a shift in the production technology as something that favors skilled over unskilled labor by increasing its relative productivity and, therefore, its relative demand (VIOLANTE,
2008). The strong correlation between the adoption of computer-based technologies and the increased use of college-educated labor in advanced economies during the 1980s was interpreted as evidence of this phenomenon (BERMAN; BOUND; GRILICHES,1994;BERMAN; BOUND; MACHIN,1998;MACHIN; REENEN,1998). Nevertheless, “job polarization-– by which we mean relative growth of the share of employment in high skill, high wage occupations and low skill, low wage occupations —and concomitant “wage polarization-– the relative growth of high and low wages relative to the middle of the baseline wage distribution — observed between the 1980s and the 2000s for most developed countries casted doubt upon the accuracy
1
of that explanation (ACEMOGLU; AUTOR,2011) . The reason for that is straightforward: given the enormous growth in the use of computers during this period and the fact that wages are monotonically increasing in observable measures of skill, one would expect a monotone pattern in the relation between the latter and wage or employment share growth if shifts in labor demand induced by computer use were indeed “skill-biased".
Some critics point out that a reasonable assessment of the impact of these technological changes on the labor market was lacking a better understanding, primarily because it failed to explain how computers shifted the demand toward tasks in which skilled labor holds comparative
2
advantage .Autor, Levy e Murnane(2002),Autor, Levy e Murnane(2003) andAutor e Price
(2013) argue that computer-based technologies can substitute human labor in routine tasks (i.e., those that can be expressed in systematic rules) and complement human labor in nonroutine abstract tasks – what has been called “routinization hypothesis"or “routine-biased technological change". In the next sections, we discuss several examples of these types of tasks and occupations that are intensive in each one of them. For now, it su ffices to say that routine are core job tasks of occupations such as bookkeeping, clerical work, repetitive production and monitoring and nonroutine abstract are typical of managerial, professional and high-skill technical occupations. We highlight at this point that, since nonroutine manual tasks are not codifiable and require
1 2
See Figure8for graphical depictions of these patterns in the U.S. during the 1980-2005 period.
Bresnahan, Brynjolfsson, and Hitt (2002) (apud Spitz-Oener(2006)) sum up these shortcomings with a strong
Capítulo 2. Related Literature 18
intensive situational adaptability,Autor, Levy e Murnane(2003) make no prediction of e ffects in
3
occupations that are intensive in these tasks
Building on a microeconomic model of firm behavior facing a steep decline in computer capital price and using measures of occupational task intensity,Autor, Levy e Murnane(2003) predict and confirm empirically that routine-intensive industries did adopt proportionately more computer capital and more nonroutine task input in the U.S., as the mentioned effects of substitu- tability and complementarity would suggest. This actually provides a better explanation for the
mentioned “black-box"correlation between the adoption of computer-based technologies and
the increased demand for college-educated workers, since these are likely to hold comparative advantage in the accomplishment of nonroutine abstract tasks. Another key contribution of
Autor, Levy e Murnane(2003) andAutor e Price(2013) is to document changes in labor input in five task categories — routine cognitive, routine manual, nonroutine analytic, nonroutine interactive, and nonroutine manual — over nearly a five decade span, relating the patterns found to technology adoption.
Following these important contributions, a vast literature tried to use this framework to understand the trends of polarization described above.Goos e Manning(2007) argue that
the “routinization hypothesis"is consistent with “job polarization"in the U.S.. They show that,
between 1975 and 1999, there was a rise in relative share of employment for occupations that are intensive in terms of nonroutine tasks, which were concentrated in the upper (nonroutine abstract) and the lower (nonroutine manual) parts of the empirical distribution of wages. This allows them to relate occupational tasks to the stylized fact of the U-shaped (or, again, “polarized") curve
4
representing growth of jobs by percentile, most pronounced during the period of 1988 to 1999 .
Autor, Katz e Kearney(2006) identify divergent trends in upper- and lower-tail wage inequality during the 1990s and beginning of the 2000s, with faster wage growth on the top and bottom quartile than in the middle two quartiles, displaying a visual pattern similar to that obtained by
Goos e Manning(2007). They show how a model of computerization in which computers most strongly complement the non-routine abstract tasks of high-wage jobs, directly substitute for the routine tasks found in many traditional middle-wage jobs, and may have little direct impact on non-routine manual tasks in relatively low-wage jobs can account for these trends. All in all, this led researchers to believe that a framework where tasks play an important role could help to account challenging “polarization"patterns.
More recently,Firpo, Fortin e Lemieux(2011) applied decomposition procedures based on unconditional quantile regressions (FIRPO; FORTIN; LEMIEUX,2009;FORTIN; LEMI- EUX; FIRPO,2011) to look at the contribution of usual explanatory factors and occupational measures of task intensity to changes in the wage distribution during the last three decades in
3
“Tasks like preparing a meal, driving a truck through city traffic, or cleaning a hotel room present mind-
4
bogglingly complex challenges for software engineering."(AUTOR; PRICE,2013, p. 2).
Capítulo 2. Related Literature 19
the U.S.. Using a model of wage determination that explicitly incorporates task prices, they
5
find that technological change and offshorability played a central role in shaping the wage distribution during the period considered. Also,Autor e Dorn(2013) test the broader hypothesis that polarization is driven by the interaction of consumer preferences in favoring variety over specialization and “routinization". Applying a spatial equilibrium model of local labor markets, they add to the conclusions ofAutor, Levy e Murnane(2003) preciser descriptions of reallocation of low-skill labor into nonroutine manual task-intensive services and net inflows of high-skill
6
labor in markets that were historically specialized in routine task-intensive industries .
Research in developed economies (European Union and OCDE, mostly) followed the same pattern of the U.S. literature, alternating general criticism of the virtues of the “skill-biased technological change"hypothesis with careful description of the stylized facts of structure of employment and wages that seemed challenging to it. Dealing with the German case,Spitz- Oener(2006) showed that changes in task content have been most pronounced in rapidly computerizing occupations since the 1980s, highlighting once more the importance of taking the task composition of occupations into account when relating technological change and the demand
7
for skilled and unskilled labor . Following the conclusions inGoos e Manning(2007),Goos, Manning e Salomons(2014) did a similar exercise for a group of sixteen European countries, leading researchers to believe that “job polarization"driven by technological change is at least as pronounced in the European Union as in the U.S..
Despite the agreement on the contribution that “task approaches"have done to a better
understanding of the job market trends in advanced economies, there is still almost no applications
8
to developing and under-developed economies . To our knowledge, the only exception in Brazil isFunchal e Soares(2012). Using the framework ofSpitz-Oener(2006) to construct measures of task intensity, they reached conclusions similar toAutor, Levy e Murnane(2003) for Brazil after the end of the market reserve policy in the 1990s, verifying that computer use after steep price declines increased the demand for nonroutine tasks and reduced the demand for routine tasks. Without underestimating the importance of this result, we believe that there is a huge amount of empirical relations that remains unexplored. Moreover, the plausible exogeneity of the price shock in Brazil has not yet motivated approaches that explicitly explore this feature for identification purposes. In what follows, we present the historical background of the period
5
Since offshoring seems to be a rare practice in the Brazilian labor market, we ignore this dimension of the argument from now on. Nevertheless, the importance of this factor in the U.S. and other developed economies is
6
far from negligible (BLINDER,2009).
It is noteworthy that concerns with causality motivate an IV estimation strategy, based on the 1950 industry mix
7
predicting market specialization on routine tasks in the first stage.
One advantage of this paper is that the occupational task measures used are consistent over time and reported by workers, rather than by work experts as inAutor, Levy e Murnane(2003). We come back to this shortcoming in
8
usual data sets when we discuss measurement in the next section.
Capítulo 2. Related Literature 20
21
3 Historical Background and Data
3.1
IT policy in Brazil
Computer industry policy during the 1970s and 1980s in Brazil followed an infant industry strategy of protecting domestic producers in certain segments in order to give them a chance to develop and eventually become competitive. The Law of National Policy on Informatics
(“Política Nacional de Informática", Federal Law n. 7.232, October 1984) played an important
role in shaping this strategy through market reserve, limiting foreign companies to the market of higher-sized computers. It was characterized by the pursuit of technological autonomy and
1
the almost complete exclusion of foreign companies . The scope of the protection extended in the beginning to micro and minicomputers, but gradually expanded to a wide variety of data-processing devices and their inputsLuzio e Greenstein(1995). As a result, by the end of the 1980s Brazil had a set of diversified IT corporations with significant presence in the local market.
Following a decade of economic stagnation, industrial policy shifted to a more liberal regime in the early 1990s. During the election campaign of 1989, presidency candidate Fernando Collor promised to phase-out protection and dismantle the agencies that enforced protection laws by the end of 1992. Local industry became exposed to international competition, and industry direct protection was highly substituted by incentives for local production, research and exports. In particular, the market reserve policy ended (October 1992), being replaced by a tax policy and a system of new financial incentives. Figure9illustrates the reaction of a famous Brazilian magazine (Revista Veja) after the decision. The president is described as having “buried the waste [sucata]"(title), and ended a law that was responsible for “costly and obsolete products".
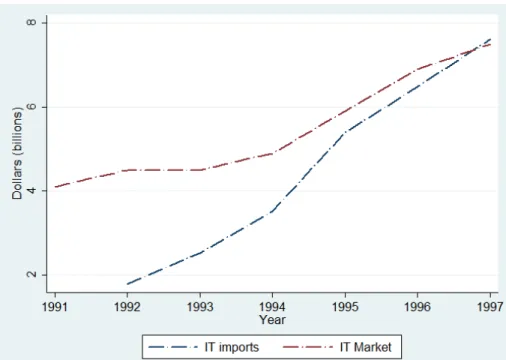
Overall, the Law of National Policy on Informatics failed to develop a domestic industry with competitive prices. Price ratios between U.S. computers and Brazilian counterparts oscillated between 0.55 and 0.85 between 1984 and 1988Luzio e Greenstein(1995). Also, indicators that also account for quality show that Brazil’s price/performance by 1990 was more than five years behind best practice. As an illustration of the speed with which the policy change might have induced the adoption of computers, the level of imports and hardware market size grew steadily after 1992 and specially after 1993 for the latter (Figure1). We come back to this point in our discussion of the results. Overall, imports rose nearly 400% between 1992 and 1997 and the hardware market size almost doubled in the same period. Also, the fact that the IT market as percentage of GDP grew from 1.6% to 2.8% minimizes the concern that these trends could
1
Capítulo 3. Historical Background and Data 22
reflect a general behavior of sectors during the period.
Figura 1 – IT Hardware Market and IT Imports for Brazil (1991-1997)
Notes: Data fromBotelho et al.(1999). Reported sources are the Brazilian Bureau
of International Trade (“Secretaria de Comércio Exterior") for import data and the
Brazilian Ministry of Science and Technology (“Ministério da Ciência e Tecnologia") for the hardware market size.
3.2
Primary Data
The results in this paper are based on labor market information from 10 years (1988-
1997) of the Brazilian Ministry of Employment and Labor’s Annual Social Information Report
(“Relação Anual de Informações Sociais", RAIS henceforth), a confidential longitudinal data set
of compulsory administrative records reported by every employer in theformal market. It omits
workers without signed work cards (“carteira assinada"), including interns, the self-employed,
elected officials, domestic workers and other smaller categories. This information must be sent each year to the Labor Ministry by all government controlled and private companies operating,
and an employer’s failure to report can result in fines proportional to the firm size. There are
also reasons to believe that workers have an incentive to ensure that their employers are indeed providing the correct information, since the Brazilian government uses it to enable the payment
of the “abono salarial", a program that gives one additional minimum wage to workers whose
average monthly wage was not greater than two times the minimum wage.
Capítulo 3. Historical Background and Data 23
workers. Nevertheless, the possibility of identifying a worker is appealing because it yields robustness to arbitrary individual time-invariant heterogeneity, and we will argue that this is im- portant for identification purposes in Section4. Finally, one additional advantage is the possibility to control for actual experience on the job, and not only for potential experience.
We worked with a 1% sample of the whole population of formal workers described in the last paragraph, i.e., our sampling assigns equal probability of selection for each individual worker that appears at least once between 1988 and 1997 in all administrative records. Our inclusion criteria after sampling were that the individuals had positive monthly income as of December of the year of interest and had between 25 and 64 years old. The main dependent variable used was log monthly, instead of hourly, earnings due to the enormous amount of missing observations
with respect to the variable “contract hours"in the sample. Relevant worker information also
includes, age range, gender, educational attainment (9 categories), firm tenure and occupation in the year of reference. Relevant firm information is primarily given by geographic location (microregion) and industry (IBGE sector).
3.3
Occupational Measures of Task Intensity
To gauge the effects of technological change or incorporation on task inputs and wages one needs to rely on some measure of the task content of jobs. Unfortunately, one of the
substantial challenges that confront research based on “task approaches"is measurement.Autor
(2013) discusses ways to deal with this problem and the trade-offs involved in choosing the level of aggregation.
For instance, one solutionAcemoglu e Autor(2011) is to collapse many detailed occupa- tions into a few broad categories, e.g., professional, technological, clerical etc. This method is transparent and intuitive, but it may force the researcher to identify task commonalities based on subjective judgements. Appending a set of measures of task intensity to each occupation seems to reduce the role of subjectivity in the task categorization. This approach has two major limitations and there is no available solution to deal with them, given that data is often sparse. First, assigning task measures to occupations overlooks all heterogeneity in tasks among workers within an occupation. A simple way of dealing with this limitation would be to collect job task information directly from survey respondents alongside other socio-economic and demographic dataSpitz-Oener(2006), but there is no available data set yet in Brazil. Second, these measures offer a fundamentally static view of the occupational task content, and it is clear that this content
2
is subject to continuous influence of technological change . Even though the latter shortcoming is likely to reduce the precision of our analysis, we believe that for the short time span we are dealing with this should not compromise the main results.
2
Capítulo 3. Historical Background and Data 24
Our main occupational task content data comes fromFunchal e Soares(2012), and was
created using the Ministry of Employment and Labor’s Brazilian Occupational Classification
(“Classificação Brasileira de Ocupações", CBO henceforth) from 1994. This database provides a
description based on information provided by workers and labor specialists about the activities performed in each occupation. The authors use the most disaggregated occupational level available in the RAIS data base (occupational families). Since their papers uses a larger time range (1985-2002) they harmonized the 1994 codes with the ones of the Brazilian Occupational Classification from 2002 ending up with 321 groups that we denote throughout the analysis as
“occupations"for simplicity. The latter database follows the standards found in the International
Standard Classification of Occupations (ISCO) from the United Nations and is easier to relate to occupational classifications used in the literature. To compare the CBO 1994 and the CBO 2002 they relied on a conversion table published by the Brazilian Ministry of Employment and Labor.
Since the CBO 2002 is a considerable improvement over CBO 1994, we use this additional
3
information in some of our robustness exercises with respect to alternative task content measures . For both editions, activities appearing in each occupational description were classified according to the classification of tasks initially proposed byAutor, Levy e Murnane(2003) and further developed bySpitz-Oener(2006). We display the five original categories and some examples in Table1. At this point, we highlight that the impact of computers is assumed to be di fferent for different types of tasks, a fact that we bring closer to testable implications in the next section.
3
Tabela 1 – Typology of Tasks and ExamplesAutor, Levy e Murnane(2003),Spitz-Oener(2006)
Routine tasks Nonroutine tasks
Analytic and interactive tasks
ExamplesAutor, Levy e Murnane(2003) Record-keeping, calculation, repetitive costumer service
(e.g., bank teller)
Forming /testing hypothesis, medical diagnosis, legal writing, persuading/selling, managing others
ExamplesSpitz-Oener(2006) Calculating, bookkeeping, correcting texts/data, measuring
length/weight/temperature
Researching, analysing, evaluating and planning, making plans/constructions, designing, sketching, working out rules/prescriptions,
using and interpreting rules, negotiating, lobbying, coordinating, teaching, selling, buying, advertising, advising, entertaining, employing or managing personnel
Computer impactAutor, Levy e Murnane(2003) Substantial substitution Strong complementarities
Manual tasks
ExamplesAutor, Levy e Murnane(2003) Picking or sorting, repetitive assembly Janitorial services, truck driving
ExamplesSpitz-Oener(2006) Operating or controlling machines and equipping machines
Repairing or renovating houses /apartments/ machines/vehicles, restoring art/
monuments and serving/accommodating
Computer impactAutor, Levy e Murnane(2003) Substantial substitution Limited opportunities for
substitution or complementarity
Notes: The table displays the typology of tasks inAutor, Levy e Murnane(2003) andSpitz-Oener(2006) along with examples and computer impacts.
Capítulo 3. Historical Background and Data 26
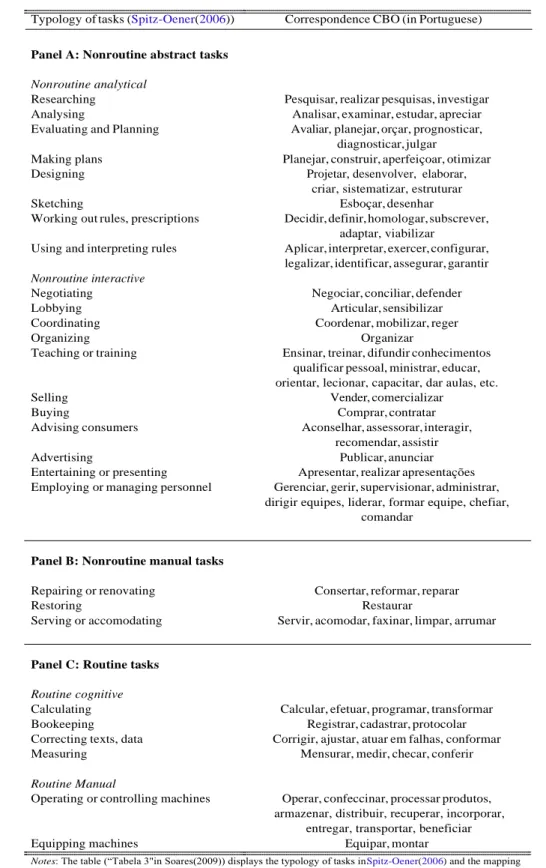
Tabela 2 – Classification of tasks (Spitz-Oener(2006)) and CBO correspondence
Typology of tasks (Spitz-Oener(2006)) Correspondence CBO (in Portuguese)
Panel A: Nonroutine abstract tasks
Nonroutine analytical
Researching Pesquisar, realizar pesquisas, investigar
Analysing Analisar, examinar, estudar, apreciar
Evaluating and Planning Avaliar, planejar, orçar, prognosticar,
diagnosticar, julgar
Making plans Planejar, construir, aperfeiçoar, otimizar
Designing Projetar, desenvolver, elaborar,
criar, sistematizar, estruturar
Sketching Esboçar, desenhar
Working out rules, prescriptions Decidir, definir, homologar, subscrever, adaptar, viabilizar
Using and interpreting rules Aplicar, interpretar, exercer, configurar, legalizar, identificar, assegurar, garantir
Nonroutine interactive
Negotiating Negociar, conciliar, defender
Lobbying Articular, sensibilizar
Coordinating Coordenar, mobilizar, reger
Organizing Organizar
Teaching or training Ensinar, treinar, difundir conhecimentos
qualificar pessoal, ministrar, educar, orientar, lecionar, capacitar, dar aulas, etc.
Selling Vender, comercializar
Buying Comprar, contratar
Advising consumers Aconselhar, assessorar, interagir,
recomendar, assistir
Advertising Publicar, anunciar
Entertaining or presenting Apresentar, realizar apresentações
Employing or managing personnel Gerenciar, gerir, supervisionar, administrar, dirigir equipes, liderar, formar equipe, chefiar,
comandar
Panel B: Nonroutine manual tasks
Repairing or renovating Consertar, reformar, reparar
Restoring Restaurar
Serving or accomodating Servir, acomodar, faxinar, limpar, arrumar
Panel C: Routine tasks
Routine cognitive
Calculating Calcular, efetuar, programar, transformar
Bookeeping Registrar, cadastrar, protocolar
Correcting texts, data Corrigir, ajustar, atuar em falhas, conformar
Measuring Mensurar, medir, checar, conferir
Routine Manual
Operating or controlling machines Operar, confeccinar, processar produtos, armazenar, distribuir, recuperar, incorporar,
entregar, transportar, beneficiar
Equipping machines Equipar, montar
Notes: The table (“Tabela 3"in Soares(2009)) displays the typology of tasks inSpitz-Oener(2006) and the mapping
Capítulo 3. Historical Background and Data 27
Capítulo 3. Historical Background and Data 28
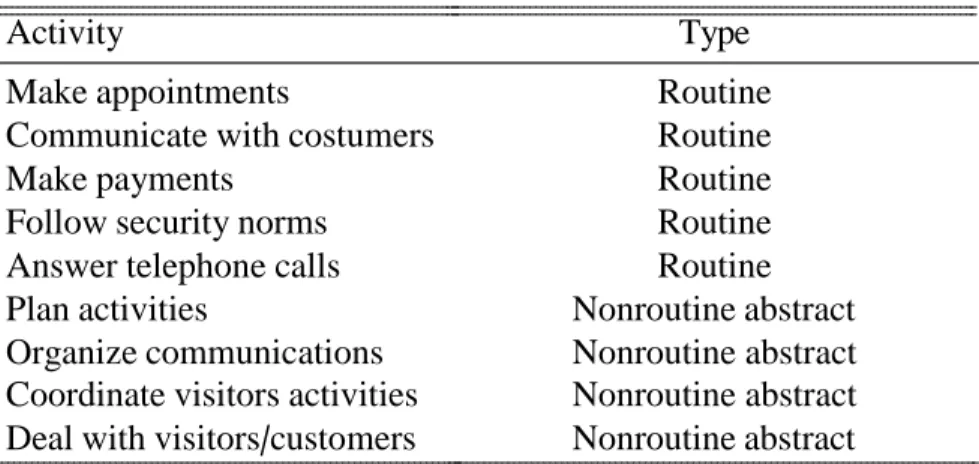
Tabela 3 – Examples of Tasks Classification (Receptionist)
Activity Type
Make appointments Routine
Communicate with costumers Routine
Make payments Routine
Follow security norms Routine
Answer telephone calls Routine
Plan activities Nonroutine abstract
Organize communications Nonroutine abstract Coordinate visitors activities Nonroutine abstract Deal with visitors/customers Nonroutine abstract
Notes: The table displays the threefold classification applied to activities of a
“Receptionist"in the 2002 Brazilian Occupational Classification (“Classificação
Brasileira de Ocupações") and used to compute proportions of tasks. Originally,
this information comes from “Tabela 3"in Soares(2009).
The correspondence used to maintain standardization regardless of occupation appears inSoares(2009) and is reproduced in Table2.Soares(2009) andFunchal e Soares(2012) work with the five broad types of tasks that displayed in Table1: nonroutine analytic, nonroutine interactive, nonroutine manual, routine cognitive (analytic and interactive) and routine manual. Nevertheless, the literature seemed to converge in the last years to a threefold typology that aggregates routine cognitive/manual tasks and nonroutine analytical/interactive into two broader categoriesAutor e Dorn(2013),Autor, Dorn e Hanson(2013),Goos, Manning e Salomons
(2014), perhaps because testable implications seldom relate to the definitions used originally byAutor, Levy e Murnane(2003) andSpitz-Oener(2006). These broader categories are the ones used to construct the categories in Panels A, B and C in Table2, which are used in the next sections. An example of the original description of activities (or "areas", left side) used
for the occupation “Receptionist"(CBO, 2002) is reproduced in Figure2. Table3displays the
29
a
4 Empirical Framework
This section lays out the theoretical foundations linking an exogenous decline in the price of computers to wages and task inputs. We follow the existing literature to describe this link and bring the testable implications closer to the empirical strategies used.
4.1
Computers and the Labor Market: Theoretical Benchmark
Assume, asAutor, Katz e Kearney(2006), that workplace tasks can be subdivided into three groups: (i) nonroutine abstract; (ii) routine; (iii) nonroutine manual. Abstract tasks typically involve intuition, persuasion and creativity and are characteristic of managerial, professional and high-skill technical occupations. Routine tasks follow precise, well understood procedures that can be codified in computer software — and, more generally, symbolic processors that execute stored instructions. They are core job tasks of occupations such as bookkeeping, clerical work, repetitive production and monitoring. Finally, manual tasks require situational adaptability, visual and language recognition and interactions. They are typical tasks of cleaning and janitorial work, in-person health assistance, food preparation and serving jobs. Table2illustrates how these definitions map into our data through the task content of occupations originally found in the activity reports in Figure2. FollowingAutor, Levy e Murnane(2003), we depart from three intuitive hypothesis on the role that computer technology plays in the production of goods and services to analyze the comparative statics of a steep decline in computer prices.
Consider a labor market where there is only one firm producing a good or service Q (price normalized to one), using a technology with constant returns to scale. Inputs for production are routine labor Lr, abstract labor La and computer (or automation) capital C, all measured in
efficiency units and related according to the production function:
Q(Lr, La, C) = (Lr + C)1− L (4.1)
where ∈ (0, 1). The functional form assumed captures intrinsic characteristics of computers when used as inputs:
1. computers and routine tasks are perfect substitutes in the production, i.e, the partial derivative of routine labor with respect to computer capital is constant for a strictly positive level of output;
Capítulo 4. Empirical Framework 30 i r ∗ ∗ r L r L a a
3. greater intensity of routine inputs (labor and computers) increases the marginal productivity of nonroutine labor, since the cross derivative of the marginal product of nonroutine labor with respect to routine inputs is positive.
The price δ of one efficiency unit of computer capital is exogenous and we assume the existence of a set of income-maximizing workers W with typical element i, each of whom supplies labor li subject to a restriction of heterogeneous productivity endowments in routine and
nonroutine tasks Ei := [ri, ai], where ri, ai > 0 are efficiency units of routine and nonroutine
task. A given worker can thus choose to supply ai efficiency units of routine tasks input, ai
efficiency units of nonroutine abstract task input, or any convex combination combination of
1
the two . A labor market equilibrium is a family {w∗, w∗, (l∗)i∈W, L∗, L∗, C∗} where w∗is the
r a i r a j
price of one efficiency unit of taks type j ∈ {r, a} and: (i) workers maximize their income taking prices and their heterogeneous endowment restriction as given, choosing l∗ ∈ Ei; (ii) the firm
maximizes profits choosing levels of routine labor L∗, nonroutine labor L∗and computers C∗and
r a
(iii)labor market clears. In what follows, we state some necessary conditions for an equilibrium in this simple economy.
Defining the relative efficiency of worker i ∈ W at nonroutine versus routine tasks as
i := ai and assuming a continuous distribution for this random variable, the only behaviour
i
consistent with (i) is: : l∗ = ai if i > wr e l∗ = ri if i < wr . Hence, equilibrium supply of
i wa∗ i wa∗
routine and nonroutine labor are given respectively by:
.
w∗.
and:
.
riI i∈W
i < r ∗ a
(4.2)
.
w∗.
.
aiI i∈W
i > r ∗ a
(4.3) where I{.} denotes the indicator function. By (ii), demand for inputs must be a solution to the problem:
(L∗, L∗, C∗) ∈arg max{Q(.) −Law∗−Lrw∗−Cδ: (Lr, La, C) ∈R3 } (4.4)
r a a r +
which, in turn, implies:
∂Q(L∗, L∗, C∗) = (1 − ) .L∗ + C∗.− = w∗ (4.5)
∂Lr r a ∗ r
∂Q
(L∗, L∗, C∗) = .L∗+ C∗.1− = w∗ (4.6)
∂La r a ∗ a
1
“These assumptions imply that workers will choose tasks according to comparative advantage as inRoy(1951)". At this level of generality, and since we abstract from skills in our model, this could be interpreted as arbitrary invariant heterogeneity that could influence productivity in a (non)routine tasks.
w
Capítulo 4. Empirical Framework 31
r
L
w
a (4.8)
r a ∂Q
(L∗, L∗, C∗) = (1 − ) .
L∗+ C∗.− = δ (4.7)
∂C r a ∗
Moreover, by (iii), labor supply and demand must be equal. Define: ∗ :=
.
i∈WriI{ i <
.
∗
r
wa∗
} + C∗
wr∗
i∈WaiI{ i ≥ wa∗}
as the equilibrium ratio between routine and nonroutine abstractinputs. The equations above determine implicitly the values of equilibrium wr ∗ e wa ∗:
∗1− = w∗
(1 − ) ∗− = δ= w∗ (4.9)
An informal implicit function reasoning suffices to derive the following testable implications of an exogenous shock in the price of computers capital. As δ decreases:
1. equilibrium wages paid to routine tasks decrease and the wages paid to nonroutine abstract tasks increase by (4.9) and (4.8);
2. since the ratio of routine/nonroutine wages decreases, labor inputs shift toward nonroutine tasks, primarily by self-selection of workers due to heterogeneous productivity endow- ments;
We also investigate descriptively distributional patterns following usual exercises of the litera-
2
ture . Particularly, if the formal labor market in Brazil in the beginning of the 1990s resembled the structure of the labor market in advanced economies, we would expect baseline task propor- tions and wage/employment changes to reflect the following patterns: (i) nonroutine abstract (manual) task intensive occupations to be relatively concentrated in the upper (lower) part of the baseline distribution of wages, thus exhibiting after the price shock higher real wage changes and employment shares; (ii) routine task intensive occupations to be relatively concentrated in the middle part of the distribution of wages and revealing an inverse pattern when compared to nonroutine abstract task intensive occupations.
4.2
Measuring Substitution and Complementarity
As suggested in the last subsection, testable implications of “task approaches"involve measures of the task content of work, which are typically determined at the occupational level. Of crucial importance is the degree of routine/nonroutine character or substitutability/
2
An alternative model with predictions of polarization and explicit assignment of skills to tasks can be found in
Capítulo 4. Empirical Framework 32
complementarity of tasks with respect to computer-based technologies. Let pa, pm and pr denote
o o o
respectively nonroutine abstract, manual and routine proportions for occupation o, constructed according to the steps discussed in Subsection3.3. We append to workers in our sample the occupational summary measure mo, defined as:
mo := pa − pr (4.10)
o o
This measure is rising in the importance of nonroutine abstract tasks in each occupation, de- clining in the importance of routine tasks and does not depend in such explicit way on the proportion of manual tasks, which are assumed to be at least partially unaffected by the effects of computerization on the demand for specific types of tasks.
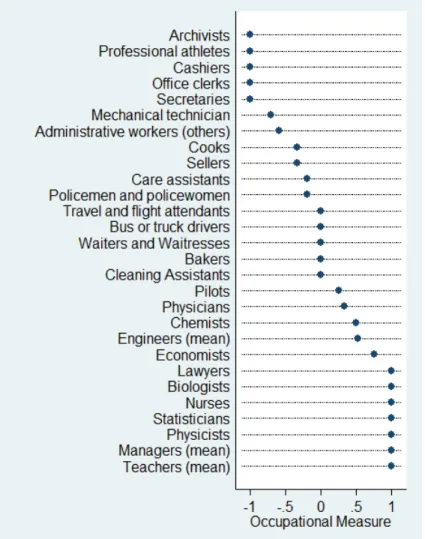
Figura 3 – Measures of Substitutability and Complementarity (Examples)
Notes: The occupational measure of substitutability/ complementarity with respect to computers is defined as the occupation-level proportion of nonroutine abstract tasks minus the proportion of routine tasks as constructed byFunchal e Soares(2012). We write (mean) to denote a simple average over commensurable occupations.
Figure3displays the value of mo for some of the most frequent occupations in the sample
Capítulo 4. Empirical Framework 33
iot
j
in the “task approaches"literature. Jointly, they comprise more than50% of our sample. Typical occupations in the upper part of our measure distribution are those that require problem-solving abilities. The task composition that generates high values of mo is characteristic of managerial,
technical and creative occupations, which are intuitively complementary with computer-based technologies. Also, values close to −1 are typically of occupations that are highly substitutes with the tasks performed by computers. Overall, these measures harmonize with what is expected by intuition — and we deal with the possible shortcomings by testing the robustness of our
3
results to the use of alternative measures .
4.3
Labor Input Shifts
In this subsection, we develop empirical strategies to evaluate if testable implication 2 apply to our empirical context between 1988 and 1997. Specifically, we use the occupational task proportions to ask whether after 1992 labor shifted away from routine and toward nonroutine task input. We fit to our sample the three models below using worker fixed effects estimators. The dependent variable in each regression is given by the occupational task proportions constructed byFunchal e Soares(2012) using Table2:
ps s s s s
iot = α + dpost + µi + siot (4.11)
where ps is the proportion of the task denoted in the superscript s (a: nonroutine abstract;
m: nonroutine manual; r: routine) for worker i in occupation o and time t, dpost is a dummy
that assumes value 1 after 1992, µs is an individual fixed-effect and ss is an error term. We
i iot
also consider the possibility that this dummy reflects aggregate trends already at motion before the shock and indirectly access the question of whether the shock intensified these trends by centering the time dummies on the year of the shock and estimating the following models:
s s
piot = α
+ . j dj + µi + siot (4.12)
s t s s
jƒ=1992
where we employ the same notation as above and dt is a time dummy (equals one if j = t and zero otherwise). Inference is based on standard errors clustered at the worker level.
4.4
Wage Equations
If wages paid to routine tasks fall and conversely for wages paid to nonroutine abstract tasks (implication 1) after the price shock, our measures of substitution and complementarity should have a different predictive power in wage equations after and before the shock. We
3
Capítulo 4. Empirical Framework 34
j
explore linear unobserved effects panel data models for the conditional mean of log-real wages appending the occupational task measures and fitting variations of the following model using a fixed-effects estimator:
wiot = α+ xit + πmo + δdpost + dpostmo + ξo + µi + siot (4.13)
where wiot is the logarithm of real wage for worker i in occupation o and time t, xit is a
vector of experience, education and additional controls discussed below, dpost is a dummy
that assumes value 1 after the price shock (t > 1992), ξo, µi are, respectively, occupation
and worker fixed effects and siot is an error term. Finally, mo denotes the measure of how
complementary/substitutable with respect to computers is the occupation o in which worker i
4
was employed in year t .
We also investigate whether these differential effects represent trends before the shock fitting the following placebo specification:
wiot = α+ xit + πmo +
.
jƒ=1992
jdt mo + δt + ξo + µi + siot (4.14)
where we adopt the same notation as above. Equations (4.13) and (4.14) are largely motivated by the fact that the occupational measure is rising (declining) in the importance of nonroutine abstract (routine) tasks and assumes values close to zero for occupations intensive in nonroutine manual occupations — in this sense, these can be seen as control occupations with respect to the effects of computers. If selection into occupation is based on unobserved but fixed characteristics
(like comparative advantage or our model’s “heterogeneous productivity endowment"), they
allow us to consistently estimate the difference in partial correlations with respect to basis periods. We expect > 0 in equation (4.13), j > 0 if j > 1992 and j ≥ 0 for j < 1992 in equation
(4.14) and evaluate the robustness of all estimates with respect to the use of alternative measures of task content from CBO 2002Funchal e Soares(2012) and the frequently used Dictionary of
5
Occupational TitlesAutor, Levy e Murnane(2003) .
Since the period analysed in the paper was one of major changes with respect to inter- national trade policy, one possibility is that wages were affected through channels other than
the ones predicted by the “routinization hypothesis". An identification problem would arise if
confounders of such type were correlated with our measures of occupational task content. The concerns discussed below guide our choice of most of the control variables included and all specifications have sector fixed effects and fully flexible trends to partially control for changes in fiscal subsidies and other industrial policies enacted during the period.
First, the Stolper-Samuelson theorem in Heckscher-Ohlin trade theory states that after a period of liberalization countries shift their production toward goods intensive in its relative abundant factor. In the case of Brazil, wages would thus reflect the effects of a shift in labor
4
5 Note that if individual i is an occupational switcher, there is within variation in mo.
Capítulo 4. Empirical Framework 35
demand toward unskilled work, specially because Brazil’s pre-liberalization tariffs (adjusted
by import penetration) were higher for skill-intensive goodsGonzaga, Filho e Terra(2006). To the extent that observable measures of skill tend to be positively correlated with our measures of occupational task content and this mechanism was in fact operating, including skill-group trends would not compromise the results if the coefficients of interest had the expected sign. Indeed, including these dummies should increase point estimates, since our differential partial effects would be capturing negative labor demand effects that act through the positive correlation between our measures and skills. We nevertheless evaluate these statements empirically by including skill-group (completed high-school and completed college) fully flexible trends to our main specification.
36
5 Results
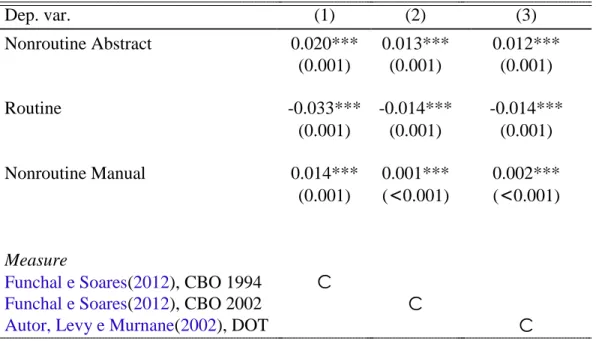
The first column of Table4presents the estimates for s in equation (4.11), s ∈ {a, r, m}
and the correspondent standard errors. Consistent with labor inputs shifting away from routine and toward nonroutine abstract tasks, the coefficients in the first and second rows are significantly negative and positive, respectively. Taking our preferred measures (column (1)) as basis, a typical worker after the price shock worked in an occupation 2 percentage points “more intensive"in terms of nonroutine abstract task (approximately 10% of the pre-shock period mean) and 3.3
“less intensive"in terms of routine task proportion (5% of the pre-shock period mean). Also, the
coefficient in the third line informs that labor was 1.4 percentage points more concentrated in nonroutine manual tasks. Results in columns (2) and (3) suggest that qualitative conclusions are similar but magnitudes vary with the choice of measures.
Tabela 4 – Labor Input Shifts Post 1992
Dep. var. (1) (2) (3)
Nonroutine Abstract 0.020*** 0.013*** 0.012***
(0.001) (0.001) (0.001)
Routine -0.033*** -0.014*** -0.014***
(0.001) (0.001) (0.001)
Nonroutine Manual 0.014*** 0.001*** 0.002***
(0.001) (<0.001) (<0.001)
Measure
Funchal e Soares(2012), CBO 1994
Funchal e Soares(2012), CBO 2002
Autor, Levy e Murnane(2002), DOT
C
C
C
Notes: Each cell displays the fixed-effects estimate of the dependent variable on a dummy that assumes value 1 after 1992, using the measures marked in the bottom of the table. Standard errors clustered at the worker level appear in parentheses below the coefficients. Symbols *, ** and *** indicate that the coefficient is statistically significant at the .1, .05, and .01 level.
Capítulo 5. Results 37
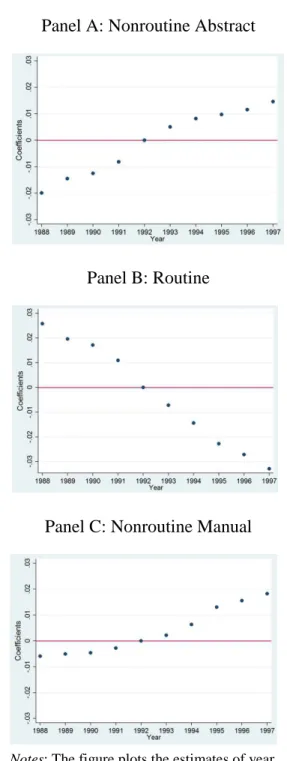
the pattern seems to begin in 1995. Overall, this suggests that even in the short-run the price shock induced a significant shift toward nonroutine manual and away from routine labor input. Our results are thus consistent with the long-term trends characterized inAutor, Levy e Murnane
(2003) and further explored inAutor e Price(2013), according to which labor input of routine went into sharp decline after 1980 following the massive adoption of computer technology. Also, they suggest that computerization was displacing labor from routine into manual task-intensive work.
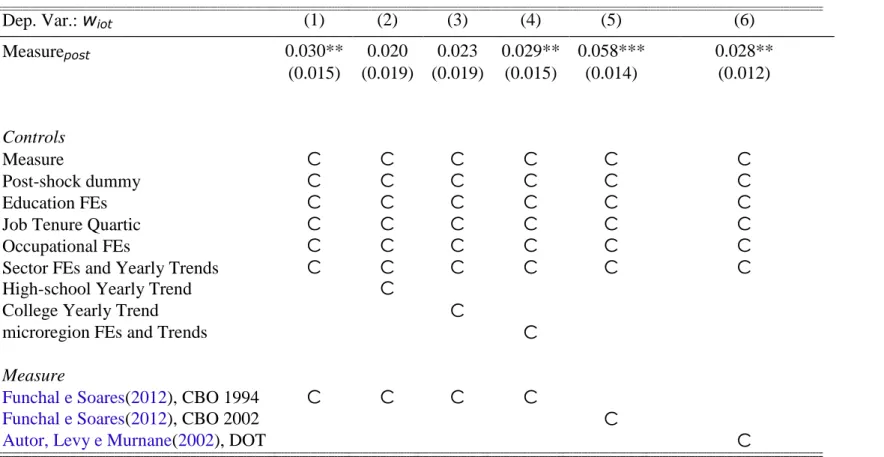
Table5presents the estimates of the parameter of interest ( ) for equation (4.13), with different sets of controls and measures of occupational task content. They capture differences in partial effects of the measures on log-real wages relative to the base period of the specification (before 1992). Coefficients in columns (1), (5) and (6) are based in a specification that includes only the measures of occupational task content, education dummies, a quartic in experience, sector fixed effects and yearly trends, post-shock and occupational dummies. The first conclusion that arises from the comparison of these columns is that the results are robust to the use of different measures. If anything, the coefficients and significance of the alternative measures of
Funchal e Soares(2012) andAutor, Levy e Murnane(2003) are larger than the one we preferably use.
Columns (2) and (3) introduce yearly trends for individuals that completed high-school and college, respectively, in order to investigate the role that variation on the skill premium might have in driving the results. The coefficients are positive albeit imprecisely estimated and, perhaps more surprisingly, lower in magnitude than the one presented in column (1). This change in magnitude does not harmonize with the fact that the interaction between mo and the post-shock
dummy was carrying negative demand effects of trade liberalization that acted through a positive correlation with observable measures of skill. Since evidence points to a decrease in the skill premium in manufacturingGonzaga, Filho e Terra(2006) and in generalFerreira, Leite e Wai-Poi
1
(2007), a way to conciliate both results might be measurement error in the education variable . It is reassuring that partialling out the variation that comes from shocks induced by trade in local labor markets (identified as a microregion) after 1992 has almost no effect on the point estimate, as can be seen in column (4).
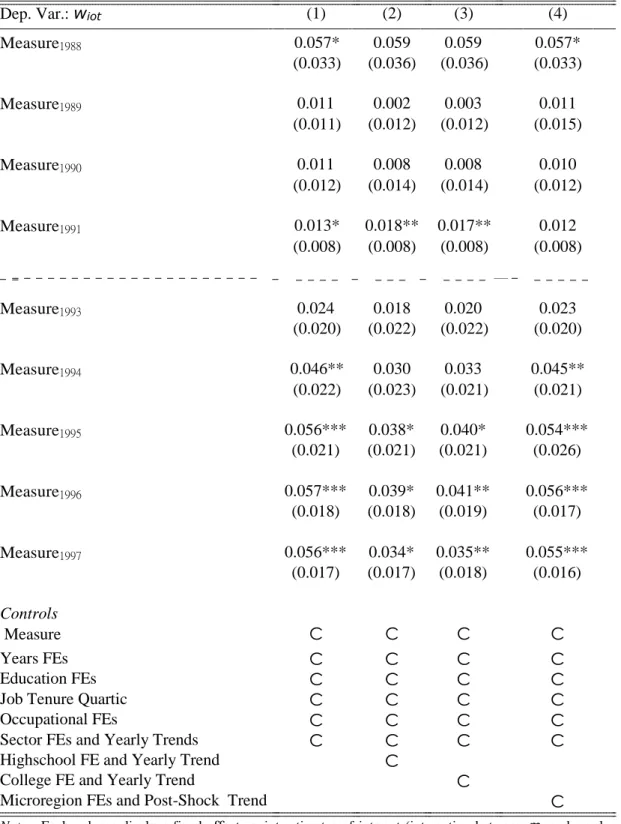
All the comments in the last paragraphs apply to the results in Tables6and7, which display the fixed effects estimates of interest in equation (4.14), incorporating different sets of controls and measures. These specifications provide an indirect way of testing whether the results discussed in the last paragraph could be driven by trends already existent before the price shock. Additionally, it provides a simple way to investigate the heterogeneity of effects with respect to exposure to the shock. Here, coefficients capture differences in partial effects of the task measures on log-real wages relative to the year of the price shock. Once more, measurement
1
Capítulo 5. Results 38
Figura 4 – Labor Input Shifts with Year Dummies Centered at 1991
Panel A: Nonroutine Abstract
Panel B: Routine
Panel C: Nonroutine Manual
Notes: The figure plots the estimates of year
Tabela 5 – Differential Partial Effects of Occupational Measures on Wages (Basis: pre-shock)
Dep. Var.: wiot (1) (2) (3) (4) (5) (6)
Measurepost 0.030** 0.020 0.023 0.029** 0.058*** 0.028**
(0.015) (0.019) (0.019) (0.015) (0.014) (0.012)
Controls
Measure C C C C C C
Post-shock dummy C C C C C C
Education FEs C C C C C C
Job Tenure Quartic C C C C C C
Occupational FEs C C C C C C
Sector FEs and Yearly Trends High-school Yearly Trend College Yearly Trend microregion FEs and Trends
C C
C
C
C
C
C
C C
Measure
Funchal e Soares(2012), CBO 1994
Funchal e Soares(2012), CBO 2002
Autor, Levy e Murnane(2002), DOT
C C C C
C
C
Notes: Each column displays fixed-effects point estimates of interest (interaction between mo and post-1991 dummy) in (4.13) fitted to an
Capítulo 5. Results 40
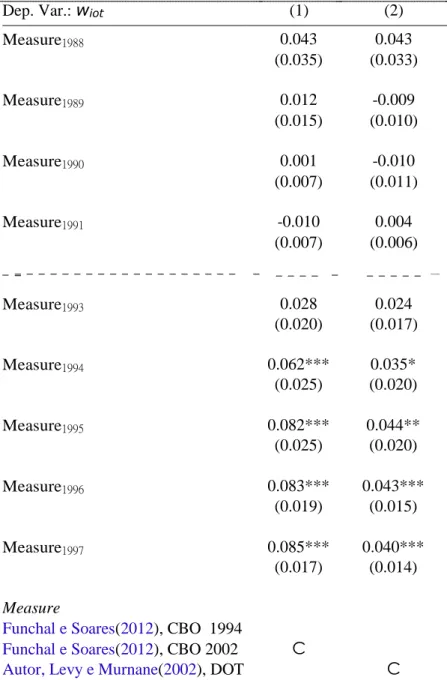
seems not to influence the qualitative conclusions (see Table7). More importantly, in almost all specifications the coefficients of years prior to 1992 (above the dashed line) are not significantly different from zero. Actually, the fact that some point estimates are positive and significant for 1991 indicates that the effect of the occupational measures was definitely not lower before the price shock. The qualitative interpretation of coefficients is largely invariant to the choice of controls and indicates that the importance of the measure was higher two years after the price shock, after the IT hardware market size began to grow. Also, one can reject at a low (0.01) level of significance the null hypothesis that the effect is monotonically increasing in 1993, 1994 and 1995 (except for columns (2) and (3)), but this pattern does not carry over to other years. Our results indicate that two (three) years after the shock the partial effect of our occupational measure and real wages was approximately 5%(6%) higher than in 1992.
The main heterogeneity analysis concentrates on the the distribution of routine tasks prior to the shock. Intuitively, microregions and firms that had more routine tasks to computerize arguably had higher latent demand for computer technology. Thus, a price decline probably had a larger effect on adoption in these subunits. We test this hypothesis by sub-sample regressions on microregions above and below the median of the pre-shock distribution of routine tasks. Point estimates are of the same magnitude, but the precision of inference is coming from the sub-sample of workers in microregions that were intensive in routine tasks before 1992 (despite the lower sample size)
Figures5-7address descriptively the question of the driving forces behind “job polari-
zation"and concomitant “wage polarization"for our sample. It replicates the exercises that are
Capítulo 5. Results 41
Tabela 6 – Robustness of Differential Partial Effects of Occupational Measures on Wages (Pla- cebo Results)
Dep. Var.: wiot (1) (2) (3) (4)
Measure1988 0.057* 0.059 0.059 0.057*
(0.033) (0.036) (0.036) (0.033)
Measure1989 0.011 0.002 0.003 0.011
(0.011) (0.012) (0.012) (0.015)
Measure1990 0.011 0.008 0.008 0.010
(0.012) (0.014) (0.014) (0.012)
Measure1991 0.013* 0.018** 0.017** 0.012
(0.008) (0.008) (0.008) (0.008)
Measure1993 0.024 0.018 0.020 0.023
(0.020) (0.022) (0.022) (0.020)
Measure1994 0.046** 0.030 0.033 0.045**
(0.022) (0.023) (0.021) (0.021)
Measure1995 0.056***
(0.021) 0.038* (0.021) 0.040* (0.021) 0.054*** (0.026)
Measure1996 0.057***
(0.018) 0.039* (0.018) 0.041** (0.019) 0.056*** (0.017)
Measure1997 0.056***
(0.017) 0.034* (0.017) 0.035** (0.018) 0.055*** (0.016) Controls
Measure C C C C
Years FEs Education FEs Job Tenure Quartic Occupational FEs
Sector FEs and Yearly Trends Highschool FE and Yearly Trend College FE and Yearly Trend
Microregion FEs and Post-Shock Trend
C C C C C C C C C C C C C C C C C C C C C C C
Capítulo 5. Results 42
Tabela 7 – Robustness of Differential Partial Effects of Occupational Measures on Wages (Alter- native Measures)
Dep. Var.: wiot (1) (2)
Measure1988 0.043 0.043
(0.035) (0.033)
Measure1989 0.012 -0.009
(0.015) (0.010)
Measure1990 0.001 -0.010
(0.007) (0.011)
Measure1991 -0.010 0.004
(0.007) (0.006)
Measure1993 0.028 0.024
(0.020) (0.017)
Measure1994 0.062***
(0.025)
0.035* (0.020)
Measure1995 0.082***
(0.025)
0.044** (0.020)
Measure1996 0.083***
(0.019)
0.043*** (0.015)
Measure1997 0.085***
(0.017) 0.040*** (0.014) Measure
Funchal e Soares(2012), CBO 1994
Funchal e Soares(2012), CBO 2002
Autor, Levy e Murnane(2002), DOT
C
C
Capítulo 5. Results 43
Tabela 8 – Differential Partial Effects of Occupational Measures on Wages (Heterogeneity Analy- sis: Pre-shock Microregion Routine Task Intensity)
Dep. Var.: wiot Below Median Above Median
Measurepost 0.030*
(0.017)
0.030*** (0.010)
Observations 203,699 157,470
Controls
Measure C C
Post-shock dummy C C
Education FEs C C
Job Tenure Quartic C C
Occupational FEs C C
Sector FEs and Yearly Trends C C
Notes: Each column displays fixed-effects point estimates of interest (interaction between
mo and yearly dummies centered at 1991) in (4.14) fitted to an unbalanced panel of workers
between 1988 and 1997, using the controls marked in the bottom of the table. Sample size of 343,776 workers in the formal labor market and . Standard errors (in parentheses) clustered at the occupation level. Symbols *, ** and *** indicate that the coefficient is statistically significant at the .10, .05, and .01 level.
Figura 5 – Distribution of Task Proportions
Capítulo 5. Results 44
Figura 6 – Distribution of Real Wage Changes
Notes: Log real wages change by centiles of the occupational mean wage distribution
(at baseline, 1988) are fitted using a weighted local linear polynomial (Epanechnikov kernel, bandwidht 0.075, i.e. 7.5 percentiles of the wage distribution). Data trimmed at the 0.025 quantile due to the existence of outlier occupations.
Figura 7 – Distribution of Percentual Change in Employment Share
Notes: Percentual Change in Employment Share by centiles of the occupational mean