UNIVERSIDADE FEDERAL DO RIO GRANDE DO NORTE CENTRO DE CIÊNCIAS EXATAS E DA TERRA
PROGRAMA DE PÓS-GRADUAÇÃO EM CIÊNCIAS CLIMÁTICAS
Tese de Doutorado
Indicador de vulnerabilidade agropecuária a extremos
climáticos para o Nordeste do Brasil
Bruce Kelly da Nobrega Silva
Indicador de Vulnerabilidade agropecuária a extremos
climáticos para o Nordeste do Brasil
Bruce Kelly da Nobrega Silva
Tese de Doutorado apresentada ao Programa de Pós-Graduação em Ciências Climáticas, do Centro de Ciências Exatas e da Terra da Universidade Federal do Rio Grande do Norte, como parte dos requisitos para obtenção do título de Doutor em Ciências Climáticas.
Orientador: Dr. Paulo Sergio Lucio
Comissão Examinadora
Dr. Bergson Guedes Bezerra Dr. Claudio Moisés Santos e Silva Dr. José A. Marengo
Dr. Carlos A. C. dos Santos Dra. Maria Helena C. Spyrides.
ii
Indicador de Vulnerabilidade agropecuária a extremos
climáticos para o Nordeste do Brasil
Bruce Kelly da Nobrega Silva
D
EDICATÓRIAiv
A
GRADECIMENTOSA Deus, fonte de fé, energia e sabedoria, causa primária de todas as coisas.
Este trabalho não seria possível sem o apoio do Programa de Pós-Graduação em Ciências Climáticas e o auxílio financeiro concedido pela Coordenação de Aperfeiçoamento de Pessoal de Nível Superior - CAPES.
A Empresa de Pesquisa Agropecuária do Rio Grande do Norte – EMPARN, por ceder gentilmente os dados de precipitação do Estado, em pessoa de Josemir pela atenção e ajuda com os mesmos.
A todos os professores do Programa de Pós-Graduação em Ciências Climáticas pela atenção e ensinamentos ministrados.
Ao meu orientador Paulo Sergio Lucio que durante esses anos não desistiu pela orientação, pela troca de conhecimento, pela total liberdade e confiança em mim depositada e por final sua amizade.
Aos amigos do Programa de Pós-Graduação em Ciências Climáticas que tornaram o período de Doutorado mais alegre, em especial aos amigos Renio e Darlan.
Ao amigo Alexandre Lopo, que muitas vezes me incentivou e contribuiu com inúmeras discussões positivas a respeito dos rumos da tese. Durante o tempo aprendi a ter alguém que sempre pude contar seja com uma carona ou com algum sermão.
A ajuda de Nete e George que inúmeras vezes que me socorreu com o R.
Ao amigo Jarllys Reis que pessoalmente não conheço, mas contribuiu muito com a resolução de problemas no Quantum Gis.
A amiga Priscilla Teles pelo apoio, mesmo estando em caminhos diferentes nunca esqueceu nossa amizade.
Ao secretario da Pós-Graduação em Ciências Climáticas Paulo Guerra, pela atenção e assistência prestada durante o curso.
Ao Professor Francisco Alexandre, pela iniciativa, coragem e dedicação de criar o PPGCC não teria tido essa experiência profissional e de vida.
RESUMO GERAL
Os efeitos das mudanças climáticas sobre as sociedades humanas tornaram-se o foco entre diversos pesquisadores. Entender os padrões climáticos (circulação da atmosfera, precipitação, temperatura) é essencial para a previsão de extremos climáticos, mas o grande desafio é analisar como esses eventos extremos atuam em nossa sociedade e procurar meios de diminuir o seu impacto. Um conceito bastante utilizando em ciências humanas e sociais para compreender esses impactos e o processo de adaptação da sociedade é o da vulnerabilidade. O objetivo deste trabalho é desenvolver e aplicar uma metodologia multi escala para avaliar e quantificar a vulnerabilidade do Nordeste Brasileiro a extremos climáticos, desenvolvendo uma metodologia que combina aspectos de vulnerabilidade a seca, bem como utilizar indicadores socioeconômicos e climáticos para avaliar a exposição, capacidade de adaptação e a sensibilidade das microrregiões geográficas desta área. A avaliação da susceptibilidade ou grau de exposição ao risco regional foi utilizando o SPI (Standardized Precipitation Index) através do grau de magnitude de seca (MD), os índices de chuva como o PCD (Precipitation Concentration Degree) e PCP (Precipitation Concentration Period) ajudaram a caracterizar e climatologia regional. Esses índices apresentaram resultados satisfatórios no estudo piloto do Rio Grande do Norte para avaliar o grau de exposição à seca. No que diz respeito a sensibilidade agrícola/agropecuária a técnica estatística multivariada análise fatorial apresentou resultado aceitável para o modelo proposto usando dados referentes ao período 1990-1999 (P1). A aplicação da análise de vulnerabilidade considerando tanto a capacidade adaptativa, quanto a incapacidade adaptativa apresentaram resultados praticamente similares com grande parte da região com extrema vulnerabilidade localizada ao sul do estado da Bahia assim como parte da região semiárida apresenta grau de vulnerabilidade entre moderado e médio.
vi
GENERAL ABSTRACT
The effects of climate change on human societies have become the focus of many researchers for their research. Understanding weather patterns (circulation of the atmosphere, precipitation, temperature) is essences for predicting extreme weather, but analyze how these extreme events act in our society and look for ways to reduce the impact caused by these events is the great challenge. Using a concept very in the humanities and social sciences to understand these impacts and the adaptation of the society's vulnerability. The objective of this work is to develop and apply a methodology for evaluating fining scale and quantify the vulnerability of the Brazilian Northeast to climatic extremes, developing a methodology that combines aspects of vulnerability to drought, as well as socioeconomic and climatic indicators used to assess exposure, ability to adaptation and the sensitivity of geographical microregions of the region. The assessment of the susceptibility or degree of exposure to risk is the regional using the SPI (Standardized Precipitation Index) by the degree of magnitude dried (MD), the rate of precipitation such as PCD (Precipitation Concentration Degree) and PCP (Precipitation Period Concentration) helped characterize and regional climatology, these indices showed satisfactory results in the pilot study of Rio Grande do Norte to assess the degree of exposure to drought. Regarding sensitivity agricultural / livestock multivariate statistical technique to factor analysis showed acceptable results for the proposed model using data for the period 1990-1999 (P1). The application of the analysis of vulnerability considering the adaptive capacity, as the adaptive disability have almost similar results with much of the region's vulnerability to extreme south of Bahia state as a part of the semiarid region has a degree of vulnerability among moderate and mean .
SUMÁRIO
Lista de Figuras _____________________________________________________ vii
Lista de Tabelas ______________________________________________________ ix
Lista de siglas ________________________________________________________ x
Introdução geral ______________________________________________________ 1
Metodologia geral _____________________________________________________ 5
Determinação do fator de exposição ao extremo climático ____________________ 6
Determinação a sensibilidade da produtividade agrícola/ agropecuária a extremos climáticos. __________________________________________________________ 6
Determinação do fator capacidade de adaptação a extremos climáticos de precipitação ________________________________________________________ 7
Processo de geração dos mapas _________________________________________ 7
Capítulo I ____________________________________________________________ 9
Characterization of risk/exposure to climate extremes through some precipitation indices for the Northeast of Brazil - Case Study: Rio Grande do Norte _________ 9
Capítulo II __________________________________________________________ 24
Indicator of agriculture vulnerability to climatic extremes. A conceptual model with case study for the Northeast Brazil _________________________________ 24
Capítulo III _________________________________________________________ 42
Indicador de vulnerabilidade agrícola a extremos climáticos de precipitação para o Nordeste do Brasil __________________________________________________ 42
anexos ______________________________________________________________ 68
Anexo A ___________________________________________________________ 69
Anexo B ___________________________________________________________ 70
apêndices ___________________________________________________________ 72
Apêndice A ________________________________________________________ 73
vii
LISTA DE FIGURAS
CAPÍTULO 1
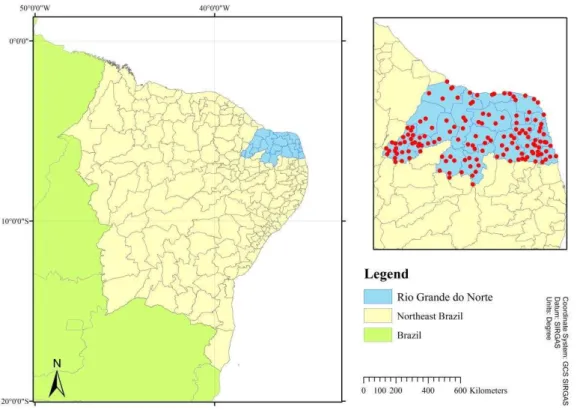
Figure 1. Study area of Rio Grande do Norte State, located in Northeast Brazil with political division in micro-regions. ... 14
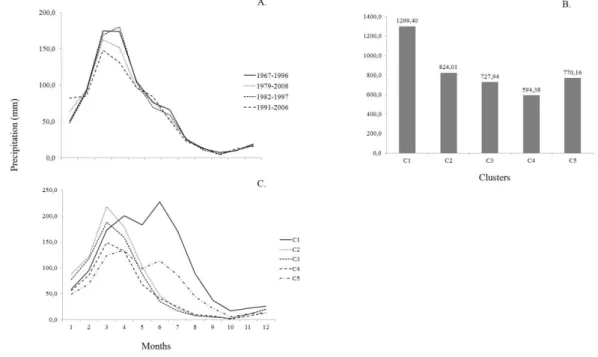
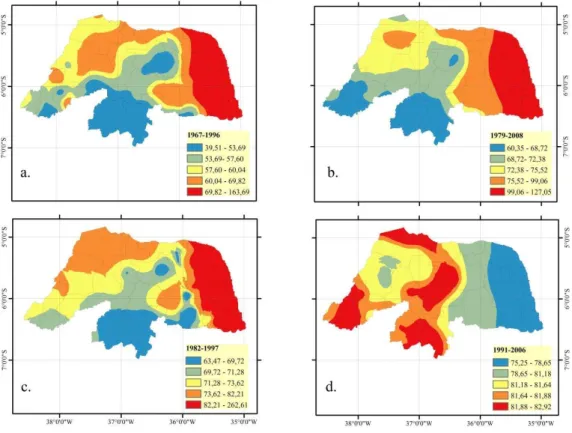
Figure 2. climatology characterization of the State of Rio Grande do Norte A), and characterization of the selected period 1979-2008 is shown where the climatic characteristics of homogeneous groups of precipitation B) and C). ... 15
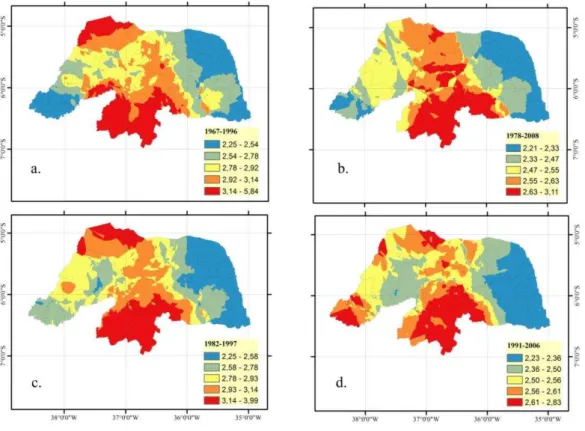
Figure 3. Characterization of homogeneous regions degree of drought magnitude (MD) for each reporting period of study... 18
Figure 4. Characterization of the areas of precipitation concentration degree, (PCD). . 20
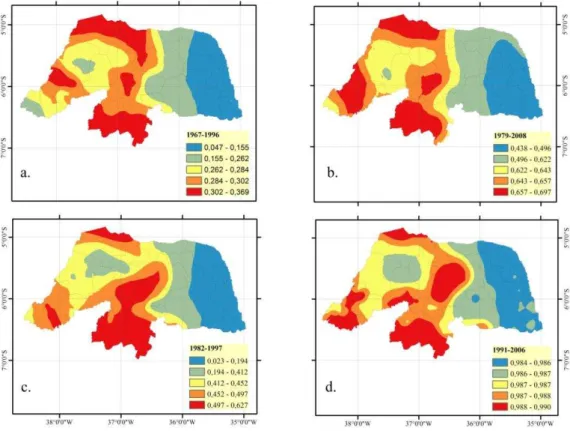
Figure 5. Characterization of homogenous areas of the precipitation concentration period, (PCP). ... 21
Figure 6. Characterization of exposure factor to drought for each period studied. ... 22
CAPÍTULO 2
Figure 1. Study area of the State of Rio Grande do Norte in the Northeast Brazil, with political division in micro regions. ... 30
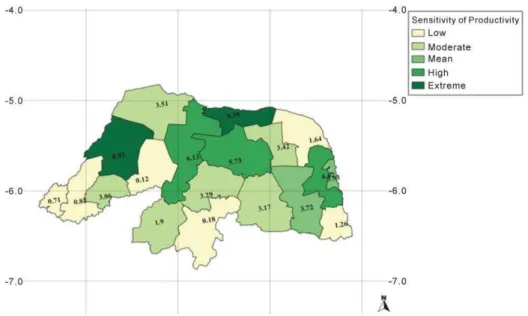
Figure 2. Indicator of sensitivity of agricultural productivity to climate extremes. ... 35
Figure 3. Climatology of Rio Grande do Norte for different periods A) classification of homogeneous group of precipitation for the period of 1979-2008 B) and total precipitation for each group C). ... 36
Figure 4. Characterization of homogeneous precipitation regions of Rio Grande do Norte.The software used to make these maps was Quantum Gis, where the interpolation of the used groups was the inverse of the distance, that is the point that presents the greatest ... 37
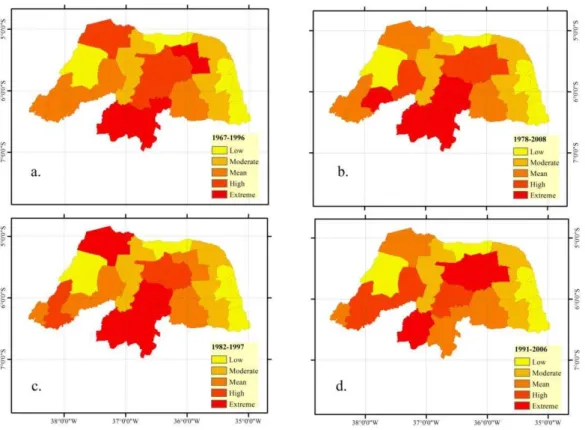
Figure 5. Factor of exposure to climatic extremes for each micro region of Rio Grande do Norte, were period are: 1967-1996 Fig. 5A; 1979-2008 Fig. 5B; 1982-1997 Fig. 5C and 1991-2006 Fig. 5D. ... 38
CAPÍTULO 3
Figura 1. Área de estudo destacando a divisão política da região em micro regiões junto com as estações de precipitação da Agencia Nacional das Águas (ANA)... 47
Figura 2. Caracterização climática da precipitação no Nordeste do Brasil, período de 1980 a 2011. ... 52
Figura 3. Caracterização do indicador composto de seca (ICS) com base nos dados da defesa civil e caracterização da susceptibilidade/risco com a composição do (IES) com a espacialização do MD combinado com o ICS formando o IES. ... 53
Figura 4. Espacialização do indicador de sensibilidade agropecuária para o Nordeste do Brasil para os respectivos períodos a) 1990-1999 e b) 2000-2010. ... 58
Figura 5. Caracterização da vulnerabilidade a agrícola a extremos climáticos de precipitação para o NEB considerando o fator de capacidade e adaptação nos a) 1990-1999 e b) 2000-2010. ... 59
ix
LISTA DE TABELAS
CAPÍTULO 1
Table 1. The relation between annual PCP and the month (in degrees). ... 17
CAPÍTULO 2
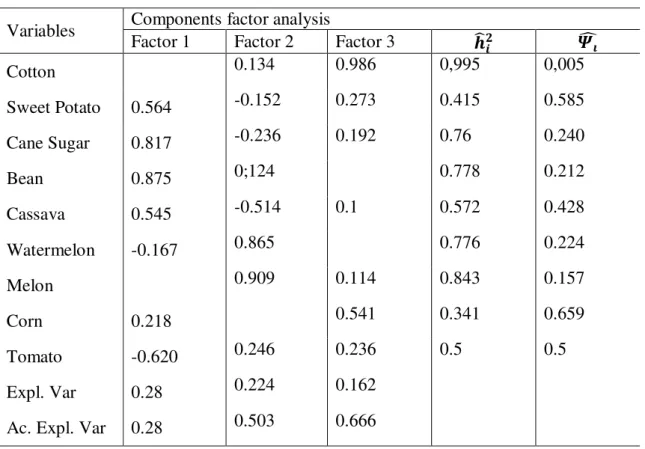
Table 1. Factors observed for subset temporary crops – Varimax rotation. ... 34
CAPÍTULO 3
Tabela 1. Medidas de adequação amostral, como o teste de Kaiser-Meyer-Olklin (KMO), teste de esfericidade de Bartlett (BTS) e p-valor. ... 54
Tabela 2. Valores referentes à medida de adequação amostral (MSA), comunalidade inicial e comunalidade finais, referentes ao P1. ... 55
LISTA DE SIGLAS
AC Capacidade Adaptativa
AF Analise Fatorial
AI Incapacidade Adaptativa
ANA Agência Nacional das Águas
BTS Teste de Esfericidade de Bartellet
CEPED Centro universitário de estudos e pesquisas sobre desastres.
DM Dry Magnitude
EMBRAPA Empresa Brasileira de Pesquisa Agropecuária
ENSO El Niño-Souther Oscilacion
E Exposição ao extremo climático
IBAMA
Instituto Brasileiro do Meio Ambiente e dos Recursos Naturais Renováveis
IBGE Instituto Brasileiro de Geografia e Estatística
ICs Indicador composto de seca
IDEMA Instituto de Defesa do Meio Ambiente
IvA Indicador de vulnerabilidade agrícola a extremos de precipitação
Is Indicator of drought
ITCZ Intertropical Convergence Zone
Iv Indicador de vulnerabilidade a extremos climáticos
KBE Krigagem Bayesiana Empírica
KMO Kaiser-Meyer-Olklin
MAS Measure of Sampling Adequacy
NEB Nordeste do Brasil
PCD Precipitation Concentretaion Degree
PCP Precipitation Concentretaion Period
RMS root mean square
RN Rio Grande do Norte
SeA Sensibilidade da produtividade agropecuária
SIG Software de Informações Geográficas
SIGA-ASA Sistema Integrado de Gestão e Auditoria- Articulação do Semiárido
SPI Standardized Precipitation Index
1
INTRODUÇÃO GERAL
Diante de eventos climáticos extremos como secas e enchentes, o debate que discorre na comunidade cientifica é se a intensificação ou não de eventos extremos é devido às mudanças climáticas no planeta e se estas decorrem da ação antropogênica. A grande questão a ser discutida refere-se às condutas da sociedade civil como também o posicionamento dos governantes para enfrentar tais eventos. De acordo com o relatório da United Nations Delevopment Programme-UNDP (2004), no período de 1980 a 2000, as regiões habitadas por 75% da população mundial já foram atingidas, ao menos uma vez, por algum tipo de evento extremo (ciclone tropical, enchentes, secas ou terremotos). Ao longo da década os desastres têm aumentado em frequência e extensão. Nos países em desenvolvimento tais acontecimentos têm impacto desproporcional, já que o risco está aliado a outros fatores como ações preventivas do governo e baixos níveis socioeconômicos (UNDP, 2010).
Especificamente, a região Nordeste do Brasil (NEB) possui área equivalente a aproximadamente 18% do território nacional, compreendendo a maior região semiárida do planeta, no qual abriga a caatinga, um dos biomas mais susceptíveis e abrangendo espécies da fauna e flora endêmicas. A região NEB têm alta variabilidade espaço-temporal da precipitação, estando dessa forma, mais susceptível a eventos extremos de precipitação como seca e enchente.
Index), devido a sua operacionalidade e resultados satisfatórios em diversos estudos (Paulo, Ferreira, Coelho, & Pereira, 2005); (Duggins, Williams, Kim, & Smith, 2010);
(Potop, Možný, & Soukup, 2012). Com o intuito de compreender os efeitos dos extremos climáticos nas diferentes esferas da sociedade, a literatura abrange o conceito de vulnerabilidade (Adger, et al., 2004; Nelson, et. al, 2010; O’Brien, et al., 2004), no entanto, não é um conceito simples de ser aplicado devido a quantidade de fatores que influenciam o grau de impacto do evento (Adger et al., 2004); (Cardona, 2003). A vulnerabilidade a mudanças climáticas engloba dois componentes: o risco de ocorrência de um evento climático extremo poder ser compreendido como sensibilidade ao extremo climático (ex: seca, ciclones, El ninõ, cheias) e a capacidade de adaptação das comunidades perante a esse evento (tais como recursos materiais, financeiros, estratégias de adaptação, entre outros). Nos últimos anos, apesar de seu uso frequente, o conceito de vulnerabilidade é raramente convertido em medidas analíticas que podem ser utilizadas para priorizar e avaliar o impacto das políticas de intervenção. De fato, a demanda por estudos e pesquisas que prioriza a política de adaptação surgiu com a consciência da ameaça a extremos climáticos, principalmente na produção de alimentos e impactos ambientais (Nelson et al., 2010).
No Brasil o conceito de vulnerabilidade aplicada em ciências climáticas pode ser mostrado em Marengo (2008); Confalonieri (2007); Barata & Confalonieri (2011). O grau de vulnerabilidade comumente utiliza um conjunto de indicadores ou avalia a estimativa dos índices de vulnerabilidade a partir desses indicadores. Os indicadores são úteis para analisar a tendência e explorar modelos conceituais, possuindo flexibilidade de ser aplicável em escalas diferentes (Gbetibouo, Ringler, & Hassan, 2010). Contudo, os indicadores são limitados por falta de informação sobre a forma de escolhas dessas variáveis e quais regras foram estabelecidas para determinar um índice de vulnerabilidade de uma determinada região ou comunidade (Luers, Lobell, Sklar, Addams, & Matson, 2003). Estas limitações conduziram Simelton, Fraser, Termansen, Forster, & Dougill (2009) a utilização de ferramentas estatísticas e correlacionar vulnerabilidade de culturas à seca com indicadores socioeconômicos, como forma de identificar os fatores que tornam as regiões mais vulneráveis.
A principal hipótese da pesquisa é a existência de uma relação entre os espaços
3 infraestrutura agrícola, ou seja, aquelas comunidades com menos recursos naturais e tecnológicos. O conhecimento das vulnerabilidades das regiões mais susceptíveis a extremos climáticos contribuirá na identificação sobre quais serão as áreas potencialmente de risco, e possibilitará a elaboração e implantação de políticas e medidas de adaptação e mitigação dos efeitos causados pela mudança do clima. O objetivo deste trabalho é desenvolver e aplicar uma metodologia multi escala para avaliar e quantificar a vulnerabilidade do NEB. Diante disso, os objetivos do estudo são:
1. Avaliar a climatologia da precipitação no estado do Rio Grande do Norte utilizando indicadores climáticos como o PCP e PCD, além de verificar o fator de exposição ou risco à seca utilizado dados de desastres naturais no período de 1991-2010, junto com SPI calculado para o período chuvoso verificar a dinâmica do fator exposição ou risco a seca. (Capitulo 1);
2. Usando a técnica estatística multivariada analise fatorial determinou-se a sensibilidade agrícola aos extremos de precipitação, com isso possibilitou a aplicação da analise de vulnerabilidade agrícola para o estado do Rio Grande do Norte. (Capitulo 2); 3. Usando as técnicas aplicadas nos capítulos anteriores o estudo foi feito para toda a NEB, caracterizando as áreas agrícolas mais vulneráveis da região, sendo assim desenvolvida uma metodologia de estudo para analisar a vulnerabilidade agrícola aos extremos de precipitação (Capitulo 3).
Assim sendo, a tese busca validar a seguinte hipótese: sendo o (NEB) uma região conhecida por suas fragilidades climáticas e socioambientais e por concentrar áreas com grande potencial agroeconômico, necessita-se de pesquisas que identifiquem as áreas mais vulneráveis e com isso avaliar os possíveis impactos das culturas agrícolas na região aos extremos de precipitação.
ESTRUTURA DA TESE
Inicialmente foi feita a obtenção de dados junto ao IBGE dos dados agrícolas referentes ao período de 1990-2011 e dados do censo agropecuário de 2006. Os dados de precipitação foram obtidos junto a Empresa de Pesquisa Agropecuária do Rio Grande do Norte-EMPARN, com isso os artigos 1 e 2 foram feitos para estabelecer a metodologia de estudo para o NEB. No qual esse usou dados da Agência Nacional de Águas (ANA). O primeiro artigo capitulo 1, busca justificar o uso do fator de exposição/risco a seca, onde foi caracterizado a climatologia do estado de indicadores poucos utilizados como PCP e PCD e mais difundido como o SPI, o artigo foi submetido a Theoretical and Applied Climatology, depois dessa etapa foi realizado a
pesquisa de vulnerabilidade agrícola para o Rio Grande do Norte publicado em
Amospheric and Climate. Com a base do estudo definida foi feito o estudo para NEB,
5
METODOLOGIA GERAL
Neste estudo a vulnerabilidade agrícola a extremos climáticos seguiu a proposta por Antwi-Agyei, Fraser, Dougill, Stringer & Simelton (2012), escrita abaixo:
V = f E + S − AC (1) Sendo: E a exposição ao extremo climático (seca ou enchente), S é a sensibilidade da produtividade ao evento extremo e AC é a capacidade adaptativa dessas regiões em lidar com o evento extremo. Portanto, de acordo com a equação (1), pode-se dividir a análise em três etapas: a primeira envolve a determinação da exposição ao extremo climático, que considera o uso de dados pluviométricos existentes para estimar a exposição à seca por meio de indicadores climáticos como o SPI, PCP e PCD, com o número médio de eventos extremos (secas, inundações bruscas e graduais) decretados no período de 1991-2010. A segunda etapa determinou-se a sensibilidade da produtividade à seca, criando um índice de rendimento agrícola, no qual são consideradas as variáveis de produção de alimentos através em lavouras temporárias e permanentes, extrativismo animal e vegetal, essa metodologia diferente da utilizada por Simelton et al., (2009); Antwi-Agyei et al., (2012), considera culturas especificas e faz a estimativa de produtividade através de um modelo de tendência produtiva. Nesta pesquisa utilizou-se a metodologia da análise fatorial, trabalhada inclusive em estudos de vulnerabilidade climática (Confalonieri, 2007); (Barata & Confalonieri, 2011). Para construção desse indicador, fez-se o uso de dados do Instituto Brasileiro de Geografia e Estatística-IBGE no período de 1990-2011, esse período compreende entre dos censos
DETERMINAÇÃO DO FATOR DE EXPOSIÇÃO AO EXTREMO CLIMÁTICO
O fator de exposição ao extremo climático (Es) pode ser considerado também como risco (Cardona, 2003), defini como perigo latente ou algo externo que submetido o objeto (microrregião). Para Kienberger, Lang, & Zeil, (2009) considerar a variável no modelo de vulnerabilidade pode ser um erro, já que o mesmo é uma variável muito complexa a ser avaliada dependendo das características locais (biofísicas e socioeconômicas), além da variabilidade. Diante desta dificuldade, o autor propõe escrever a vulnerabilidade em termos de susceptibilidades (biofísicas e socioeconômicas). Então para avaliar o E usaram-se alguns indicadores climáticos como PCD e PCP ( Zhang, L. & Qian, Y ., 2003; Li et al., 2010) além do indicador de seca SPI proposto por Mckee et al., (1993) no qual calculava a magnitude da seca para o período analisado.
DETERMINAÇÃO A SENSIBILIDADE DA PRODUTIVIDADE AGRÍCOLA/ AGROPECUÁRIA A EXTREMOS CLIMÁTICOS.
As análises estatísticas foram realizadas com o software R (R Core Team, 2013). Para determinar a sensibilidade foi aplicada a análise fatorial (AF) descrita no Anexo A, no qual é uma metodologia diferente empregada por Simelton et al., (2009), mas utilizada em trabalhos que aplicam o conceito de vulnerabilidade (Confalonieri, 2007; Barata & Confalonieri, 2011; (Figueiredo & Silva, 2010). O principal objetivo da (AF) é reduzir o número de variáveis e construir com base nos fatores estimados na AF um novo banco de dados no qual possui um grau de variabilidade muito próximo com as variáveis originais (Anexo A). Isto é importante para saber quais características são realmente necessárias para definir a vulnerabilidade a extremos climáticos e quais áreas produtivas podem ser mais influenciadas por essas mudanças.
7 estar entre 0 e 1. Quanto mais próximo de 1 melhor a adequação Hair Jr et al., (2009) sugerem 0,50 como patamar aceitável. Por fim, a estatística Bartlett ou teste de esfericidade de Bartlett (BTS), em que a hipótese nula (Ho) da matriz de correlação
entre as variáveis é uma matriz identidade, ou seja, as variáveis não correlacionadas, para teste o valor tem que ser significativo p<0,05.
DETERMINAÇÃO DO FATOR CAPACIDADE DE ADAPTAÇÃO A EXTREMOS CLIMÁTICOS DE PRECIPITAÇÃO
Na pesquisa o primeiro componente do fator capacidade de adaptação representa o capital físico ou tecnologia empregada, que é composto pelo número médio de produtores que utilizam sistema de irrigação, esta variável é interessante devido à abrangência de setores envolvidos como, recursos financeiros e disponibilidade de recurso natural. O segundo componente está ligado a ações sociais por parte do governo para o enfretamento do estresse, que é o número médio de tanques (ou cisternas) construídos, projeto do governo federal no combate contra a seca, chamado SIGA-ASA. Com base nesses dados foi gerado um arquivo raster de AC e esse foi combinado com o
uso do software de geoprocessamento de forma sugerida na eq. 1 para gerar o mapa de capacidade de adaptação e incapacidade de adaptação que é apresentado nas Figuras (ia) e (ib) no anexo D, respectivamente
PROCESSO DE GERAÇÃO DOS MAPAS
A geração dos mapas foi por meio de um software de informações geográficas ou geoprocessamento (SIG). Com base de dados vetorial referente a cada microrregião foi gerado um arquivo raster. O raster constitui de um modelo matricial de terreno onde a
matriz M(i,j) sendo que i colunas e j linhas definem os pixel (picture element). Cada
pixel apresenta um valor referente ao atributo, além dos valores que definem o número da coluna e o número da linha, correspondendo, quando o arquivo está georeferenciado, a um par de coordenadas x e y que se encontra dentro da área abrangida por aquele pixel. As principais vantagens de arquivos raster são:
A posição de cada célula é dada pelo número da linha e da coluna em que esta se encontra;
Facilita operações algébricas entre camadas (operações com matrizes), correspondendo a operações algébricas entre os pixels de camadas sobrepostas corretamente, ou seja, georeferenciadas e com mesma resolução espacial.
O processo de interpolação utilizado foi a Krigagem que é um método de regressão usado em geoestatística para aproximar ou interpolar dados. Pode ser entendido como predição linear ou forma da inferência bayesiana disponível no Anexo B. Parte do princípio que pontos próximos no espaço tendem a ter valores mais parecidos do que pontos mais afastados. A técnica de Krigagem assume que os dados recolhidos de uma determinada população encontram-se correlacionada no espaço. A krigagem bayesiana empírica (KBE) é um método de interpolação geoestatística que automatiza os aspectos mais difíceis de construir um modelo de krigagem válido. Outros métodos de krigagem em geoestatística exigem o ajuste de alguns parâmetros, a fim de receber os resultados precisos, mas KBE calcula automaticamente esses parâmetros através de processos de subdivisão e simulações. Krigagem bayesiana empírica também difere de outros métodos de krigagem por incluir o erro introduzido através da estimativa do semivariograma subjacente. Ainda, metodologias diferentes de krigagem calculam o semivariograma a partir de dados locais conhecidos e usam este único semivariograma para fazer previsões em locais desconhecidos; este processo assume implicitamente que o semivariograma estimado é o verdadeiro semivariograma para a região de interpolação. As principais vantagens do KEB são:
As estimativas são mais precisas quando comparada com outros métodos de krigagem;
Permite previsões precisas de dados moderadamente não estacionários;
C
APÍTULO
I
C
HARACTERIZATION OF RISK/
EXPOSURE TO CLIMATE EXTREMESTHROUGH SOME PRECIPITATION INDICES FOR THE
N
ORTHEAST OFCharacterization of risk/exposure to climate extremes for the
Northeast of Brazil - Case Study: Rio Grande do Norte
Bruce Kelly N. Silva* Paulo S. Lucio
Programa de Pós-graduação em Ciências Climáticas, Universidade Federal do Rio Grande do Norte, Campus Lagoa Nova, 59075-180, Natal-RN, Brasil.
e-mail: brucekellys@hotmail.com
Aceito na: Theoretical and Applied Climatology, ISSN: 0177-798X, doi: 10.1007/s00704-014-1275-z
11
Resumo
A mudança climática poderá aumentar o risco de inundações ou secas. Até o momento, poucos estudos têm projetado mudanças nos extremos climaticos em uma escala regional ou local. Alguns estudos já começaram a estimar a exposição a inundações ou secas como um proxy de risco, assim apresenta-se um exercício de análise de risco. Os estudos de mudança climática e seus impactos raramente produzir consenso sobre a distribuição da exposição, vulnerabilidade ou possíveis resultados. Além disso, o Nordeste brasileiro (NEB) é conhecida por sua variabilidade temporal e espacial da precipitação vários estudos investigaram essa variabilidade, a fim de compreender os episódios prejudiciais, como secas e inundações. No NEB o fenômeno da seca é uma questão complexa, porque milhões de pessoas são afetadas e por isso, é um importante objeto de estudo em diversas áreas do conhecimento. Uma forma de tentar argumentar sobre este fenômeno é através do conceito de vulnerabilidade. Neste estudo preliminar uma têm-se vontade de determina o fator de risco ou exposição à seca, que é um componente de vulnerabilidade, principalmente em relação as atividades agrícolas. A base para a construção do indicador de risco / exposição seca foram o índice de precipitação padronizada (SPI) (e outros dois indicadores período de concentração de precipitação (PCP) e do grau de concentração de precipitação (PCD)) que servem como uma boa revisão e confirmação, nos períodos chuvosos em Rio Grande do Norte - Brasil. Os índices de exposição mostrou um aumento dos valores altos de 1979 a 2008 ao contrário do período 1967-1996 mostrou que o fator de risco em algumas microrregiões apresentaram índices baixos em maior número, uma nota que a dinâmica do fator é em uma evolução entre alta e extremos.
1. Introduction
Discussions on climate change by civil society tend to focus on the global average temperature increase, however, the climate varies significantly on regional scale, and changes in the pattern of rainfall in certain regions will be intense (IPCC, 2007). The main negative effects of rainfall deficit are: decrease of harvests, rising of food price, environmental degradation (fires, deforestation), losses in livestock (death of livestock), and water scarcity. Identifying these patterns of changes in precipitation and temperature is the major challenge of climate models, and even with the technology it has not been easy once there is still a significant difference between what is expected and observed (Al, 2006) Today, climate models include quantity of climate data (precipitation, temperatures, among others), as well as its effects (El niño, La niña, droughts, storms), all of which can be calculated in a spatial and temporal resolution relatively good, covering regions or the entire planet (IPCC, 2007). Nevertheless, these models have not been designed to fully capture one of the most important aspects of climate system: the human capacity to respond to changes in regional and local climate patterns (Paavola, 2008; Simelton, Fraser, Termansen, Forster, & Dougill, 2009; Antwi-Agyei, Fraser, Dougill, Stringer, & Simelton, 2012).
Drought is a temporary phenomenon inherent of certain regions of the planet, for example, the Northeast Brazil (NEB), despite the drought to occur in a slow way, it causes great impact, currently being considered as the most significant natural disaster in the world (Wilhelmi, 2002). In Brazil there is a difference between the concepts of drought and dryness. The second is generally associated with periods of water shortage. However, there is no difference internationally, where drought is referenced to a single event, classified due to impacts caused by such event. Many studies have been developed in several parts of the world to better understand and mitigate the effects of this phenomenon.
13 that could include forecasting, monitoring, prevention, evaluation of vulnerability of sectors and regions, and assistance and response to drought impacts.The concept of vulnerability is extremely large due to several factors that contribute to its event and the nature of its impact.(Cardona, 2003; Adger, Brooks, Bentham, & Agnew, 2004; Brooks, Neil Adger, & Mick Kelly, 2005; Hufschmidt, Crozier, & Glade, 2005; Füssel, 2010). Climate change vulnerability comprises two components: the risk of occurrence of an extreme weather event (droughts, floods, cyclones, etc.) and the adaptation capacity of communities towards such event (such as material and financial resources, implementation of adaptation strategies, etc.) (Kienberger et al., 2009). For the current analysis, all the physical-natural and socioeconomic impacts on the occurrence of extreme climate events are considered vulnerability, and the incapacity of population to adapt, and even aggravated by the levels of poverty that the population faces. One way to evaluate the exposure degree of a place or region is through climatic rates. Another form of evaluation is proposed by (Li et al., 2010) is the degree of precipitation concentration degree (PCD) and the precipitation concentration period (PCP) used in the Northwest of China (Zhang, L; Qian, Y, 2003).
2. Material and Methods
2.1. Study Area
The Rio Grande do Norte (RN) is a state of Brazil located northeast of the NEB. The state area is 52.796.791km2, equivalent to 0.62% of the national territory and 3.40% the NEB (IBGE, 2010). According to its geopolitical characteristics, RN is divided into 19 micro-regions as shown in Figure 1.
Figure 1. Study area of Rio Grande do Norte State, located in Northeast Brazil with political division in micro-regions.
15 dominates almost all the rest of the state, including north coast, its average temperatures is around 26ºC, while the rains are irregular causing drought periods, with registered ratings below 600mm/year (CEPED, 2011).
2.2.Climatological characterization of the Rio Grande do Norte
In order to determine the risk factor it was necessary to determine the climatology of the region studied, and mainly the rainy trimester. First, one has established normal climatological periods, that are those of 1967-1996 and 1979-2008, the others were to verify the behavior of the time series in order to detect some abnormalities, however it is observed a decrease in the intensity, which is explained by decade variability associated with El Niño-Southern Oscillation (ENSO) that NEB possesses, already gauged by (Wagner., 1996; Shukla J.; Paulo Nobre; 1996) but the main objective was to identify the rainy season, characterized by March - June. Figure 2 A.
Figure 2. climatology characterization of the State of Rio Grande do Norte A), and characterization of the selected period 1979-2008 is shown where the climatic characteristics of homogeneous groups of precipitation B) and C).
(Ferreira & Mello, 2005), however the synoptic scale systems such as easterly waves that are responsible for the rainfall in the eastern coastal NEB, mainly in the area of forest that extends from this recôncavo Baiano, the coast line that surrounds the bay,
until the coast of Rio Grande do Norte and finally the sea breeze system, which associated to the trade winds can penetrate within 100 km to the continent causing favorable conditions for precipitation. As the study area has high climate variability, the multivariate cluster technique is applied to group, the more homogeneous regions of precipitation. In order to build this graph in Figure 2B the period of 1979-2008 used is a normal climatology; the main factor that highlights is the intensity of rainfall months in both groups (G2, G3 and G4) that is the month of March, the G5 is the month of May and by the end of June for G1. In Figure 2C, one has the value of total precipitation where G1 has a value of 1299.4 mm and the smallest is G4 with 594.38 mm.
2.3 The precipitation concentration degree (PCD) and the precipitation concentration period (PCP)
The calculation principle of PCD and PCP is based on vector of monthly total precipitation. It is assumed that the total monthly precipitation is vector greatness with magnitude and direction for one year and may be seen as a circumference (360º). PCP annually and then PCD to a region, where can be seen by the following equations:
R = ∑ r (1)
R = ∑ r ∗ sin θ (2)
R = ∑ r ∗ cos θ (3)
PCP = tan− ( i
i) (4)
PCD =√ i
2+ i 2
i (5)
Where i represents the year, r and j represents the month and Rij represents the total of precipitation of the month j in a year i. And θi is the azimuth of the month j. The
PCPij represents the period (month) that the total of precipitation is concentrated in a
17 months of the year i. In equations 4 and 5 the o azimuth vector is the composition of
PCP vector, this vector reflects the month in which that maximum precipitation has occurred; Table 1 shows the relation between annual PCP and the given month. The annual PCD reflects the distribution degree of the total annual rainfall between 12 months. The annual PCD varies between 1 and 0, if the total annual precipitation is concentrated in a single month, the PCD has a maximum value, on the other hand, if the total annual rainfall is evenly distributed between the months, PCD can reach its minimum value (Zhang, L; Qian, Y., 2003).
Table 1. The relation between annual PCP and the month (in degrees).
Month 1 2 3 4 5 6 7 8 9 10 11 12
PCP 0 30 60 90 120 150 180 210 240 270 300 330
2.3.The risk/exposure to drought factor
In this study, in order to develop a dry risk/exposure indicator (Is) it will be
constructed based on the SPI, which is widely used around the world (Mckee et al. 1993;Paulo et al. 2005; Duggins et al. 2010; Li et al. 2010), for being of easy application and satisfactory results. The monthly rainfall data were obtained together with Empresa Agropecuária do Rio Grande do Norte-EMPARN within 1964-2008. The other data to compose the Is will be the number of decrees of drought that the
municipality granted within 1991-2010. In order to calculate the IS, the following
procedure was taken: the SPI was calculated for the rainy season, then the total amount accumulated to generate a single value for the season, similar to that proposed by (Mckee et al., 1993) in which the author called dry magnitude (DM), after that, the average value was calculated for the geographic micro region and finally the reason between this value and the average number of droughts enacted. This can be written as the following:
�� = ∑ ���̅
� (6)
The same understanding was applied to estimate the index of abrupt flood (IB) and gradual flood (IG), as it can be seen in the equations:
� =∑ ���̅
� =∑ ���̅
�� (8)
The indicator of sensitivity to climate extremes will be described in the following way:
� = �� − � + � (9)
3. Results
In Figure 3, the magnitude of dry (DM) is shown in Figure 3 using a GIS software to set the intervals used to quantile technique thus has the characterizing each region for DM for each period in Figure 3a it is observed that the east coast as well as the region has harsh DM values ranging from low to moderate in all periods, it is also observed that the central part of the state comprising Seridó region have a range of high to
extreme value of MD. It is noticed also that the change in climatic pattern of DM in Figures 3. and 3b where an increase in the values of DM (Fig. 3b.).
19
Plus a reduction of third DM. and shift eastward Seridó advancing to the wild
(Fig. 3b.) in Figure 3d. We have the period between the agricultural census is observed that there was an increase on the region ranging from DM down east of the state, unlike the southern end which went from low / moderate to high / extreme value of DM (Fig. 3c. 3b . 3a.).
3.1 Characterization of the PCD
Figure 4. Characterization of the areas of precipitation concentration degree, (PCD).
3.2 Characterization of PCP
In Figure 5 the characterization of the precipitation concentration period (PCP), we note that it appears highly variable emphasis on the period from 1982-1997 (Fig. 5d) where a change in the pattern shown in the previous figures. According to (Zhang L; Qian Y, 2003) in Figure 5a have the months of varying concentration of rainfall between the months from February to March (39.51 to 60.04 °), and from April to July (60.04 -163.69 °). Moreover Figure 5b has the PCP between the months from March to April (60-90 °) in almost every state, as part of the east coast has PCP between the months from April to May. In Figure 5c we have the same pattern as the previous one except graze on the east coast where PCP was between the months from May to October, Finally Figure 5d that showed an inverse pattern of PCP in very small variation east coast and across state.
21
Figure 5. Characterization of homogenous areas of the precipitation concentration period, (PCP).
In Figure 6, shows the characterization of the exposure indicator of drought (Is), in the coastal region has low to moderate values in all selected periods, in the central and northwestern part of the state have values ranging Is the media extreme, there is the
Chapada do Apodi with low values of Is in the western state as well as micro Macau
north. In Figure 6d to have a change in the pattern of Isaiah found in other periods for the region East Seridó, formerly high / extreme level of exposure to drought the region
and spent a supposed media exposure to drought, coastal features a null, i.e, the amount we have droughts in these areas, as another has a value greater than 0.44, i.e, this phenomenon occurs in this region less intense. Already present in the central region higher. At the west end shows high values between 0.7 and 0.9. In Figure 8a we have the IS for the period 1967 to 1996, we note that the extreme occurs in Seridó
Figure 6. Characterization of exposure factor to drought for each period studied.
4. Final Considerations
The state of Rio Grande do Norte is inserted in the semiarid region of NEB due to specific characteristics of the region to temporal and spatial rainfall variability is high with the use of Bayesian interpolation and the separation of the intervals using the technique of quantile, the main objective to characterize the degree of exposure to climate extremes, particularly drought across climatic indices such as SPI, PCP and PDC concludes:
1) That the PDC ally the application of Bayesian interpolation technique it is possible to identify regions where rainfall is most intense and where the period of concentration, confirming that helps confirm the climatology of the region;
2) With the aid of the PCP can identify the rainy season or rainy season in the region, besides corroborating the temporal and spatial variability of precipitation, even considering a smaller area than the NEB;
23 valuesaccording to (Zhang, L; Qian, Y, 2003), these values correspond to the month of April.
4) Applying the SPI for calculating the rainy season RN indicator of exposure to drought (IS) presents satisfactory values for the micro-regions, mainly in the central region, extending to Seridó, the west has high values between high and extreme
exposure phenomenon;
PCD and PCP, when combined with the application of a multivariate technique makes possible to identify regions where precipitation is more intense and the period of concentration, confirming that helps to confirm the climatology of the region. Applying the SPI for the calculation in the rainy period of Rio Grande do Norte state, the indicator of risk/exposure to drought (IS) shows satisfactory values for micro regions, mainly for
central region, enclosing Seridó, the high west shows values between high and extreme
C
APÍTULO
II
I
NDICATOR OF AGRICULTURE VULNERABILITY TO CLIMATICEXTREMES
.
A
CONCEPTUAL MODEL WITH CASE STUDY FOR THE25
Indicator of agriculture vulnerability to climatic extremes. A
conceptual model with case study for the Northeast Brazil
Bruce Kelly N. Silva*; Paulo S. Lucio
Programa de Pós-graduação em Ciências Climáticas, Universidade Federal do Rio Grande do Norte, Campus Lagoa Nova, 59075-180, Natal-RN, Brasil.
e-mail: brucekellys@hotmail.com
Resumo
O clima do Nordeste do Brasil (NEB) é conhecido por sua variabilidade temporal e espacial da precipitação. Diversos estudos têm investigado essa variabilidade, a fim de compreender os episódios prejudiciais, como secas e inundações. O fenômeno da seca no NEB é um tema complexo, devido a afetar milhões de pessoas e ser o objeto de estudo por diversos pesquisadores. Uma forma de tentar descrever o fenômeno e seus efeitos é através do conceito de vulnerabilidade. A "operacionalidade" deste conceito amplo de desastres naturais é uma tarefa complexa. Para medir um indicador de vulnerabilidade é necessária uma grande quantidade de dados de diferentes áreas do conhecimento, entre os quais incluem: meteorologia, socioambiental, econômica, saúde pública, entre outras áreas. O principal objetivo deste estudo é a criação de um índice de vulnerabilidade a eventos climáticos extremos (secas e cheias) para o NEB e comparar os indicadores com aqueles encontrados na literatura científica. Os dados que foram utilizados neste estudo são da ANA (Agência Nacional das Águas), IBGE (Instituto Brasileiro de Geografia e Estatística), e Ministério da Integração Nacional. Os resultados mostram que o uso do indicador de vulnerabilidade agrícola mostrou-se satisfatório do ponto de vista metodológico, devido às condições de contorno no modelo fatorial apresentou resultados contraditórios para o indicador de sensibilidade agrícola na microrregião do Vale do Açu, mas nas demais microrregião os resultados bons.
27
1. Introduction
science, which are: human-environmental research and the risk-hazards. The first relates to the study of environmental processes on a global scale, especially climate change and its local to global impacts (Ford, Smit, Wandel, & MacDonald, 2006); (Paavola, 2008) whereas the second carries out a research on natural hazards and disasters, their correlation with vulnerability and resilience, being incorporated in emergency management and hazards mitigation (Wu et al., 2010);(Brooks et al., 2005); (Ahmed, Diffenbaugh, & Hertel, 2009) It also can be said that the first approach emphasizes environmental relations in the configuration of vulnerable spaces and the second focus more on social aspects, in forming vulnerable social groups. There is consensus between the two approaches regarding the composition of the concept which is directed by the elements exposure, susceptibility and response (responsiveness or resilience
capacity), and this requires measurements and representations based on the two approaches of research, environmental and social, once they complement each other. In Brazil, it is growing the number of studies dealing with the spatial hierarchy and the development of vulnerability indexes, attempting to evaluate the social and environmental inequalities and to reduce the risks linked to natural events, such as the studies of Confalonieri, (2007); Barata & Confalonieri, (2011). Another way to analyze vulnerability is with the help of a set of indicators and to evaluate the estimation of vulnerability rates based on these indicators. These indicators are useful for studying trends and for exploring conceptual models, and have the flexibility of being applicable in different scales (Gbetibouo et al., 2010). However, the indicators are limited due to lack of information on how these variables were chosen and rules established to determine the vulnerability index of a particular region or community (Luers et al., 2003). These limitations have led Simelton et al. (2009) to the use of statistical tools and to correlate vulnerability of crops to drought with socioeconomic indicators in order to identify the factors that make the regions more vulnerable in China.
The main hypothesis of the research is that there is a relation between the spaces
29 caused by climate change. As the Brazilian northeast (NEB) is a region known for its climatic and environmental weaknesses and for focusing areas with great agrieconomic potential, researches that identify vulnerabilities and possible impacts in the region are demanded. The objective of this study is to develop and apply a multi scale to evaluate and quantify the vulnerability of Rio Grande do Norte (RN) to identify which areas are vulnerable to climate extremes. In order to achieve this goal, the objectives are the following:
Developing a methodological approach that combines vulnerability aspects of drought crop with socioeconomic indicators;
Using precipitation data and crop yield data, as well as indicators close to the adaptative capacity to evaluate to exposure, adaptation, and sensitivity of the most vulnerable geographical micro-regions of RN;
2. Material and Methods
2.1. Study Area
watermelon. According to the (IPCC,2007) the NEB will suffer due to climate changes, events such as El Niño and La Niña will have more severe effects. The weather is the factor that provides the greatest challenges to the right management of crops. In order to have growing and development of plants, it is necessary that the climate factors, such as average air temperature (day and night), rainfall and solar radiation are in accordance to the crops requirements. The rational management of soil and water by conventional techniques are fundamental to the sustainability, in order to maintain these resources with quality and quantity enough to achieve satisfactory levels of productivity (Sousa et al., 2010).
Figure 1. Study area of the State of Rio Grande do Norte in the Northeast Brazil, with political division in micro regions.
2.2. Methods
31
( )
V f E S CA (1)
where: E is the exposure to extreme climate (drought or flood), S is sensitivity of
productivity to the extreme event and CA is the adaptive capacity of these regions to
deal with the extreme event. Therefore, according to eq. 1 we can divide the analysis into three stages, the first involved the determination of sensitivity of drought productivity, developing an index of income (agriculture) farming, that will be built based on food production which food production variables are considered through temporary and permanent crops, animal and plant extraction, different from the methodology of Simelton et al. (2009); Antwi-Agyei et al. (2012), which considers specific crops and estimates of productivity through a model of productive trend. In this research we used factor analysis methodology, widespread in studies of climate vulnerability Confalonieri, (2007); Barata & Confalonieri, (2011), in order to develop this index, IBGE data were used from 1990 to 2011. The second stage involved the use of existent rainfall data to estimate the exposure to drought by drought index (SPI), and the average number of droughts registered from 1990 to 2010. The rainfall data were acquired in EMPARN (Empresa de Pesquisa Agropecuária do Rio Grande do Norte), the period was from 1964 to 2008, and the drought occurrences were acquired from Atlas of Natural Disasters. The third stage involved the determination of an adaptation capacity index using data from the 2006 agricultural census and from the Ministry of Social Development and Fight against Hunger.
2.2.1 Determining the sensitivity factor of agriculture productivity to extreme climates.
several fields of knowledgement such as climate vulnerability Confalonieri, (2007);Barata & Confalonieri, (2011); agriculture Luers et al. (2003); O’Brien et al. (2004), the main objective of (AF), to reduce the number of variables and built a new database based on estimated factors in AF which have a degree of variability very close to original variables, that is important to know which characteristics are really needed to define the vulnerability to climate extremes and which productive areas can be more influenced by these changes. In order to apply this technique some care must be taken in accordance with the database, Hair Jr et al. (2009); Figueiredo & Silva, (2010) recommends that the variables are continuous or discrete, trying to avoid categorized variables; Regarding the number of observations, the more the better, according to Hair Jr et al., (2009), suggests the sample to have a number of observations over 50, and at least of 100 cases to ensure more robust results. Regarding the method of matching data, the analysis criteria are: the correlation matrix to present values greater than 0.30; the test of Kaiser-Meyer-Olklin (KMO) varies between 0 and 1, the closer to 1, the best adequation. Hair Jr et al. (2009) suggest 0.50 as acceptable level. Finally, Bartelett statistic or Bartlett's test of sphericity (BTS), where it is considered a null hypothesis (Ho) that the matrix of correlation between the variables is identity matrix, that is, the
uncorrelated variables to test the p-value has to be significant (p<0.05).
2.2.2 Determining the exposure to drought
In this study, the indicator for sensitivity to drought (E) will be built based on the standard drought index, the SPI proposed (Mckee et al., 1993) for being of easy application and satisfactory results. The monthly rainfall data were obtained with EMPARN from 1964 to 2008. The other data to compose the Is will be the number of
decrees of drought that the municipality has granted, in the period from 1990 to 2010. In order to calculate the IS, the following procedure was taken: the SPI was calculated for
the shower period, then the total value was accumulated in order to generate a single value for the season, after that, the average value was calculated for the geographic micro region and finally, the reason between this value and the average value of drought enacted. This can be written as the following:
SPI IS
Ns
33
The same understanding was applied to estimate the index of abrupt flood (IB) and gradual flood (IG), as it can be seen in the equations:
SPI IB Nb
(3) SPI IG Ng
(4)Where : Ns,Nb e Ng are the average numbers of disasters linked to extreme precipitation, drought, sudden and gradual inundation, flooding respectively.
The indicator of exposure to climate extremes will be described in the following way:
( )
E IB IG IS (5)
For the construction of each indicator Iv we applied the technique mini-max, whose formulation is the following;
min max min i v v v v v
I
I
I
I
I
(6)Where: Iv is the indicator of vulnerability calculated for the respective micro region, Iv MAX and IvMIN are the maximum and minimum values of the series, respectively.
2.2.2 Determining the adaptive capacity to drought
1000
C I
CA
N
N
(7)
were: Nc its number average of tanks of water and Ni number average of irrigation system.
4. Results and Discussion
AF applies to the average data set for the periods P1 and P2 by that presents the best KMO, in other words, the AF may be performed with this database, according to Figueiredo & Silva, (2010) KMO > 0.5 the AF is acceptable. The same procedure will be done for subsets Permanent Crop, Vegetal and Animal Extractivism. Table 1 shows the values of the factors, commonalities (hi) and unities (Ψi). It is noted the presence of
commonality below 0.5 commonalities represent the proportion of the variance for each variable included in the analysis which is explained by the extracted components. Usually the minimum acceptable value is 0.50, but in this study we consider 0.6.
Table 1. Factors observed for subset temporary crops – Varimax rotation. Variables Components factor analysis
Factor 1 Factor 2 Factor 3 ̂� �
�
̂
Cotton 0.134 0.986 0,995 0,005
Sweet Potato 0.564 -0.152 0.273 0.415 0.585
Cane Sugar 0.817 -0.236 0.192 0.76 0.240
Bean 0.875 0;124 0.778 0.212
Cassava 0.545 -0.514 0.1 0.572 0.428
Watermelon -0.167 0.865 0.776 0.224
Melon 0.909 0.114 0.843 0.157
Corn 0.218 0.541 0.341 0.659
Tomato -0.620 0.246 0.236 0.5 0.5
Expl. Var 0.28 0.224 0.162
35 Observing the coefficients related to each factor for each attribute evaluated, knowing that these coefficients represent the correlation between factors and attribute, it can be noticed that the first factor is highly correlated with sugar cane. Beans and tomato (Figueiredo & Silva, 2010) adopts the accepted value of at least 0.4. But for this research it is adopted value of at least 0.6. Yet the second factor is highly correlated with watermelon and melon; and the third factor shows coefficient of 0.986 for cotton. This AF shows a total variance of approximately 67% which is acceptable. Who states that the total variance has to be at least 67%. It is observed that the values are nearly the same, what makes the difference is the RMS that P1>P2 therefore adopting the KMO P2 for the subset Plant and Animal Extractivism.
However the same cannot be said to the subset Permanent Crop KMO of the second period less significant than for the AF KMO of P1 is used concluding that the adequacy of data may be applied to AF. The factors 1 is characterized by the dairy activity or activities that needs this component such as cheese or other dairy products. the factor 2 is characterized by deforestation mainly in the semi-arid region where the semi-arid savanna vegetation is considered different from the other regions in relation to its biomass and its structure Amorim, Sampaio, & Araújo, (2005) this characteristic is also reflected in factor 1. Finally the factor 3 that is poultry activity this factor model has a cumulative variance of 54%. With the release of each model, it has been created the IdA indicator (agricultural productivity). Figure 2 describes some areas where some
agricultural products have been more susceptible to climatic extremes.
3.1 Drought exposure factor
In order to determine this factor it was necessary to determine the climatology of the studied area mainly the rainy quarter. First we have established normal climatologically periods which are 1967-1996 and 1979-2008. The others were to verify the behavior of a temporal series in order to detect some abnormalities, however a reduction in the intensity was observed. But the main objective was to identify the rainy period characterized from March to June Figure 3A.
Figure 3. Climatology of Rio Grande do Norte for different periods A) classification of homogeneous group of precipitation for the period of 1979-2008 B) and total precipitation for each group C).
One of the large scale weather systems that occurs in this period is the Intertropical Convergence Zone (ITCZ) which normally migrates seasonally of its position further north between August and October for positions further south approximately 2 to 4º South between February to April, determining the quality of shower periods of the NEB (Ferreira & Mello, 2005). However the synoptic scale systems such as easterly waves that are responsible for the rainfall on the east coast of the NEB, mainly in the area of forest that extends from recôncavo of Bahia. The coast
37 breeze system which associated to the trade winds can penetrate 100 km to the continent causing favorable conditions for precipitation Figure 3.
Considering that the local of study shows high climate variability, the multivariate cluster technique is applied to identiy more homogeneous regions of precipitation, as it can be seen in Figure 4. In order to build this graph in Figure 3B the period of 1979-2008 was used, in this temporal range we have data of demographic census (2000 and 2010) and agriculture (2006), where the data that make up the S and CA were taken. Another factor that is highlighted is the intensity of rainfall months in groups (G2. G3 and G4) that is March, the G5 is May and finally G1 is the end of June. In Figure C we have total value of precipitations where G1 has a value of 1299.4 mm and the lowest is G4 with 594.38 mm. In Figure 4 the degree of homogeneity of rainforest for the selected periods is shown, it is observed that there is a change in the normal pattern when considering normal climatology’s that are different. Figure 4A and 4B, the first one has the usual from 1967 to 1996. Which is introduced in this lower similarity is the eastern part of the state or the coastal strip east. In the second the period was 1979-2008. It is observed that the central part of the state shows less similarity.
In Figure 5, the characterization of exposure indicator of drought (E) is observed in the east coast area, which comprehends the micro region of Natal, and that presents the lowest values of E in all selected periods. It is observed that for the periods there is not too much variation in the condition of high E for the extreme. In the central area of the state the variation within these periods were not significant, however a factor that can be well represented in dynamic of the E for the periods of 1982-1997 and 1991-2006. Figures 5C and 5D. respectively. It is noticed that the condition of extreme E has increased in micro regions of the state, as well as micro-regions that overcame from a degree considered low to a moderate or medium for this periods.
Figure 5. Factor of exposure to climatic extremes for each micro region of Rio Grande do Norte, were period are: 1967-1996 Fig. 5A; 1979-2008 Fig. 5B; 1982-1997 Fig. 5C and 1991-2006 Fig. 5D.
3.2 Determining the adaptive capacity to drought
39 spheres, an adjust only with available data may be done similar to Antwi-Agyei et al. (2012) who used, in order to determine the AC. two indicators: the human capital represented by literacy rate and the financial capital (poverty rate). In this study two indicators were considered that are: physical capital (number of establishments that use irrigation system), this factor is interesting once it is linked directly to the natural resource availability in this case water. The other indicator that represents the characteristic of government action or considered social support will be given by the average number of tanks built a project of the federal government in fighting against drought, named SIGA-ASA. Figure 6 illustrates the AC for micro-regions of Rio Grande do Norte.
Figure 6. Classification of adaptive capacity (AC) of each micro-region of Rio Grande do Norte.
According to Figure 6, the micro-region of Vale de Açu has a maximum value of
1.3 while the micro-region of Natal a minimum of 0.1 that is Vale do Açu shows an AC
(2011) that AC is linked to local socio economic characteristics that is, not only technology should be considered, but subjects about education, health and social programs help to compose the AC that is why Natal does not have a significant value of AC, as it has 112 establishments with the use of irrigation, but it does not have any tank. while Vale of Açu has 924 irrigated establishments and 380 tanks of water.
Figure 7.. Indicator of vulnerability to climate extremes for micro-regions of the State of Rio Grande do Norte.
41
4. Final Considerations
In this study the concept of agricultural vulnerability to climate extremes proposed by Antwi-Agyei et al. (2012); Adimo et al. (2011) which was determined the exposure to drought (E) through SPI it is noticed that the central region of the State shows values between high and extreme vulnerability mainly within the temporal range of 1979-2008. Regarding the agricultural sensitivity factor to extremes, the northwestern region of the state showed higher values configuring that these areas are more sensitive to extremes. Considering that in these areas there are high quantities of agricultural and farming activities, as well as in the eastern part of the state, in the central part there are low values, considering the low level of productivity. The AC factor concludes the need of being improved to include socio economic and demographic subjects, but a good response was obtained with the technology used (irrigation) and social program (tanks of water). Finally agricultural climate vulnerability to climate extremes shows a predominance of medium to high vulnerability, except the micro-regions where the agricultural activity is low, will show low values of vulnerability such as micro-regions of northeast coast and Pau dos Ferros, that show low values vulnerability.
Acknowledgements
C
APÍTULO
III
I
NDICADOR DE VULNERABILIDADE AGRÍCOLA A EXTREMOSIndicador de vulnerabilidade agrícola a extremos climáticos de
precipitação para o Nordeste do Brasil
Bruce Kelly N. Silva*; Paulo S. Lucio e Maria Helena C. Spyrides
Programa de Pós-graduação em Ciências Climáticas, Universidade Federal do Rio Grande do Norte, Campus Lagoa Nova, 59075-180, Natal-RN, Brasil.
e-mail: brucekellys@hotmail.com
Será submetido em: Natural Hazards and Earth System Sciences, ISSN: 1684-9981 Qualis Capes: Geociências, A2.