* Corresponding author. Tel: +09127520226 E-mail addresses: phdmnn@gmail.com (M. Nazari) © 2012 Growing Science Ltd. All rights reserved. doi: 10.5267/j.msl.2012.09.005
Contents lists available at GrowingScience
Management Science Letters
homepage: www.GrowingScience.com/msl
Innate and discretionary accruals quality and corporate governance: A case study of Tehran Stock Exchange
Hossein Panahian, Hassan Ghodrati and Majid Nazari*
Department of Accounting, Islamic Azad University, Kashan Branch, Kashan, Iran
A R T I C L E I N F O A B S T R A C T
Article history: Received June 28, 2012 Received in Revised form August, 26, 2012 Accepted 29 August 2012 Available online 6 September 2012
In this paper, we present an empirical study to find the relationship between discretionary accruals quality as well as innate accruals quality and portion of non-executive board of directors, concentration of ownership ratio and board size in Tehran Stock Exchange. The survey selects 118 qualified stocks from this exchange and using a random technique chooses 42 firms. The study implements two linear regression techniques to estimate the first part of the information and then using structural equation modeling examines six hypotheses. Based on the results of this survey we can conclude that an increase on non-executive members positively influences on discretionary accruals quality and negatively influences innate accruals quality. Concentration of ownership ratio positively influences on discretionary accruals quality and negatively impacts on innate accruals quality. Finally, size of board of directors negatively impacts discretionary accruals quality and positively influences on innate accruals quality.
© 2012 Growing Science Ltd. All rights reserved.
Keywords:
Innate and discretionary accruals quality Corporate governance Tehran Stock Exchange Transparency
1. Introduction
emerging markets. They used the relevant information on firm-level corporate governance (CG) rankings across 14 emerging markets and reported that there was a wide variation in firm-level governance and the average firm-level governance was lower in countries with weaker legal systems. They also detected the determinants of firm-level governance and reported that governance was correlated with the extent of the asymmetric information and contracting imperfections that firms face. Based on their results, better corporate governance was significantly associated with better operating performance and market valuation. They also provided some evidences, where firm-level corporate governance provisions are more important in countries with weak legal environments.
Bauer et al. (2008) investigated the level of disclosure ensured by corporate governance codes in force in European Union member states based on OECD rules and regulations. They performed a comparative study on different existing features of corporate governance in the literature by using econometric analysis based on different statistical tools such as descriptive analysis, mainly based on computing tools, and correlations to detect the relationship between their results and what others researchers achieved. The results of the performed analysis disclosed that their results were not consistent with prior research findings associated with disclosure as “primary theme” of corporate governance codes. By analyzing the results, they have reached to the same conclusion as other researchers did on the same topic. Finally, they reported that we could certify that the compliance of corporate governance codes with OECD principles was consistent with prior research results associated with disclosure considering codes’ issuer type and countries’ legal regime.
Ştefănescu (2011) performed an investigation to find the level of disclosure ensured by corporate governance codes in force in European Union member states. She reported that common law regime could likely ensure the biggest level of transparency through corporate governance needs. They also asserted that the compliance of corporate governance codes with OECD principles was consistent with prior research achievement associated with disclosure considering codes’ issuer type and countries’ legal regime. Ammann et al. (2011) studied the relationship between firm-level corporate governance and firm value based on a dataset from Governance Metrics International (GMI), which includes 6663 firm-year observations from 22 developed countries over the period of 2003-2007. Based on a set of 64 individual governance attributes they built two alternative additive corporate governance indices with equal weights. The corporate governance attributed to the governance attributes and one index derived from a principal component analysis and they reported a strong and positive relation between firm-level corporate governance and firm valuation. Besides, they studied the value associated with governance attributes, which document the companies' social behavior. Their findings were robust against alternative calculation procedures for the corporate governance indices and to alternative estimation techniques.
M. Nazari et al. / Management Science Letters 2 (2012)
3025
In this paper, we present an empirical study to find the relationship between discretionary accruals quality as well as innate accruals quality and portion of non-executive board of directors, concentration of ownership ratio and board size in Tehran Stock Exchange.
2. The proposed study
2.1. Variables
PROIND: Percentage of non-executive members to total number of executive member
CONC: Concentration of ownership ratio, the ratio determines portions of the people who own at least five percent of the shares
DAQ: Discretionary accruals quality IAQ: Innate accruals quality
Board size: The number of people who take part in editorial board
WC
tΔ
The change in working capital in time t compared with previous period t-1CFOt-1 Cash flow in period t-1
CFOt Cash flow in period t
CFOt+1 Cash flow in period t+1
ΔRevt Change in operating revenue for two consecutive period
PPEt Fixed asset in period t
AQ Accruals quality
SIZEt Natural logarithm of total assets in period t
LOSSt The number of years that firm reports loss in its statement
OPCYCt Natural logarithm of mean life cycle of inventory and receivable accounts
SDORt Standard deviation of operating revenue divided by total assets
The main hypothesis of this paper considers whether there is a relationship between concentration of ownership and board of director's characterization with discretionary accruals quality and Innate accruals quality. The proposed study of this paper considers the following six hypotheses,
1. The relationship between the ratio of non-executive members of board of directors and discretionary accruals quality,
2. The relationship between the ratio of non-executive members of board of directors and Innate accruals quality,
3. The relationship between the ratio of size of board of directors and Innate accruals quality, 4. The relationship between the ratio of size of board of directors and discretionary accruals
quality,
5. The relationship between concentration of ownership and Innate accruals quality, 6. The relationship between concentration of ownership and discretionary accruals quality.
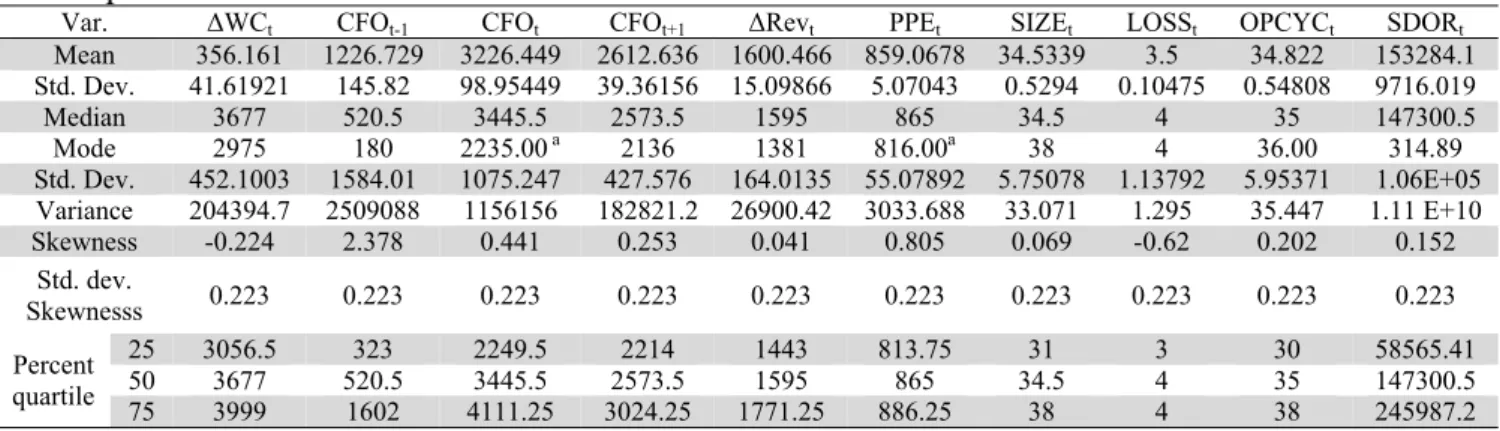
Descriptive information for 42 firms
Var. ΔWCt CFOCFOt-1 CFOt t+1 PPEΔRevt SIZEt LOSSt OPCYCt SDORt t
Mean
356.161 1226.729 3226.449 2612.636 1600.466 859.0678 34.5339 3.5 34.822 153284.1
Std. Dev.
41.61921 145.82 39.3615698.95449 15.09866 5.07043 0.5294 0.10475 0.54808 9716.019
Median
3677 520.5 3445.5 2573.5 1595 865 34.5 4 35 147300.5
Mode
2975 180 2235.00 a 2136 816.001381 a 38 36.004 314.89
Std. Dev. 452.1003 1584.01 1075.247 427.576 164.0135 55.07892 5.75078 1.13792 5.95371 E+05 1.06
Variance
204394.7 2509088 1156156 182821.2 26900.42 3033.688 33.071 1.295 35.447 E+10 1.11
Skewness -0.224 2.378 0.441 0.253 0.041 0.805 0.069 -0.62 0.202 0.152
Std. dev.
Skewnesss 0.2230.223 0.223 0.223 0.223 0.223 0.223 0.223 0.223 0.223
Percent quartile
25
3056.5 323 2249.5 2214 1443 813.75 31 3 30 58565.41
50
3677 520.5 3445.5 2573.5 1595 865 34.5 354 147300.5
75 3999 1602 4111.25 3024.25 1771.25 886.25 38 4 38 245987.2
In order to perform regression analysis for the following two linear regression model we need to verify normality test.
ΔWCt=β0+ β1CFOt-1+ β2CFOt+ β3CFOt+1+ β4 ΔRevt+ β5PPEt+et (1)
AQ=α+ β1SIZEt+ β2LOSSt+ β3OPCYCt+ β4SDORt+et (2)
The first step in performing regression analysis is to make sure that dependent variable is normally distributed and to perform this, we perform Kolmogorov–Smirnov (KS) test and KS value for WCt is
calculated as 0.401. Fig. 1 shows distribution of residuals for regression analysis given in Eq. (1) as follows,
Fig. 1. Distribution of residuals for ΔWCt Fig. 2. Cumulative probability for dependent
variable ΔWCt
Based on the results of KS and Fig. 1 and Fig. 2 we can conclude that data are normally distributed. The other test is to study the correlation among independent variables. Table 2 shows the results of Pearson correlation test for independent variables.
Table 2
The results of Pearson correlation test for Eq. (1)
WCT CFO CFOt-1 t RevCFOt+1 PPE
WCT Pearson test 1
**
0.262
0.695** 0.655** 0.648** 0.446** Level of significance
0.0000.004 0.000 0.000 0.000
CFOt-1
Pearson test
**
0.262
1 0.078 0.057 0.125 0.152
Level of significance
0.004 0.5360.400 0.178 0.100
CFOt
Pearson test
**
0.695 0.078 1 0.938** 0.959** 0.592** Level of significance
0.000 0.400 0.0000.000 0.000
CFOt+1
Pearson test 0.655** 0.057 0.938** 1 0.936** 0.657** Level of significance
0.000 0.536 0.000 0.0000.000
Rev Pearson test
**
0.648 0.125 0.959** 0.936** 1 0.646** Level of significance
0.000 0.178 0.000 0.000 0.000
PPE
Pearson test
**
0.446 0.152 0.592** 0.657** 0.646** 1 Level of significance
0.000 0.100 0.000 0.0000.000
M. Nazari et al. / Management Science Letters 2 (2012)
3027
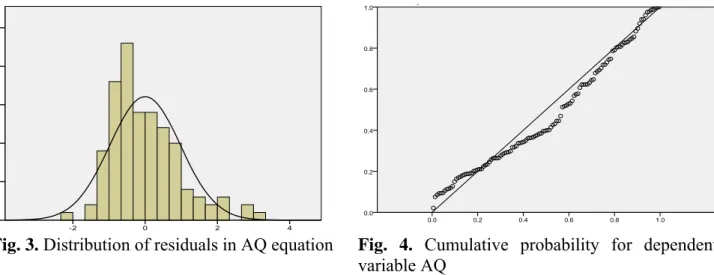
As we can observe from the results of Table 2, there are some strong correlations among independent variables and we need to use stepwise regression analysis. Similarly, we perform Kolmogorov– Smirnov (KS) test and KS value for WCt is calculated as 1.406. Fig. 3 shows distribution of residuals
for regression analysis given in Eq. (2) as follows,
Fig. 3. Distribution of residuals in AQ equation Fig. 4. Cumulative probability for dependent variable AQ
Based on the results of KS and Fig. 3 and Fig. 4 we can conclude that data are normally distributed. The other test is to study the correlation among independent variables. Table 3 shows the results of Pearson correlation test for independent variables.
Table 3
The results of Pearson correlation test for Eq. (2)
Standard SIZEpredicted error LOSSt OPCYCt SDORt t
AQ Pearson test 1
**
0.418
0.016 0.067 0.438**
Level of significance 0.000 0.864** 0.0000.470
SIZEt Pearson test
**
0.418
1 -0.105 0.250** 0.752**
Level of significance 0.000 0.0060.257 0.000
LOSSt Pearson test -0.016 -0.105 1 -0.045 -0.125
Level of significance 0.2570.864 0.1770.630
OPCYC t
Pearson test 0.067 0.250** -0.045 1 0.303**
Level of significance 0.0060.470 0.630 0.001
SDORt Pearson test
**
0.438
0.752** -0.125 0.303** 1
Level of significance 0.0000.000 0.177 0.001
**Results is valid when the level of significance is set to 0.01
Again, we see some strong correlation between some independent variables, which implies that we need to use stepwise regression analysis.
3. The results
In this section, we first present details of our regression analysis for the Eq. (1) and Eq. (2).
3.1. The first model
The results of regression analysis when the dependent variable is WCT (R2= 0.80)
Model Non-standard coefficients Standard coefficients t Error
B Std. dev Beta
1
Intercept 3542.003 773.434 4.580 0.000
CFOt-1
0.066 0.019 0.231 3.490 0.001
CFOt
0.406 0.107 0.966 3.798 0.000
CFOt+1
0.174 0.221 0.164 2.786 0.004
Rev 1.357- 0.700 0.492- 1.938- 0.000
PPE 0.403 0.726 0.049 2.556 0.005
As we can observe from the results of Table 4, all t-student values are valid and the regression covers 91% of the results. The results of regression analysis is summarized as follows,
ΔCt=3542.003+ 0.066CFOt-1+ 0.406CFOt+ 0.174CFOt+1- 1.357ΔRevt+ 0.403 PPEt+773.434 et (3)
Table 5 shows the results of ANOVA test.
Table 5
The results of ANOVA test for Eq. (1)
Model Sum of Least squares df Mean F Level of significance
1
RSS 1.296E7 5 2591266.8 26.485 0.000
ESS 1.096E7 36 97837.93
TSS 1.391E7 41
As we can observe from the results of ANOVA test, the null hypothesis can be rejected when the level of significance is one percent and we can conclude that the first linear regression is valid.
3.2. The second model
The implementation of stepwise linear regression for the second model is summarized in Table 6 as follows,
Table 6
The results of regression analysis when the dependent variable is AQ (R2= 0.81)
Model Non-standard coefficients Standard coefficients t Error
B Std. dev Beta
2
Intercept 89.063 17.082 5.214 0.000
SIZEt 0.752 0.442 0.207 -1.701 0.092
LOSSt 1.319 1.481 0.72 2.515 0.010
OPCYCt 0.757 0.295 0.216 2.561 0.012
SDORt 7.202 0.000 0.364 -2.936 0.004
As we can observe from the results of, except two cases, the other coefficients maintain valid t-student values. Eq. (4) shows details of our findings,
AQ=89.063+0.752SIZEt +1.319LOSSt+ 0.757OPCYCt+ 7.202SDORt+ 17.082et (4)
M. Nazari et al. / Management Science Letters 2 (2012)
3029 Table 7
ANOVA test results for the second model
Model dfSUM of Squares Mean ErrorF
2
RSS 14451.136 5 2890.227 8.836 0.000 ESS
3636635.387 327.102
TSS 51086.523 41
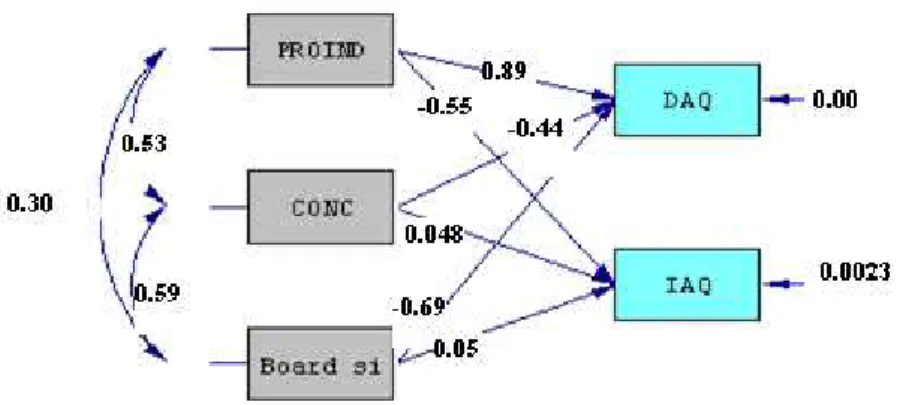
3.3. The impact of PROIND, CONC and BOARD SIZE on DAQ and IAQ
In this section, we perform structural equation modeling (SEM) to determine the effects of three PROIND, CONC and BOARD SIZE on two variables of DAQ and IAQ using LISREL software packages. Fig. 5 shows details of our results for the proposed SEM model,
Fig. 5. The results of SEM model
Based on the results, we can derive the following results,
DAQ = 0.89*PROIND - 0.44*CONC –0.69*Board SIZE Error var. = 0.0012, R² = 0.95 (5) IAQ = -0.55PROIND + 0.048*CONC + 0.05*Board size Error var. = 0.002, R² = 0.93 (6)
In our proposed model, the ratio of Chi-Square on degree of freedom is 1.6<3, NFI is equal to 0.97, NNFI is 0.93, CFI is equal to 0.92, GFI and AGFI are also equal to 0.91 and 0.90, respectively. The results confirm the findings of SEM model. Table 8 shows the summary of our results.
Table 8
The summary of our results for six hypotheses Hypothesis
Path P Value Results
H’1 Proind → DAQ <0.001 Accept
H’2 Proind → IAQ Accept<0.001
H’3 Conc→ DAQ <0.001 Accept
H’4 Conc→ IAQ Accept<0.001
H’5 Board Size→ DAQ <0.001 Accept
H’6 Board Size→ IAQ Accept<0.001
innate accruals quality.
4. Conclusion
In this paper, we have presented an empirical study to find the relationship between discretionary accruals quality as well as innate accruals quality and portion of non-executive board of directors, concentration of ownership ratio and board size in Tehran Stock Exchange. The survey selected 118 qualified stocks from this exchange and using a random technique selected 42 companies. The study used two linear regression techniques to estimate the first part of the information and then using structural equation modeling examined six hypotheses. Based on the results of this survey we can conclude that an increase on non-executive members positively influences on discretionary accruals quality and negatively influences innate accruals quality. Concentration of ownership ratio positively influences on discretionary accruals quality and negatively impacts on innate accruals quality. Finally, size of board of directors negatively impacts discretionary accruals quality and positively influences on innate accruals quality.
Acknowledgment
The authors would like to thank the anonymous referees for constructive comments on earlier version of this paper.
References
Ammann, M., Oesch, D., & Schmid, M. M. (2011). Corporate governance and firm value: International evidence. Journal of Empirical Finance, 18(1), 36-55.
Bauer, R., Frijns, B., Otten, R., & Tourani-Rad, A. (2008). The impact of corporate governance on corporate performance: Evidence from Japan. Pacific-Basin Finance Journal, 16(3), 236-251. Black, B.S., de Carvalho, A.G., & Gorga, É (2012). What matters and for which firms for corporate
governance in emerging markets? Evidence from Brazil (and other BRIK countries). Journal of
Corporate Finance, 18(4), 934-952.
Cohen, J., Krishnamoorthy, G., & Wright, A. (2002). Corporate governance and the audit process.
Contemporary Accounting Research 19, 573–592.
Dechow, P., & Dichev, I. (2002). The quality of accruals and earnings: the role of accruals estimation errors. The Accounting Review, Supplement, 77, 35–59.
Fama, E. F., & Jensen, M. (1983). Separation of ownership and control. Journal of Law and
Economics, 26, 301–325.
Francis, J., LaFond, R., Olsson, P.M., & Schipper, K. (2005). The market pricing of accruals quality.
Journal of Accounting and Economics 39, 295–327.
Gillan, S.L. (2006). Recent developments in corporate governance: An overview. Journal of
Corporate Finance, 12(3), 381-402.
Kent, P., Routledge, J., & Stewart, J. (2010). Innate and discretionary accruals quality and corporate governance. Accounting and Finance, 50, 171-195.
Klapper, L.F., & Love, I. (2004). Corporate governance, investor protection, and performance in emerging markets. Journal of Corporate Finance, 10(5), 703-728.
Jensen, M.C., & Meckling, W.H. (1976). Theory of the firm: managerial behavior, agency costs and ownership structure. Journal of Financial Economics, 3(40), 305-360.
Nelson, J. (2005). Corporate governance practices, CEO characteristics and firm performance.
Journal of Corporate Finance, 11(1-2). 197-228.