*Corresponding author.
E-mail address: mr.maranjory@gmail.com (M. Maranjory) © 2013 Growing Science Ltd. All rights reserved. doi: 10.5267/j.msl.2013.08.028
Contents lists available at GrowingScience
Management Science Letters
homepage: www.GrowingScience.com/msl
The role of discretionary accruals in earnings management: Evidence from Tehran Stock Exchange
Mehdi Maranjorya*, Razieh Alikhania, Abdullah Zabihzadehb and Petro Sepehric
aDepartment of Accounting, Chalous Branch, Islamic Azad University (IAU), Chalous, Iran bDepartment of Accounting, Shomal Branch, Amol, Iran
cDepartment of Accounting, Astara Branch, Islamic Azad University (IAU), Astara, Iran C H R O N I C L E A B S T R A C T
Article history: Received May 12, 2013 Received in revised format 12 August 2013
Accepted 18 August 2013 Available online August 19 2013
Earnings management via discretionary accruals is a manager's instrument for changing stock holders’ expectations. The purpose of this study is to investigate the role of discretionary accruals in the earnings management of Iranian firms. There are two hypotheses associated with this study on the relationship between income smoothness and discretionary accruals and the proposed study is implemented on selected firms from Tehran Stock Exchange. The result of the first hypothesis indicates the relationship between earnings smoothness and discretionary accruals variables. It means that discretionary accruals (DA) leads to the converse relationship among discretionary accruals variation and current and future cash flow. The result of the second hypothesis indicates that the firms with high variation in Iran utilize more discretionary accruals compared with the firms with lower variation.
© 2013 Growing Science Ltd. All rights reserved. Keywords:
Earnings management Discretionary accruals Tehran Stock Exchange
1. Introduction
kind of method to transfer the accruals to future periods in order to adjust current earnings, increase future earnings, and negatively report discretionary accruals in the current year. In converse, if the firm is smoothing and its earnings without discretionary accruals is less than income of the previous year, it will be expected that the discretionary accruals in the current year to be positive. In addition, it is also expected that higher level smoothing firms demonstrate their purpose via reporting their discretionary accruals. On this basis, the theoretical foundation for the research hypothesis has been provided.
2. Literature Review
Teoh et al. (1998) revealed that discretionary accruals are considerably high in the year when a firm offers its stock for the first time (IPO), and it is negatively concerned with the future net income and operational cash flow. They conducted a research to focus stock price after initial public offerings in the subsequent years and concluded that discretionary accruals and operation were negatively related. On the other hand, they found out that the firms positively reporting discretionary accruals after IPO had low prices. It means that those firms, which were not able to have their predicted expected earnings before IPO during the next three years would make use of discretionary accruals after IPO. This requires the reduction of price after it is revealed.
Subramanyam (1996) claimed that market connects the value of the firm with discretionary accruals to predict discretionary accruals, future earnings and variation in stock income. Teoh et al. (1998) pointed out that IPO smoothing firms manage their earnings via discretionary accruals. In fact, there is a significant converse relationship among the discretionary accruals, future net, and cash flow variations. Based on their findings, the discretionary accruals were in a high rank in the year when the firm offered its stock for the first time; and the accruals had negative relationship with future net income and operational cash flows. Conducting a research on the stock price from operation in the years after the initial public offerings, Sloan (1996) found out that earnings continuity in a firm depends on the relative importance of its cash components and earnings accrual. If investors cannot differentiate these two components of accounting income, they will definitely make a mistake. In this experiment, when he found out that stock prices were not totally under the impact of discretionary accruals or cash flow and investors are not capable of analyzing its effects on stock price, his idea regarding the reduction of earnings continuity due to increase in discretionary accruals and increase due to cash flow increase, was rejected. Chan et al. (2001) conducted a research on the relationship between discretionary accruals and future stock return. The results showed that stock return in the firms having higher discretionary accruals was reduced in the period after reporting current period. It means that having qualified with lower earnings, firms receive low return.
Kenan (2001) reported that the more earnings is close to cash flow, the less the discretionary accruals. As a result, the earnings will be highly-qualified. Therefore, the return of the future period will be more. If the quality of the earnings is lower, the future stock return will also be less, however. Dechow et al. (1995) found out that nondiscretionary accruals are fixed and they are not supposed to be used for smoothing earnings. Additionally, earnings managements occur due to discretionary accruals. Barton and Simko (2002) pointed out that earnings management in the subsequent periods depends on the type and amount of discretionary accruals which has been used in preceding years, since the effect of discretionary accruals dates back to the past. Gosh and Olsen (2009) conducted a research showing that the managers make use of discretionary accruals for reducing earnings frequency.
3. Research Hypothesis and Models Analysis for the Tests
H1. Initial public offerings (IPO) are more concerned with reporting discretionary accruals and these
M. Maranjory et al. / Management Science Letters 3 (2013)
2401
H2. Initial public offerings (IPO) are more concerned with reporting discretionary accruals and these
accruals have a direct relationship with variance ratio (after considering the difference between current and preceding year's earnings). For testing the first and second hypothesis of the research and in order to study the relationship between smoothness using discretionary accruals, the following model has been provided.
DAit = β0 + β1 Fi + β2 ln ( VRi )+ β3 ( Fi × ln ( VRi )) + eit (1)
In Eq. (1), Fi is a dummy variable and it is one when cache flow from operation and discretionary
accruals is higher than end of the year earnings, and zero, otherwise. In this model, DA (discretionary
accruals) is calculated as follows:
DAit = TAit - NDAit, (2)
where TAitis total accruals and NDAit is non-discretionary accruals, TAit is calculated as follows:
TA=NIit - CFit, (3)
where NIit shows net income in the third year and CFit is cash flow from operation in the third year
of the firm function. Non-discretionary accruals will be calculated as follows:
1 2 3
, , 1 , 1 , 1
1
it it it
j j j
i t i t i t i t
TA SALES GPPE
b b b
ASSETS ASSETS ASSETS ASSETS
(4)
1 2 3
, 1 , 1 , 1
1 it it
it j j j
i t i t i t
SALES GPPE NDA
ASSETS ASSETS ASSETS
(5)
The coefficients of β1j, β2j and β3j are obtained based on regression techniques. In order to explain the
above mentioned coefficients in Hypothesis 1, it should be mentioned that if IPO needs to positively
employ income smoothness, that is, current earning is less than annual earning, Fi = 0 and the
coefficients of β1, β3 should be positive. Conversely, if IPO needs to negatively employ income
smoothness, that is, current earning is more than annual earning of the preceding year, Fi = 1and the
coefficients of β1 and β2 should be negative; and their absolute ratio need to be more than β1and β2.
The regression coefficient obtained in Hypothesis 2 will be interpreted as follows: if β2 is negative
and β3 is positive, it shows that, in smoothing firms, discretionary accruals are in the same direction
as income smoothness.
4. Research Method
This study is an archival research. Panel Data method is employed as technique to estimate the relationship between Discretionary Accruals with Earnings Management. Sample used in this research includes financial data for 51 firms listed in the Tehran Stock Exchange over the period 2006-2010. Each company had to meet specific criteria to be included in the sample:
1. They must close their fiscal year on mid-March (end of Persian calendar).
2. They must have full financial data for the whole period of investigation.
The data needed for analysis are collected from the database associated with the Islamic Research Management Center of the Tehran Exchange Market.
5. Data Analysis Methods
In order to test and analyze the hypotheses, Multiple Variation Regression Analysis was used and the
into High and Low Smoothing Firms. To do so, first, the ratio of operational activities variance to the net income variance (which is called VRi) was calculated. Then, based on the median, High and Low Smoothing Firms were classified.
( ) , ( ) it it it Var CF VR Var NI (6)
where VRi Ratio (variance ratio) is an index used to distinguish smoothing firms from non-smoothing
firms by using the central tendency of median; and the numbers above the median were classified as High Smoothing Firms and the numbers under the median as Low Smoothing Firms. It should be mentioned that Smoothing Index was three years after initial public offerings. In the above mentioned equation, Var(CFit) is cash flow variance from operation and Var (NIit) is net income variance.
6. Research Findings
The result of hypothesis 1:
The following regression model has been used in order to respond to the first hypothesis. Table 1 illustrates the results:
i i i 3 i 2 i 1 0
i F LN(VR ) (F *LN(VR )) e
DA β β β β
Table 1
The results of ANOVA test
Sig F R2 Mean Square df Sum Squares Model 0.000 14.994 0.484 2.096 3 6.289 Regression 0.140 48 6.711 Residual 51 13.000 Total
The first hypothesis shows the relationship between income smoothness and discretionary accruals. In order to test this hypothesis, the null hypothesis and hypothesis 1, will be defined as follows:
H0: There is no significant relationship between income smoothness and discretionary accruals.
H1: There is a significant relationship between income smoothness and discretionary accruals.
0 : H 0 : H 1 0
As it was indicated in Table 1, the regression is significant. Regarding the amount of R², (0.484) and
the results of variance analysis and obtained F (14.994) and the significance value (0.000), it can be
concluded that statistically error variance is significantly less than 0.01 and the regression is reliable. As a result, smoothness has a direct relationship with discretionary accruals and, in turn, these accruals are conversely related to the differences between current year earnings and preceding year
earnings. In Table 1, the coefficient specification of R² shows that the variable of LNVRi explains
approximately 48 percent of the dependent variables and the remaining 52 percent are explained by the factors other than LNVRi.
Table 2
Regression Coefficient Predicting Discretionary Accruals
M. Maranjory et al. / Management Science Letters 3 (2013)
2403
Table 2 demonstrates that the T statistics places in the critical area. The null hypothesis with the
probability of 95% is rejected. The sig value also indicates that the null hypothesis with 95% reliability is rejected. As a result, hypothesis 1 is accepted, and as a result, there is a significant relationship between income smoothness and discretionary accruals in Tehran stock firms. Table 2 also shows that among the dependent variables used in this model, only the interference of LN(VRi) in regression model is significant, but the other variables with 95% reliability are not significant.
The Results of Hypothesis 2
In order to respond to the second hypothesis in this study, the following regression model has been used. The results are shown in Table 3.
i i i 3 i 2 i 1 0
i
F
LN
(
VR
)
(
F
LN
(
VR
)
)
e
DA
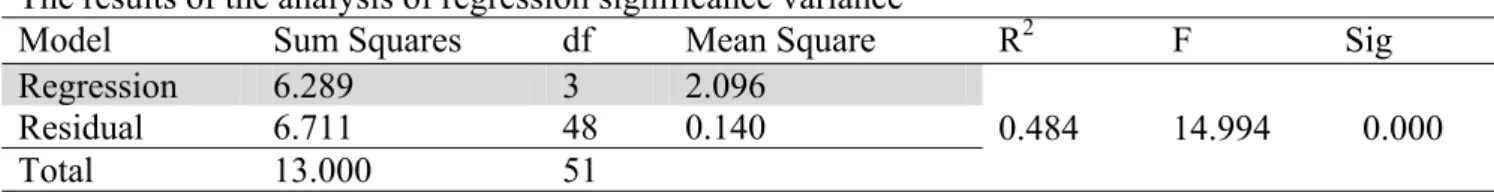
Table 3
The results of the analysis of regression significance variance
Sig F R2 Mean Square df Sum Squares Model 0.000 14.994 0.484 2.096 3 6.289 Regression 0.140 48 6.711 Residual 51 13.000 Total
The second hypothesis studies the relationship between income smoothness and discretionary accruals. To test this hypothesis, the null hypothesis and hypothesis 1 will be defined as follows:
H0: There is no relationship between income smoothness and discretionary accruals.
H1: There is a relationship between income smoothness and discretionary accruals. H : 0
0 : H 1 0
In other words, as it is shown in Table 3, the sig value is 0.000 which shows that p < 0.05. It indicates that the null hypothesis claiming that there is no relationship between income smoothness and
discretionary accruals is rejected. Therefore, H1 claiming that there was a relationship between
income smoothness and discretionary accruals is accepted. Accordingly, there was statistically a
significant relationship between income smoothness and discretionary accruals, F(3, 48) =14.994, p =
0.000, R² = 0.484. Because p < 0.05, and regression is reliable, so it can be concluded that, there is a
relationship between income smoothness and discretionary accruals. It means that discretionary
accruals (DAi) has a direct relationship with the ratio of variance (VRi). As a result, High variation
firms make more use of discretionary accruals compared to Low discretionary accruals. R²
demonstrates that LNVRi variable explains approximately about 48% of the dependent variables; and the remaining 52% are explained by the factors other than LNVRi.
Table 4
Regression coefficient predicting discretionary accruals
Sig T Beta Std.Error B Model 0.365 0.908 -16573.930 15043.757 Constant 0.453 -0.752 -0.05 23194.160 -17447.295 Fi 0.001 -3.300 -0.237 8589.718 -28600.087 LNVRi 0.043 2.035 0.153 15679.110 31903.953 Fi LN(VRi)
In this paper, we have presented an empirical investigation to study how well it is possible to manage earnings via discretionary and nondiscretionary accruals. The study of volume and size of discretionary accruals could be led to the finding of income smoothness and its amount in IPO. Thus, discretionary accruals (DA) and variation ratio (VA) were directly related, that is, high variation firms made use of discretionary accruals compared to Low variation firms.
The first hypothesis (H1) showed the relationship between the income smoothness and discretionary
accruals, that is in IPO, discretionary accruals required the converse relationship among discretionary accruals, cash flow, and future earnings variables. Therefore, in IPO, discretionary accruals were positive, showed that this number had converse relationship with the current year earnings and preceding year earnings differences. Thus it was expected that there should also be a converse relationship between cash flow from operation and discretionary accruals. The results of this study were in line with the findings of Teoh et al. (1998) and Dechow et al. (1995).
The second test, which had been run on the second Hypothesis (H2) demonstrated that there was a direct relationship between discretionary accruals (DAi) and Variance ratio (VRi). It indicated that High variation firms compared with Low variation firms, made more use of discretionary accruals. As a result, in IPO discretionary accruals were positive and showed direct relationship with variation ratio (VRi). The findings of this hypothesis were in line with Teoh et al. (1995) and Dechow et al (1995).
References
Barton, J., & Simko, P. J. (2002). The balance sheet as an earnings management constraint. The
Accounting Review, 77(s-1), 1-27.
Chan, K., Chan, L. K., Jegadeesh, N., & Lakonishok, J. (2001). Earnings quality and stock
returns (No. w8308). National Bureau of Economic Research.
Dechow, P. M., Sloan, R. G., & Sweeney, A. P. (1995). Detecting earnings management. Accounting
Review, 70, 193-225.
Dechow, P. M., Sloan, R. G., & Sweeney, A. P. (1996). Causes and consequences of earnings
manipulation: An analysis of firms subject to enforcement actions by the sec. Contemporary
accounting research, 13(1), 1-36.
Ghosh, D., & Olsen, L. (2009). Environmental uncertainty and managers’ use of discretionary
accruals. Accounting, Organizations and Society, 34(2), 188-205.
Teoh, S. H., Welch, I., & Wong, T. J. (1998). Earnings management and the long‐run market
performance of initial public offerings. The Journal of Finance,53(6), 1935-1974.
Kenan. C. (2001). Earning quality and stock Return, working paper, National Taiwan university
Department of Finance.
Sloan, R. G. (1996). Do stock prices fully reflect information in accruals and cash flows about future
earnings?. Accounting Review, 71(3), 289-315.
Subramanyam, K. R. (1996). The pricing of discretionary accruals. Journal of accounting and