TCD
6, 3667–3702, 2012An updated and quality controlled surface mass balance dataset for Antarctica
V. Favier et al.
Title Page
Abstract Introduction
Conclusions References
Tables Figures
◭ ◮
◭ ◮
Back Close
Full Screen / Esc
Printer-friendly Version
Interactive Discussion
Discussion
P
a
per
|
Dis
cussion
P
a
per
|
Discussion
P
a
per
|
Discussio
n
P
a
per
|
The Cryosphere Discuss., 6, 3667–3702, 2012 www.the-cryosphere-discuss.net/6/3667/2012/ doi:10.5194/tcd-6-3667-2012
© Author(s) 2012. CC Attribution 3.0 License.
The Cryosphere Discussions
This discussion paper is/has been under review for the journal The Cryosphere (TC). Please refer to the corresponding final paper in TC if available.
An updated and quality controlled surface
mass balance dataset for Antarctica
V. Favier1, C. Agosta1, S. Parouty1, G. Durand1, G. Delaygue1, H. Gall ´ee1, A.-S. Drouet1, A. Trouvilliez1,2, and G. Krinner1
1
UJF-CNRS, Laboratoire de Glaciologie et G ´eophysique de l’Environnement (LGGE), UMR 5183, 54 rue Moli `ere, BP 96, 38402 Saint Martin d’ H `eres, France
2
IRSTEA, UR ETGR Erosion Torrentielle Neige Avalanches, Domaine universitaire, 2, rue de la Papeterie, 38402 Saint-Martin-d’H `eres, France
Received: 31 July 2012 – Accepted: 1 August 2012 – Published: 3 September 2012
Correspondence to: V. Favier ([email protected])
TCD
6, 3667–3702, 2012An updated and quality controlled surface mass balance dataset for Antarctica
V. Favier et al.
Title Page
Abstract Introduction
Conclusions References
Tables Figures
◭ ◮
◭ ◮
Back Close
Full Screen / Esc
Printer-friendly Version
Interactive Discussion
Discussion
P
a
per
|
Dis
cussion
P
a
per
|
Discussion
P
a
per
|
Discussio
n
P
a
per
Abstract
We present an updated and quality controlled surface mass balance (SMB) database for the Antarctic ice sheet. We retrieved a total of 5284 SMB data documented with important meta-data, to which a filter was applied to discard data with limited spatial and temporal representativeness, too small measurement accuracy, or lack of
qual-5
ity control. A total of 3438 reliable data was obtained, which is about four times more than by applying the same data filtering process to previously available databases. New important data with high spatial resolution are now available over long traverses, and at low elevation in some areas. However, the quality control led to a consider-able reduction in the spatial density of data in several regions, particularly over West
10
Antarctica. Over interior plateaus, where the SMB is low, the spatial density of mea-surements remained high. This quality controlled dataset was compared to results from ERA-Interim reanalysis to assess model representativeness over Antarctica, and also to identify large areas where data gaps impede model validation. Except for very few areas (e.g. Adelie Land), the elevation range between 200 m and 1000 m a.s.l. is not
15
correctly sampled in the field, and measurements do not allow a thorough validation of models in regions with complex topography, where the highest scattering of SMB values is reported. Clearly, increasing the spatial density of field measurements at low elevations, in the Antarctic Peninsula and in West Antarctica remains a scientific prior-ity.
20
1 Introduction
In the context of global warming, particular attention is being paid to the mass balance of the Antarctic ice sheet (AIS) and its impact on sea level rise (Lemke et al., 2007). A recent study by Rignot et al. (2011) suggests that the Antarctic surface mass bal-ance (SMB) decreased in the last decade, contributing 5.5±2 Gt yr−2to sea level rise
25
TCD
6, 3667–3702, 2012An updated and quality controlled surface mass balance dataset for Antarctica
V. Favier et al.
Title Page
Abstract Introduction
Conclusions References
Tables Figures
◭ ◮
◭ ◮
Back Close
Full Screen / Esc
Printer-friendly Version
Interactive Discussion
Discussion
P
a
per
|
Dis
cussion
P
a
per
|
Discussion
P
a
per
|
Discussio
n
P
a
per
|
the uncertainty of SMB measurements and interpretations. For instance, other studies (e.g. Monaghan et al., 2006b) suggested that precipitation over Antarctica has been stable since the 1950s. While on the other hand, a slight increase in surface elevation has been observed in the interior of the continent, suggesting a recent mass gain (e.g. Helsen et al., 2008). These contradictions underline the lack of reliable information
5
concerning the Antarctic SMB and its recent variations.
Even though several techniques have been developed to assess the SMB in the field (see Eisen et al., 2009, for a review), direct SMB measurements are rare in Antarc-tica and those that exist are generally local (e.g. stake and ice core measurements). The size and remoteness of the AIS and the harsh climatic conditions make long-term
10
measurements difficult. All the available data have only been compiled once previ-ously by Vaughan and Russel (1997). This Antarctica database (hereafter referred to as V99) was described in detail by Vaughan et al. (1999). With 1860 field data, the V99 database legitimately became a reference for climate studies in Antarctica and was regularly used for model validation (e.g. Van de Berg et al., 2006; Krinner et al., 2007,
15
2008; Lenaerts et al., 2012). However, only partial updates have been undertaken since 1999 (e.g. Magand et al., 2007; Van de Berg et al., 2006; Lenaerts et al., 2012), even if important new datasets have been compiled since 1999. For instance, during the last international polar year 2007–2008 (IPY), several inland traverses were performed with a range of scientific goals, including filling the gaps in SMB measurements.
20
Based on the V99 database, several authors interpolated the SMB data to the whole AIS. The current surface accumulation value integrated over the grounded ice-sheet is generally assumed to range between 143 mm w.e. a−1 (Arthern et al., 2006) and
168 mm w.e. a−1 (Van de Berg et al., 2006). These two studies are generally consid-ered to be the most reliable because computations included interpolation methods to
25
TCD
6, 3667–3702, 2012An updated and quality controlled surface mass balance dataset for Antarctica
V. Favier et al.
Title Page
Abstract Introduction
Conclusions References
Tables Figures
◭ ◮
◭ ◮
Back Close
Full Screen / Esc
Printer-friendly Version
Interactive Discussion
Discussion
P
a
per
|
Dis
cussion
P
a
per
|
Discussion
P
a
per
|
Discussio
n
P
a
per
Antarctic SMB, particularly limited or unwarranted spatial and temporal coverage and measurement inaccuracy (Magand et al., 2007). Biased surface measurements can strongly affect the final estimation of the SMB for the whole of Antarctica (e.g. Genthon et al., 2009; Lenaerts et al., 2012). Such a bias was observed by Verfaillie et al. (2012) who identified a serious discrepancy between the SMB of Arthern et al. (2006) and
5
recently updated SMB estimates for Adelie Land.
Here, we present an updated SMB database for Antarctica. An important part of the work was documentation of so-called “meta-data” (e.g. time coverage, measure-ment methods, altitude), which is required when using data, especially to check the quality of the SMB values. Next, in Sect. 2, we present the updated database, and
10
we describe the improvements in spatial coverage and compare the data with the V99 dataset (Sect. 2.2). A quality control was conducted by rejecting all unreliable data (Sect. 2.3). The impact of this quality control on the spatial distribution of reliable data over Antarctica is discussed in Sect. 2.4. In Sect. 3, we compare the data with ERA-Interim reanalysis, and show the importance of the selected data for climate model
15
validation. The comparison highlights the remaining gaps in the spatial coverage of surface mass balance data in Antarctica and biases that can occur when interpolating these data. Finally, in Sect. 4, we discuss the main gaps in the SMB database and suggest ways to achieve a better estimate of the Antarctic SMB.
2 The new “SAMBA-LGGE” SMB database
20
2.1 Definitions
The surface mass balance (or net accumulation of snow/ice; hereafter referred to as SMB) can be expressed as the balance between the accumulation and ablation terms as follows:
SMB=PS+PL−E−S−R (in mm w.e. a−1) (1)
TCD
6, 3667–3702, 2012An updated and quality controlled surface mass balance dataset for Antarctica
V. Favier et al.
Title Page
Abstract Introduction
Conclusions References
Tables Figures
◭ ◮
◭ ◮
Back Close
Full Screen / Esc
Printer-friendly Version
Interactive Discussion
Discussion
P
a
per
|
Dis
cussion
P
a
per
|
Discussion
P
a
per
|
Discussio
n
P
a
per
|
wherePS,PL,E,SandRare solid precipitation, liquid precipitation, erosion by the wind, sublimation and runoff, respectively. IfEis negative at some place, it represents drifting snow deposition. Hence, SMB is the result of the competition between accumulation and ablation terms. Knowing the values of erosion or deposition is crucial in windy areas where these processes lead to extremely high spatial variability of SMB values.
5
For instance, in the coastal area of Adelie Land, the SMB may change from negative to highly positive values within a distance of one or two kilometers (Agosta et al., 2012).
2.2 The fully updated database
Because the international polar year (IPY) recently provided a large amount of new SMB data, an update of existing SMB compilation is now timely. We consequently
10
updated the V99 database by including the large amount of new SMB data obtained since 1999 (Fig. 1a). Important new information was obtained during the European EPICA and international TASTE-IDEA (Trans-Antarctic Scientific Traverse Expeditions – Ice Divide of East Antarctica) programs, when isolated measurements and traverses were performed, including in Dronning Maud Land (e.g. Rotschky et al., 2007), from
15
Ross Sea to Talos Dome (French–Italian contribution to ITASE, Frezzotti et al., 2004). Measurements were also taken along the French traverse to Dome C (Agosta et al., 2012; Verfaillie et al., 2012), and from South Pole to Dronning Maud Land (Ansch ¨utz et al., 2009). A large new dataset was acquired from Zhongshan station to Dome A by the Chinese Antarctic research center (Ding et al., 2011). Traverses have also been
20
revisited, including the Japanese traverse from Syowa (also spelled Showa) to Dome Fuji (e.g. Motoyama and Fujii, 1999; Motoyama, personal communication), resulting in a major update of SMB data from Fujiwara and Endo (1971). The SMB measurements for the Syowa to Dome Fuji traverse in the V99 database were not located exactly as described by Motoyama and Fujii (1999). We chose to not include this part of the
25
TCD
6, 3667–3702, 2012An updated and quality controlled surface mass balance dataset for Antarctica
V. Favier et al.
Title Page
Abstract Introduction
Conclusions References
Tables Figures
◭ ◮
◭ ◮
Back Close
Full Screen / Esc
Printer-friendly Version
Interactive Discussion
Discussion
P
a
per
|
Dis
cussion
P
a
per
|
Discussion
P
a
per
|
Discussio
n
P
a
per
was believed to be more accurate than previous information. Finally, we also present unpublished stake data from the coast to Princess Elizabeth station resulting from col-laboration between the Belgian Antarctic expeditions and the French Polar Institute (IPEV) in the framework of the GLACIOCLIM observatory.
In addition to SMB values, information is also provided that is essential for a
qual-5
ity control, i.e. location, methodology, altitude, local mean temperature, distance to the coast, dates of measurements, SMB units in the primary data sources, time period covered by the SMB values, and primary data sources. This primary information was retrieved for both new data and for previous V99 data, which enabled the correction of several data. For instance, correction of longitude for measurements on Siple Coast
10
was possible, thanks to the primary publication (Bindschadler et al., 1988). In some cases, if measurements were a short distance apart (within approx. 20×20 km), the
V99 database only gives their averaged values. Instead, we documented each data point. This was mainly the case at the South Pole and along traverses around Lam-bert Glacier, in Wilkes Land and from Syoma to Dome Fuji (Table 1). This increases
15
the number of available measurements by 1973 (even though data did exist in the V99 database, it was at a lower spatial resolution). Of these 1973 data, 719 from around Lambert Glacier and from Syowa to Dome A were updated using new mea-surements made since 1999. So we now have a more accurate description of small scale SMB spatial variability. We also added crucial information to interpret the data,
20
for instance the snow density used for SMB calculation when the data were not ex-pressed in mm w.e. a−1(several data were originally presented in cm of ice per year). Other specific characteristics were also added, for instance, the presence of blue ice or of megadunes.
Retrieving the primary information was complex because all the information is not
25
TCD
6, 3667–3702, 2012An updated and quality controlled surface mass balance dataset for Antarctica
V. Favier et al.
Title Page
Abstract Introduction
Conclusions References
Tables Figures
◭ ◮
◭ ◮
Back Close
Full Screen / Esc
Printer-friendly Version
Interactive Discussion
Discussion
P
a
per
|
Dis
cussion
P
a
per
|
Discussion
P
a
per
|
Discussio
n
P
a
per
|
Finally, when different time periods were available for a single location (for instance, when several layers were reliably dated in ice cores), SMB estimates are given for each period.
This involved compiling and documenting more than 5539 SMB data distributed over the whole continent (Fig. 1a). Following Magand et al. (2007), we rejected data that
5
did not correspond to measurements of annual SMB. This was the case of 255 data provided by Bull (1971) which were interpolated values from a SMB map. Moreover, as pointed out by Vaughan and Russell (1997), Bull’s (1971) SMB map contains no information on references or data sources. We rapidly investigated Bull’s (1971) data between Dome Fuji and South Pole and concluded that they are probably deduced
10
from a single traverse undertaken in the area before 1971 (Fujiwara and Endo, 1971). However, according to the latter publication, these data are from stakes measured twice in less than one year, suggesting that they are not reliable, which also justified our rejection of Bull’s (1971) digitalized data.
The full updated surface mass balance of Antarctica (SAMBA-LGGE) database
15
now contains 5284 data (Table 2). This database is fully and freely available on the GLACIOLIM-SAMBA Observatory website: http://www-lgge.ujf-grenoble.fr/ ServiceObs/SiteWebAntarc/database.html.
2.3 A reliable dataset extracted from our database
A first update and improvement of the V99 database was performed by Magand
20
et al. (2007), who focused on a limited part of Antarctica (90◦–180◦East Antarctic
sector). These authors applied a quality control to SMB estimates based on objec-tive criteria of reliability, as initially suggested by Bull (1971). We applied the quality rating based on measurement techniques provided by Magand et al. (2007). We do not discuss the quality and reliability of the method here because this has already
25
TCD
6, 3667–3702, 2012An updated and quality controlled surface mass balance dataset for Antarctica
V. Favier et al.
Title Page
Abstract Introduction
Conclusions References
Tables Figures
◭ ◮
◭ ◮
Back Close
Full Screen / Esc
Printer-friendly Version
Interactive Discussion
Discussion
P
a
per
|
Dis
cussion
P
a
per
|
Discussion
P
a
per
|
Discussio
n
P
a
per
Techniques judged to be less reliable are provisionally accepted and rated “B”, while those deemed unreliable are rated “C” (Table 3). Like Magand et al. (2007), we also rejected data when information that was crucial for the quality control was missing, i.e. location, SMB value and unit, method and period covered (for stake data).
Results rated “A” form a new dataset of 3438 very reliable SMB values (Table 2,
5
Fig. 1b). This is about four times more than the 745 reliable data obtained by Lenaerts et al. (2012), who conducted a similar quality control on the V99 database. Since our aim was to retrieve a high quality dataset, our data filtering may be too restrictive. Note that the fully documented database is available on the GLACIOCLIM-SAMBA website, so that any other control can be applied to the data.
10
2.4 Analysis of the reliable dataset
The impact of the quality control on the distribution of available data over Antarctica was tested by comparing the full database with the reliable dataset (data rated “A”, Table 2). The quality control led us to remove data from large areas (Fig. 1b), mainly in West Antarctica. For instance, no measurements are available for a large area between
15
Marie Byrd Land and the coast. This is particularly important because modelswere ini-tially suspected to have common positive biases (i.e. overestimated SMB) comparedto surface accumulation compilations (Genthon and Krinner, 2001; Van de Berg et al., 2006). Since data are not reliable, it is difficultto know whether the models are cor-rect or not for this area. Data availability is also particularly poor for the region from
20
the Filchner-Ronne ice shelf to the South Pole, and for Pine Island glacier catchment, which was the site of considerable research in the past but where SMB values were usually obtained through snow stratigraphy studies (e.g. Pirrit and Doumani, 1961; Shimizu, 1964). Stratigraphy data are generally assumed to be ambiguous because precipitation is low, presents high annual variability, and is affected by strong surface
25
TCD
6, 3667–3702, 2012An updated and quality controlled surface mass balance dataset for Antarctica
V. Favier et al.
Title Page
Abstract Introduction
Conclusions References
Tables Figures
◭ ◮
◭ ◮
Back Close
Full Screen / Esc
Printer-friendly Version
Interactive Discussion
Discussion
P
a
per
|
Dis
cussion
P
a
per
|
Discussion
P
a
per
|
Discussio
n
P
a
per
|
digitalized maps (e.g. Bull, 1971) or from snow stratigraphy studies (Brecher, 1964). Finally, the quality control resulted in a huge reduction in available SMB values at Siple Coast and on Ross ice-shelf because the data were mainly stake measurements made over a period of only one year (Bindschadler et al., 1988; Thomas et al., 1984). Be-cause inter-annual variability of snow accumulation is large in Antarctica, a one year
5
SMB estimate cannot be representative of the mean local SMB, and more than a 3-yr average SMB (Magand et al., 2007) is required to obtain an accurate estimate. How-ever, this data gap is not as serious because snow accumulation on the Ross Ice Shelf does not affect the grounded ice SMB so that changes in accumulation in this area do not directly affect sea level rise. Nevertheless, surveying possible future melting over
10
the ice shelf is an important scientific concern and obtaining SMB data there is indis-pensable. The proximity of the main Antarctic station (Mac Murdo station) is an ideal opportunity to plan future studies since it is the departure point for scientific research on the ice shelf.
The removal of suspicious data considerably modified the spatial distribution of the
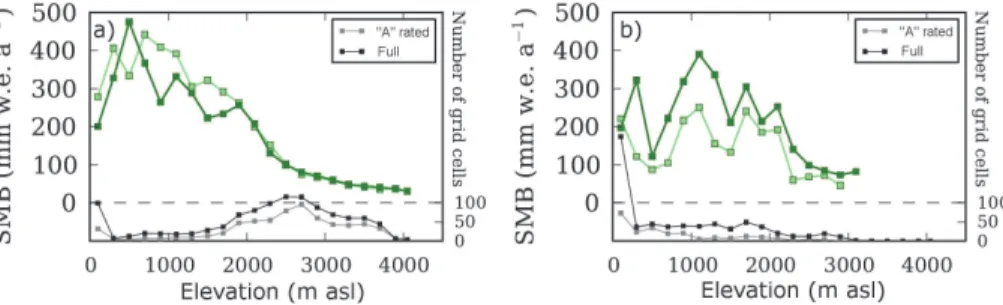
15
SMB. For instance, we computed the mean SMB as a function of elevation over Antarc-tica before and after the quality control process. There was a significant difference between 200 m a.s.l. and 2000 m a.s.l. over East Antarctica (Fig. 2a), because few observations are made in this elevation range and removing incorrect data thus had a significant impact on the mean SMB. There was a significant difference at every
ele-20
vation over West Antarctica (Fig. 2b) because the number of unreliable observations is high for all elevation ranges on this side of the continent. The mean SMB of areas with field measurements (Table 4, see values in italics) over Antarctica differed significantly before (159 mm w.e. a−1) and after the quality control (144 mm w.e. a−1), and the diff er-ence was even higher in West Antarctica (244 versus 159 mm w.e. a−1) than in East
25
Antarctica.
TCD
6, 3667–3702, 2012An updated and quality controlled surface mass balance dataset for Antarctica
V. Favier et al.
Title Page
Abstract Introduction
Conclusions References
Tables Figures
◭ ◮
◭ ◮
Back Close
Full Screen / Esc
Printer-friendly Version
Interactive Discussion
Discussion
P
a
per
|
Dis
cussion
P
a
per
|
Discussion
P
a
per
|
Discussio
n
P
a
per
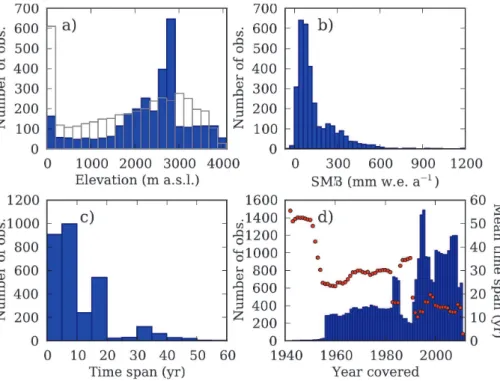
progressively (between 1800 and 4000 m a.s.l.), as the SMB is very low over interior plateaus. The frequency distribution of surface elevation for the entire continent or for only the observation points differs (Fig. 4a), which means that the observations are not equally distributed as a function of altitude. Indeed, the frequency of surface elevations in Antarctica peaks at around 0 m a.s.l. (ice shelves) and at 3200 m a.s.l., with a very
5
broad maximum between 1800 m a.s.l. and 3400 m a.s.l., whereas a narrow maximum appears at 2800 m a.s.l. in the case of SMB measurements. Although new data at low elevation were added to this dataset, low elevation areas are not sufficiently docu-mented, considering their contribution to the total SMB and to the high spatial variability of their SMB. There is still insufficient available data and measurements were mainly
10
made in East Antarctica. The low density of field measurements is a serious obstacle to accurately assessing the Antarctic SMB (e.g. Van de Berg et al., 2006).
Each SMB value was measured over a different period of time. Ninety percent of the periods covered less than 20 yr and 43 % less than 5 yr (Fig. 4c, d). The period the data covered is closely related to the methods used to estimate the SMB. Dating
15
of known horizons in cores or snow pits (volcanic eruptions, nuclear tests) is accurate and provides good estimates of the SMB over long periods (15 to 60 yr). But these observations are isolated because they are difficult to perform at a high spatial density. On the other hand, stake measurements are very useful because they are generally made at a high spatial density, which allows correct sampling of the actual SMB
distri-20
bution in the field. This is particularly useful in coastal areas, because stake networks provide relevant information over a wide range of elevations, and enable the increase in SMB caused by orographic precipitation to be sampled correctly (e.g. Agosta et al., 2012a,b). Stake networks also allow information to be collected on the inter-annual variability of the SMB. However, acquiring long time series requires the maintenance
25
TCD
6, 3667–3702, 2012An updated and quality controlled surface mass balance dataset for Antarctica
V. Favier et al.
Title Page
Abstract Introduction
Conclusions References
Tables Figures
◭ ◮
◭ ◮
Back Close
Full Screen / Esc
Printer-friendly Version
Interactive Discussion
Discussion
P
a
per
|
Dis
cussion
P
a
per
|
Discussion
P
a
per
|
Discussio
n
P
a
per
|
represent the largest proportion (82 %) of observations, because several large stake networks (containing many stakes) exist but were measured only a few times.
3 Comparison of the reliable dataset with results of ERA reanalysis
3.1 A subset of our SMB database was used for the comparison with model
outputs
5
Although inaccurate, model outputs are useful because of their global coverage and their ability to predict the future. Combining real world data with model outputs is es-sential both to identify biases in various models and also biases due to heterogeneous data coverage.
It is difficult to compare spotty field data and model outputs on a regular grid. For
10
this reason, we defined a special dataset for a (basic) model validation. Because cli-matic models generally focus on clicli-matic conditions at the end of the 20th century, we filtered the database for this period, to avoid possible secular climate variations. Here, we only considered data covering the last 70 yr, leading to a slight reduction in the database (52 data were removed). We are aware that this process does not remove
15
the decadal bias of each datum because data present distinct time coverage. Now, this sub-dataset should be rescaled to a reference time period to produce a homogeneous climatology. But our purpose here was not to provide an accurate SMB map at the scale of Antarctica, but to compare the available field information with ERA-Interim data to judge if their spatial distribution is correct (or not) for model validation. In a future work,
20
data will be rescaled against a common period to remove regional trends caused by heterogeneous coverage of time.
Several data were further left aside because the elevation (as given in published works) differed from the local elevation (in the reference concerned) was not the same as the local elevation given by the 1-km resolution digital elevation model (DEM) of
25
TCD
6, 3667–3702, 2012An updated and quality controlled surface mass balance dataset for Antarctica
V. Favier et al.
Title Page
Abstract Introduction
Conclusions References
Tables Figures
◭ ◮
◭ ◮
Back Close
Full Screen / Esc
Printer-friendly Version
Interactive Discussion
Discussion
P
a
per
|
Dis
cussion
P
a
per
|
Discussion
P
a
per
|
Discussio
n
P
a
per
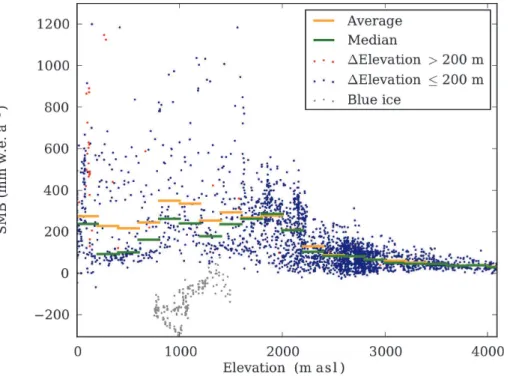
instance, if an elevation or geographic location was incorrectly estimated in the field). Differences can also be due to the DEM resolution (1 km), because local variations in topography may be smaller than those of the real terrain. A significant error in the DEM which may apply to several points is also possible when the slope is very steep. Consequently, we removed data for which the difference in elevation exceeded a 200
5
meter threshold (Fig. 5). This led to the removal of 44 observations. Finally, when val-idating the climate model, we noted that a few points still require a detailed analysis: 26 observations by Sinisalo et al. (2003) and 164 observations on Taylor glacier by Bliss et al. (2011) were in blue ice areas and should not be included in a validation process unless the climate model concerned took erosion and sublimation processes
10
into account (Fig. 3).
These additional removals led to a sub-dataset totaling 3152 observations for com-parison with model outputs (Table 2). In the following section, ERA-Interim SMB values are tested against this subset.
We also chose to focus on low elevation areas of Antarctica where much of the
15
snow accumulation occurs. Seventy percent of the Antarctic SMB accumulates below 2000 m a.s.l., although this elevation range represents only 40 % of the total area of Antarctica. Low elevation areas are those where spatial variability in the SMB are the highest and where largest future changes in SMB are expected to occur in the 21st cen-tury (e.g. Krinner et al., 2007, 2008; Genthon et al., 2009; Agosta et al., 2012b).
Con-20
versely, accumulation over interior plateaus is very low (less than 50 mm w.e. a−1) and rather homogeneous over long distances as the topography is flat. Thus, using dense field observations over low elevation networks is most appropriate for model validation, as already demonstrated in coastal Adelie Land where data from the GLACIOCLIM-SAMBA observatory allowed us to identify a number of discrepancies in the model
25
(Agosta et al., 2012a). Because low elevation areas (that is, where high SMB values are observed, Fig. 4b) are under-sampled, a focus on specific areas was necessary.
TCD
6, 3667–3702, 2012An updated and quality controlled surface mass balance dataset for Antarctica
V. Favier et al.
Title Page
Abstract Introduction
Conclusions References
Tables Figures
◭ ◮
◭ ◮
Back Close
Full Screen / Esc
Printer-friendly Version
Interactive Discussion
Discussion
P
a
per
|
Dis
cussion
P
a
per
|
Discussion
P
a
per
|
Discussio
n
P
a
per
|
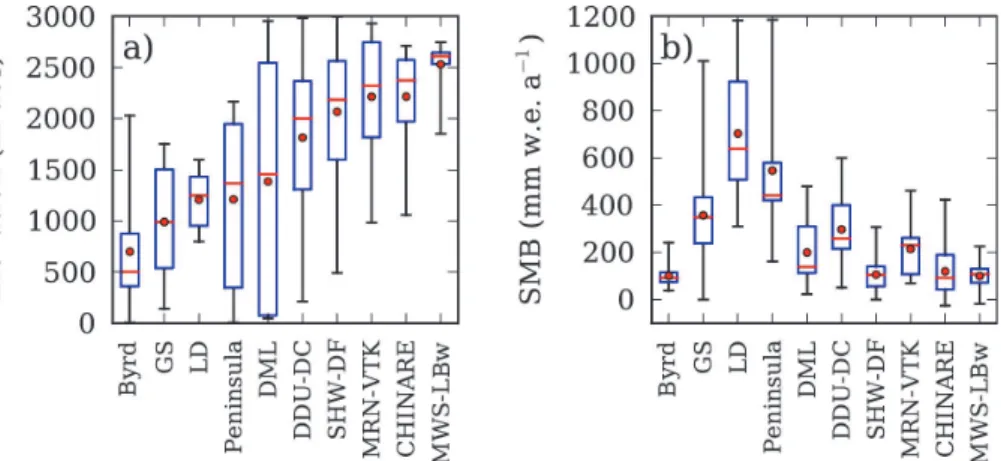
extending up to 3000 m a.s.l. when data from a continuous traverse were available). Data cover the peripheral regions and key catchments of Antarctica. We also se-lected homogeneous data in terms of temporal coverage and methodology, and gath-ered data resulting from the same initial publications and origin. This led us to se-lect the 10 datasets listed in Table 5 (Fig. 1b) along traverse lines in Adelie Land
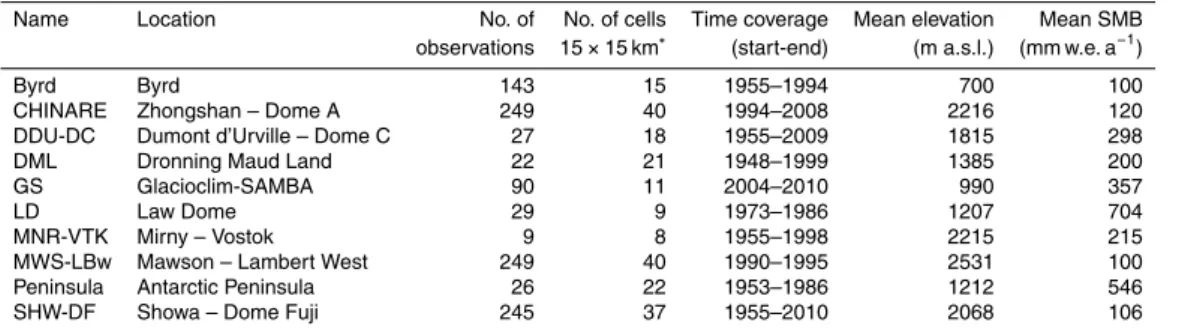
5
(GLACIOCLIM-SAMBA dataset), around Law Dome, from Zhongshan to Dome A, around the west side of Lambert glacier (above Mawson station), from Mirny to Vostok and from Syowa station to Dome F. Considering the spatial density of measurements, these data are particularly appropriate for model validation in coastal areas. We also selected three datasets not from traverses but from points located in Byrd region, along
10
the Antarctic Peninsula and in Dronning Maud Land.
For Dronning Maud Land, Mirny to Vostok and Peninsula, the observations covered a wide range of elevations (Fig. 6a) and presented a very low spatial density. These values thus provide important information on the regional increase in the mean SMB, and data are also highly impacted by small scale variability due to local erosion or
de-15
position processes (e.g. Eisen et al., 2009; Agosta et al., 2012a). Nevertheless, Byrd, Peninsula and Dronning Maud Land are useful to characterize atypical climate settings and to study these particular areas because considerable environmental changes are expected to occur there in the future. For instance, the Byrd dataset presents the par-ticularity that SMB values are low in low elevation areas (Fig. 6b).
20
Among these datasets, data from the GLACIOCLIM-SAMBA dataset and at Law Dome are particularly appropriate for model validation because they have a high spa-tial resolution and cover a long observation period. Data from Zhongshan to Dome A (CHINARE in Fig. 6) and the west side of Lambert glacier (above Mawson station) are mainly located above 1500 m a.s.l. (Fig. 6a), which reduces their usefulness for
25
TCD
6, 3667–3702, 2012An updated and quality controlled surface mass balance dataset for Antarctica
V. Favier et al.
Title Page
Abstract Introduction
Conclusions References
Tables Figures
◭ ◮
◭ ◮
Back Close
Full Screen / Esc
Printer-friendly Version
Interactive Discussion
Discussion
P
a
per
|
Dis
cussion
P
a
per
|
Discussion
P
a
per
|
Discussio
n
P
a
per
3.2 Comparison between our subset of SMB data and ERA-Interim outputs
3.2.1 Available SMB from ERA-interim reanalysis
We compared the subset (i.e. the 3152 data) from our SMB database with ERA-Interim data to judge the accuracy of the ECMWF global atmospheric reanalysis data, or con-versely, to correctly validate models by checking whether any areas are insufficiently
5
documented in the database. We then focused on the datasets for elevations between 0 and 3000 m a.s.l. (Table 5).
ERA-Interim (Simmons et al., 2006) is an improved form of operational analysis for which efficient four-dimensional variational data assimilation (4-D-Var) is performed by taking additional data into account. ERA-Interim data are produced by applying the IFS
10
model (Cy31r2 version), running in spherical harmonic representation (T255, nominal resolution of 80 km). Calculations are performed on 60 vertical levels (hybrid pressure-sigma coordinates) from the surface to the mesosphere at 0.1 hPa or 65 km. Here, we used ERA-Interim for the period 1989–2010, even though data are now available for the period 1979–1988. Data were interpolated over a 15-km Cartesian grid resulting from
15
a stereographic projection with the standard parallel at 70◦S and the Central meridian at 15◦W. The liquid phase (PL and R, see Sect. 2.1 for abbreviations) is assumed to refreeze entirely. The final SMB is thus the balance resulting from precipitation (P
Sand PL) and sublimation (S). In ERA-Interim, the model used does not account for wind erosion or deposition processes (E). Snow drift and wind processes are expected to
20
have significant effects on SMB when wind speed is high (e.g. Gall ´ee et al., 2012). These processes introduce a major uncertainty in SMB computations by ERA-Interim in low elevation areas. Hence, we did not focus on areas where snow erosion is the main SMB process over long distances – in this case, blue ice areas.
To compare simulated and observed SMB values, we extracted grid boxes including
25
TCD
6, 3667–3702, 2012An updated and quality controlled surface mass balance dataset for Antarctica
V. Favier et al.
Title Page
Abstract Introduction
Conclusions References
Tables Figures
◭ ◮
◭ ◮
Back Close
Full Screen / Esc
Printer-friendly Version
Interactive Discussion
Discussion
P
a
per
|
Dis
cussion
P
a
per
|
Discussion
P
a
per
|
Discussio
n
P
a
per
|
values included in the same model grid cell, and compared it to the SMB simulated by ERA-Interim. Finally, we compared observed and model data as a function of elevation.
3.2.2 Results
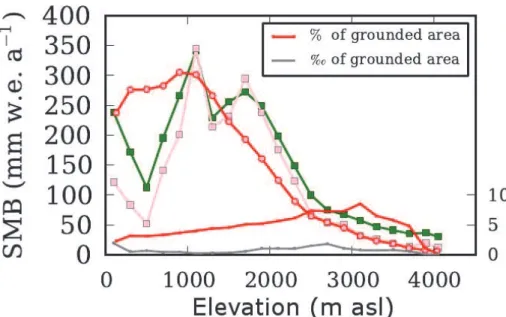
The Antarctic SMB simulated by ERA-Interim for the current period (1989–2010) was compared to our subset of measurements. Averaging ERA-Interim simulated data over
5
the grounded ice sheet led to a mean value of 128 mm w.e. a−1 (4.4 mm a−1 in terms of sea level equivalent). This estimate is among the lowest published values (Mon-aghan et al., 2006a), and is well below estimates by Vaughan et al. (1999) and Arthern et al. (2006). This low value is mainly due to very low accumulation modeled at high elevations (above 2000 m a.s.l.) where ERA-Interim is known to considerably
under-10
estimate the actual amount of solid precipitation, and below 1000 m a.s.l., where ERA overestimates ablation (Fig. 7). The areas located below 1000 m a.s.l. cover a nar-row belt around Antarctica in mountainous regions (the Antarctic Peninsula, in Palmer Land, along the Transantarctic mountains at 160◦E and in Mary Byrd Land). This ele-vation range is crucial for the Antarctic SMB because it concentrates most of the total
15
accumulated SMB.
In grid cells containing measurements, ERA-Interim values were lower than but close to mean measurements. This shows that SMB measurements are correctly reproduced by ERA-Interim. Nevertheless, for each elevation range between 200 and 1000 m a.s.l., the mean simulated SMB computed over all grid cells was significantly higher than
20
the one computed over grid cells containing measurements (Fig. 7: red circles versus red squares). In other words, even though the ERA-simulated SMB values agree with measurements, field data mainly reflect the low SMB areas and poorly constrain areas where SMB values are high, suggesting that observations do not correctly sample the SMB between 200 and 1000 m a.s.l. (as already suggested in Sect. 3.1). Above
25
TCD
6, 3667–3702, 2012An updated and quality controlled surface mass balance dataset for Antarctica
V. Favier et al.
Title Page
Abstract Introduction
Conclusions References
Tables Figures
◭ ◮
◭ ◮
Back Close
Full Screen / Esc
Printer-friendly Version
Interactive Discussion
Discussion
P
a
per
|
Dis
cussion
P
a
per
|
Discussion
P
a
per
|
Discussio
n
P
a
per
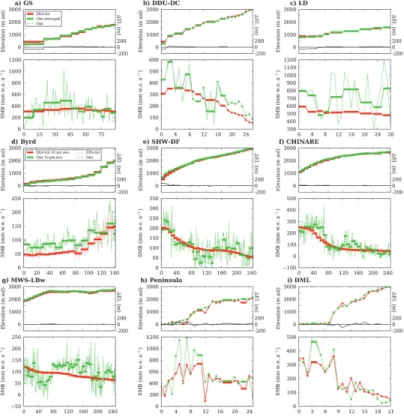
The datasets selected at low elevations also provide interesting information. The Era-Interim simulation fits observations acceptably despite significant differences (Fig. 8). A large proportion of SMB differences are due to the biases in the surface elevation used by the model. Indeed, temperature and all related energy fluxes depend directly on elevation. However, some of the differences are directly related to the model’s
in-5
ability to accurately represent the actual SMB distribution in the field. For instance, ERA-Interim assumes too low albedo values at low elevations (values between 0.1 and 0.75) and calculates too high runoffand sublimation. Overestimation of melting by ERA-Interim has already been demonstrated (Agosta et al., 2012a) and the SMB in coastal areas is usually calculated by considering that liquid water entirely refreezes.
10
However, incorrect albedo values have serious consequences for the entire surface energy balance (SEB), for instance on sublimation. Finally, this comparison provided useful information on how to design a network for correct estimation of SMB at re-gional scale. Because at a 1-km scale, SMB variability is very large in coastal areas (see GLACIOCLIM-SAMBA, Showa station to Dome F, and Zhongshan to Dome A
tra-15
verses for instance, Fig. 8a, f, e), using point data every 10 or 50 km (see Law Dome for instance, Fig. 8c) does not distinguish the regional mean from local variability. A survey of dense stake networks is clearly better in such cases. Another way to obtain a better estimate of spatial variability may be to use ground penetration radar (GPR) data to interpolate SMB point estimates from ice cores (e.g. Verfaillie et al., 2012).
20
4 Discussion and conclusion
In this paper, we present an up-to-date surface mass balance database for the entire Antarctic continent, including relevant information about the data (location, measure-ment methods, time period covered, specificity of the data, references) and recommen-dations for the use of data in particular regions. This database was carefully checked
25
TCD
6, 3667–3702, 2012An updated and quality controlled surface mass balance dataset for Antarctica
V. Favier et al.
Title Page
Abstract Introduction
Conclusions References
Tables Figures
◭ ◮
◭ ◮
Back Close
Full Screen / Esc
Printer-friendly Version
Interactive Discussion
Discussion
P
a
per
|
Dis
cussion
P
a
per
|
Discussion
P
a
per
|
Discussio
n
P
a
per
|
and in mean regional values. But, as already shown by Magand et al. (2007), this pro-cess removes suspicious data that could have a major impact on any kind of SMB interpolation (e.g. Magand et al., 2007; Genthon et al., 2009; Verfaillie et al., 2012).
Inspection of our reliable dataset showed that our knowledge of SMB distribution is even weaker than we supposed, because for large areas data were shown to be
un-5
reliable. This is particularly true in the Antarctic Peninsula, in West Antarctica, and along the margins of the ice sheet. Large scale field campaigns in these regions should thus be a scientific priority, with particular focus on elevations between 200 and 1000 m a.s.l., because measurements are currently mainly located in low SMB ar-eas and no mar-easurements are available in large arar-eas in which a significantly higher
10
SMB is expected.
Despite these limitations, the present work allowed us to obtain a new and more reli-able database for climate model validation. The datasets described in this paper should enable correct assessment of model quality in several specific areas (see Table 5). For model validation, similar approaches to those performed by Agosta et al. (2012a)
15
with the GLACIOCLIM-SAMBA network should be extended to the whole of Antarctica, using any climate model and the selected datasets. In the present study, we demon-strated the interest of comparing field data with ERA-Interim outputs. On one hand, our comparison confirmed that ERA-Interim correctly fits observations, even though the computed SMB presents significant dry biases. On the other hand, the comparison
20
demonstrated that observations do not correctly sample the SMB between 200 and 1000 m a.s.l., and that very few data are available for high SMB areas. New field data along the AIS margin and new traverses in unexplored areas are thus still required to validate climate models for Antarctica.
Correctly estimating the Antarctic SMB is still a complex issue, which will require
25
TCD
6, 3667–3702, 2012An updated and quality controlled surface mass balance dataset for Antarctica
V. Favier et al.
Title Page
Abstract Introduction
Conclusions References
Tables Figures
◭ ◮
◭ ◮
Back Close
Full Screen / Esc
Printer-friendly Version
Interactive Discussion
Discussion
P
a
per
|
Dis
cussion
P
a
per
|
Discussion
P
a
per
|
Discussio
n
P
a
per
given by ERA between this specific period and a reference period. A modeling step at a high resolution (∼10–20 km) is required to correctly account for the effects of lo-cal topography on precipitation and ablation processes, because the computed SMB is tightly linked to model resolution (e.g. Krinner et al., 2008; Genthon et al., 2009). Regional circulation models (e.g. MAR, RACMO2, PMM5) are good candidates for
5
this task. The selected model should correctly model surface processes such as snow metamorphism and albedo, refreezing, and erosion or deposition of drifting snow. This is particularly important below 2000 m a.s.l. where strong katabatic wind cause con-siderable snowdrift (erosion or deposition processes), and also where melting may be significant but not always generate surface runoff. The selected models will have to
10
correctly account for cloud physics to accurately reproduce precipitation over interior plateaus. Finally, a better estimate of the Antarctic SMB will also require the use of remote sensing data, and again, the first step should be applying the method of Arth-ern et al. (2006) to the current updated and quality controlled dataset. This method should allow the treatment or removal of serious biases in passive microwave data due
15
to steep slopes and melting at low elevations (Magand et al., 2008).
This paper presented the most recent updated surface mass balance dataset for Antarctica. The database is freely available on the GLACIOCLIM-SAMBA website (http: //www-lgge.ujf-grenoble.fr/ServiceObs/SiteWebAntarc/database.html) for any scien-tific use. Continuous updating of the database is planned but will require data owners
20
TCD
6, 3667–3702, 2012An updated and quality controlled surface mass balance dataset for Antarctica
V. Favier et al.
Title Page
Abstract Introduction
Conclusions References
Tables Figures
◭ ◮
◭ ◮
Back Close
Full Screen / Esc
Printer-friendly Version
Interactive Discussion
Discussion
P
a
per
|
Dis
cussion
P
a
per
|
Discussion
P
a
per
|
Discussio
n
P
a
per
|
Acknowledgements. The GLACIOCLIM-SAMBA observatory is supported by IPEV (Institut Po-laire Paul-Emile Victor) and INSU (Institut National des Sciences de l’Univers). We acknowl-edge the ice2sea project funded by the European Commission’s 7th Framework Programme through grant number 226375, ice2sea manuscript number ice2sea128. We thank J ´er ˆome Chappellaz, Kenji Kawamura and Kumiko Azuma who helped us contact data owners to obtain
5
new unpublished data. We thank M. Fily and ANR fundings (“VANISH” project no. ANR-07-VULN-013) for providing several new unpublished data around Dome C. Finally, we are grateful to O. Magand and P. Smeets who provided partially updated databases, and we particularly thank A. Bliss, M. Ding, and H. Motoyama who gave us access to the full information on pub-lished datasets over long traverses.
10
The publication of this article is financed by CNRS-INSU.
References
Agosta, C., Favier, V., Genthon C., Gall ´ee H., Krinner, G., Lenaerts, J., and Van den
15
Broeke, M. R.: A 40-year accumulation dataset for Adelie Land, Antarctica and its application for model validation, Clim. Dynam., 38, 75–86, 2012a.
Agosta, C., Favier, V., Krinner, G., Gall ´ee, H., and Genthon, C.: High resolution modeling of the Antarctic mass balance for the 20th, 21st and 22nd centuries, Clim, Dynam., in review, 2012b.
20
TCD
6, 3667–3702, 2012An updated and quality controlled surface mass balance dataset for Antarctica
V. Favier et al.
Title Page
Abstract Introduction
Conclusions References
Tables Figures
◭ ◮
◭ ◮
Back Close
Full Screen / Esc
Printer-friendly Version
Interactive Discussion
Discussion
P
a
per
|
Dis
cussion
P
a
per
|
Discussion
P
a
per
|
Discussio
n
P
a
per
Arthern, R. J., Winebrenner, D. P., and Vaughan, D. G.: Antarctic snow accumulation mapped using polarization of 4.3-cm wavelength microwave emission, J. Geophys. Res.-Atmos., 111, D06107, doi:10.1029/2004JD005667, 2006.
Bamber, J. L., Gomez-Dans, J. L., and Griggs, J. A.: Antarctic 1 km Digital Elevation Model (DEM) from Combined ERS-1 Radar and ICESat Laser Satellite Altimetry, National Snow
5
and Ice Data Center, Boulder, Colorado, 2009.
Bindschadler, R. A., Stephenson, S. N., Roberts, E. P., Mac Ayeal, D. R., and Lindstrom, D. R.: Data report for the Siple Coast project, National Aeronautics and Space Administration (NASA Technical Memorandum 100708), 102 pp., Washington, DC, 1988.
Bliss, A. K., Cuffey, K. M., and Kavanaugh, J. L.: Sublimation and surface energy budget of
10
Taylor Glacier, Antarctica, J. Glaciol., 57, 684–696, 2011.
Brecher, H.: Glaciological Observations on the Byrd Station-South Pole Traverse, 1960–1961, J. Glaciol., 5, 339–343, 1964.
Bull, C.: Snow accumulation in Antarctica, in Research in the Antarctic, 367–421, Am. Assoc. for the Adv. of Sci., Washington, D.C., 1971.
15
Ding, M., Xiao, C.; Li, Y.; Ren, J.; Hou, S., Jin, B., and Sun, B.: Spatial variability of surface mass balance along a traverse route from Zhongshan station to Dome A, Antarctica, J. Glaciol., 57, 658–666, 2011.
Eisen, O., Frezzotti, M., Genthon, C., Isaksson, E., Magand, O., Van Den Broeke, M. R., Dixon, D. A., Ekaykin, A., Holmlund, P., Kameda, T., Karlof, L., Kaspari, S., Lipenkov, V. Y.,
20
Oerter, H., Takahashi, S., and Vaughan, D. G.: Ground-based measurements of spatial and temporal variability of snow accumulation in East Antarctica, Rev. Geophys., 46, RG2001, doi:10.1029/2006RG000218, 2008.
Frezzotti, M., Pourchet, M., Flora, O., Gandolfi, S., Gay, M., Urbini, S., Vincent, C., Becagli, S., Gragnani, R., Proposito, M., Severi, M., Traversi, R., Udisti, R., and Fily, M.: New estimations
25
of precipitation and surface sublimation in East Antarctica from snow accumulation measure-ments, Clim. Dynam., 23, 803–813, doi:10.1007/s00382-004-0462-5, 2004.
Fujiwara, K. and Endo, Y.: Traverse Syowa-South Pole 1968–1969, JARE Scientific Reports, Special Issue, No. 2, 68–109, National Institute of Polar Research, Tokyo, 1971.
Gall ´ee, H., Trouvilliez, A., Agosta, C., Genthon, C., Favier, V., and Naaim-Bouvet, F.: Transport
30
TCD
6, 3667–3702, 2012An updated and quality controlled surface mass balance dataset for Antarctica
V. Favier et al.
Title Page
Abstract Introduction
Conclusions References
Tables Figures
◭ ◮
◭ ◮
Back Close
Full Screen / Esc
Printer-friendly Version
Interactive Discussion
Discussion
P
a
per
|
Dis
cussion
P
a
per
|
Discussion
P
a
per
|
Discussio
n
P
a
per
|
Genthon, C. and Krinner. G.: Antarctic surface mass balance and systematic biases in general circulation models, J. Geophys. Res.-Atmos., 106, 20653–20664, 2001.
Genthon, C., Magand, O., Krinner, G., and Fily M.: Do climate models underestimate snow accumulation on the Antarctic plateau? A re-evaluation of/from in situ observations in East Wilkes and Victoria Lands, Ann. Glaciol., 50, 61–65, 2009.
5
Goodwin, I. D.: Ice sheet topography and surface characteristics in Eastern Wilkes Land, East Antarctica, ANARE Res. Notes, 64, 100 pp., Antarctic Division, Australia, 1998.
Helsen, M. M., Van den Broeke, M. R., Van de Wal, R. S. W., Van de Berg, W. J., Van Mei-jgaard, E., Davis, C. H., Li, Y. H., and Goodwin, I.: Elevation changes in Antarctica mainly determined by accumulation variability, Science, 320, 1626–1629, 2008.
10
Higham, M. and Craven, M.: Surface Mass Balance and Snow Surface Properties from the Lambert Glacier Basin Traverses 1990–1994, Research report, Antarctic CRC, report no. 9, 129 pp., University of Tasmania, Hobart, 1997.
Krinner, G., Magand, O., Simmonds, I., Genthon, C., and Dufresne, J. L.: Simulated Antarctic precipitation and surface mass balance at the end of the twentieth and twenty-first centuries,
15
Clim. Dynam., 28, 215–230, 2007.
Krinner, G., Guicherd, B., Ox, K., Genthon, C., and Magand, O.: Influence of oceanic boundary conditions in simulations of Antarctic climate and surface mass balance change during the coming century, J. Climate, 21, 938–962, doi:10.1175/2007JCLI1690.1, 2008.
Lemke, P., Ren, J., Alley, R. B., Allison, I., Carrasco, J., Flato, G., Fujii, Y., Kaser, G., Mote, P.,
20
Thomas, R. H., and Zhang, T.: Observations: changes in snow, ice and frozen ground, in: Climate Change 2007: The Physical Science Basis. Contribution of Working Group I to the Fourth Assessment Report of the Intergovernmental Panel on Climate Change, edited by: Solomon, S., Qin, D., Manning, M., Chen, Z., Marquis, M., Averyt, K. B., Tignor, M., and Miller, H. L., Cambridge University Press, Cambridge, UK and New York, NY, USA, 2007.
25
Lenaerts, J. T. M., Van den Broeke, M. R., Van de Berg, W. J., Meijgaard, E. V., and Munneke, P. K.: A new, high-resolution surface mass balance map of Antarctica (1979– 2010) based on regional atmospheric climate modeling, Geophys. Res. Lett., 39, L04501, doi:10.1029/2011GL050713, 2012.
Magand, O., Genthon, C., Fily, M., Krinner, G., Picard, G., Frezzotti, M., and Ekaykin,
30
TCD
6, 3667–3702, 2012An updated and quality controlled surface mass balance dataset for Antarctica
V. Favier et al.
Title Page
Abstract Introduction
Conclusions References
Tables Figures
◭ ◮
◭ ◮
Back Close
Full Screen / Esc
Printer-friendly Version
Interactive Discussion
Discussion
P
a
per
|
Dis
cussion
P
a
per
|
Discussion
P
a
per
|
Discussio
n
P
a
per
Magand, O., Picard, G., Brucker, L., Fily, M., and Genthon, C.: Snow melting bias in microwave mapping of Antarctic snow accumulation, The Cryosphere, 2, 109–115, doi:10.5194/tc-2-109-2008, 2008.
Monaghan, A. J., Bromwich, D. H., and Wang, S. H.: Recent trends in Antarctic snow accumulation from polar MM5 simulations, Philos. T. R. Soc. A, 364, 1683–1708,
5
doi:10.1098/rsta.2006.1795, 2006a.
Monaghan, A. J., Bromwich, D. H., Fogt, R. L., Wang, S. H., Mayewski, P. A., Dixon, D. A., Ekaykin, A., Frezzotti, M., Goodwin, I., Isaksson, E., Kaspari, S. D., Morgan, V. I., Oerter, H., Van Ommen, T. D., Van Der Veen, C. J., and Wen, J. H.: Insignificant change in Antarctic snowfall since the International Geophysical Year, Science, 313, 827–831, 2006b.
10
Mosley-Thompson, E., Thompson, L. G., Paskievitch, J. F., Pourchet, M., Gow, A. J., Davis, M. E., and Kleinman, J.: South Pole snow accumulation has increased in recent decades, Ann. Glaciol., 21, 182–188, 1995.
Mosley-Thompson, E., Paskievitch, J. F., Gow, A. J., and Thompson, L. G.: Late 20th Cen-tury increase in South Pole snow accumulation, J. Geophys. Res., 104, 3877–3886,
15
doi:10.1029/1998JD200092, 1999.
Motoyama, H. and Fujii, Y.: Glaciological Data Collected by the 38th Japanese Antarctic Re-search, Expedition During 1997–1998, Jare data reports, 28 (239), National Institute of Polar Research, Tokyo, 1999.
Pirrit, J. and Doumani, G. A.: Glaciology, Byrd Station and Marie Byrd Land Traverse, 1959–
20
1960, Report 968-2, IGC Antarctic Glaciological Data Field Work 1959, Ohio State Univ. Res. Found., Columbus, Ohio, 1961.
Rignot, E., Velicogna, I., Van den Broeke, M. R., Monaghan, A., and Lenaerts. J.: Acceleration of the contribution of the Greenland and Antarctic ice sheets to sea level rise, Geophys. Res. Lett., 38, L05503, doi:10.1029/2011GL046583, 2011.
25
Rotschky, G., Holmlund, P., Isaksson, E., Mulvaney, R., Oerter, H., Van den Broeke, M.R, and Winther, J. G.: A new surface accumulation map for Western Dronning Maud Land, Antarctica, from interpolation of point measurements, J. Glaciol., 53, 385–398, doi:10.3189/002214307783258459, 2007.
Shimizu, H.: Glaciological studies in West, 1960–1962, in Antarctic Snow and Ice Studies,
30
Antarct. Res. Ser., Vol. 2, edited by: Mellor, M., 37–64, AGU, Washington, D.C., 1964. Simmons, A., Uppala, S., Dee, D., and Kobayashi, S.: ERA-Interim: New ECMWF reanalysis
TCD
6, 3667–3702, 2012An updated and quality controlled surface mass balance dataset for Antarctica
V. Favier et al.
Title Page
Abstract Introduction
Conclusions References
Tables Figures
◭ ◮
◭ ◮
Back Close
Full Screen / Esc
Printer-friendly Version
Interactive Discussion
Discussion
P
a
per
|
Dis
cussion
P
a
per
|
Discussion
P
a
per
|
Discussio
n
P
a
per
|
Sinisalo, A., Moore, J. C., Van de Wal, R. S. W., Bintanja, R., and Jonsson, S.: A 14 year mass-balance record of a blue-ice area in Antarctica, Ann. Glaciol., 37, 213–218, 2003. Thomas, R. H., Mac Ayeal, D. R., Eilers, D. H., and Gaylord, D. R.: Glaciological studies on the
Ross ice shelf, Antarctica, 1973–1978, Antar. Res. S., 42, 211–53, 1984.
Van de Berg, W. J., Van den Broeke, M. R., Reijmer, C., and Van Meijgaard, E.: Reassessment
5
of the Antarctic surface mass balance using calibrated output of a regional atmospheric climate model, J. Geophys. Res., 111, D11104, doi:10.1029/2005JD006495, 2006.
Vaughan, D. G. and Russell, J.: Compilation of surface mass balance measurements in Antarc-tica, Internal Rep. ES4/8/1/1997/1, 56 pp., Br. Antarct. Surv., Cambridge, UK, 1997.
Vaughan, D. G., Bamber, J. L., Giovinetto, M., Russell, J., and Cooper, A. P. R.: Reassessment
10
of net surface mass balance in Antarctica, J. Climate, 12, 933–946, 1999.
Verfaillie, D., Fily, M., Le Meur, E., Magand, O., Jourdain, B., Arnaud, L., and Favier, V.: Snow ac-cumulation variability in Adelie Land (East Antarctica) derived from radar and firn core data. A 600 km transect from Dome C, The Cryosphere Discuss., 6, 2855–2889, doi:10.5194/tcd-6-2855-2012, 2012.
TCD
6, 3667–3702, 2012An updated and quality controlled surface mass balance dataset for Antarctica
V. Favier et al.
Title Page
Abstract Introduction
Conclusions References
Tables Figures
◭ ◮
◭ ◮
Back Close
Full Screen / Esc
Printer-friendly Version
Interactive Discussion
Discussion
P
a
per
|
Dis
cussion
P
a
per
|
Discussion
P
a
per
|
Discussio
n
P
a
per
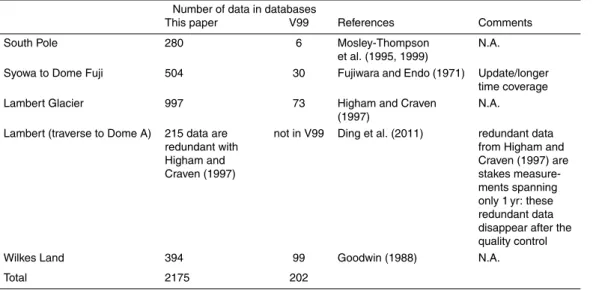
Table 1. List of sectors where data are presented separately instead of their average over 20×20 km2grid cells given in V99.
Number of data in databases
This paper V99 References Comments
South Pole 280 6 Mosley-Thompson
et al. (1995, 1999)
N.A.
Syowa to Dome Fuji 504 30 Fujiwara and Endo (1971) Update/longer time coverage
Lambert Glacier 997 73 Higham and Craven
(1997)
N.A.
Lambert (traverse to Dome A) 215 data are redundant with Higham and Craven (1997)
not in V99 Ding et al. (2011) redundant data from Higham and Craven (1997) are stakes measure-ments spanning only 1 yr: these redundant data disappear after the quality control
Wilkes Land 394 99 Goodwin (1988) N.A.
TCD
6, 3667–3702, 2012An updated and quality controlled surface mass balance dataset for Antarctica
V. Favier et al.
Title Page
Abstract Introduction
Conclusions References
Tables Figures
◭ ◮
◭ ◮
Back Close
Full Screen / Esc
Printer-friendly Version
Interactive Discussion
Discussion
P
a
per
|
Dis
cussion
P
a
per
|
Discussion
P
a
per
|
Discussio
n
P
a
per
|
Table 2.SMB datasets, and available data at each step.
Name in the text Filtering No. of observations
Full SAMBA-LGGE database Full updated database before any filter-ing (but excludfilter-ing digitalized data from Bull, 1971)
5284
“A” rated data Basic quality (see Table 3) control, only “A” rated data are retained
3438
For 20th century model validation Blue ice data, data covering more than 70 yr, and data with differences in el-evation of more than 200 m from the Digital elevation Model from Bamber et al. (2009) were excluded
TCD
6, 3667–3702, 2012An updated and quality controlled surface mass balance dataset for Antarctica
V. Favier et al.
Title Page
Abstract Introduction
Conclusions References
Tables Figures
◭ ◮
◭ ◮
Back Close
Full Screen / Esc
Printer-friendly Version
Interactive Discussion
Discussion
P
a
per
|
Dis
cussion
P
a
per
|
Discussion
P
a
per
|
Discussio
n
P
a
per
Table 3.Reliability and applicability conditions of SMB measurement methods (see Magand et al., 2007, for details on reliability criteria).
Reliabilitya SMB measurement
methods
Applicability conditions Annual Multi-annual Decadalb
Anthropogenic radionuclides
Dry snow facies, little mixing, absolute calibration and dating tools with reference horizon lev-els
/ A A
Stake measurements Everywhere, annual and multi-year averaged SMB variability studies
Cc A A
Natural 210Pb Dry snow facies, little mix-ing, less accurate than anthro-pogenic radionuclides
/ / Bd
Stable isotope content and chemical markers
Dry snow facies, annual to multi-year averaged SMB variability studies, clear observations dif-ficult in areas with very low SMB values (Central Antarctic plateau), subjectivity in counting annual layers
/ B B
Snow stratigraphy Dry snow facies, “low” reliability and accuracy
C C C
Precipitation gauges Unreliable, inaccurate C C C
aThe methods deemed very reliable are rated “A”, methods judged reliable are provisionally accepted
(rated “B”), unreliable data are rated “C”.
bOver one or several decades,
cApplicable to single stakes and stake networks,
dThe natural 210Pb SMB method is reliable only over 4 to 5 decades (
TCD
6, 3667–3702, 2012An updated and quality controlled surface mass balance dataset for Antarctica
V. Favier et al.
Title Page
Abstract Introduction
Conclusions References
Tables Figures
◭ ◮
◭ ◮
Back Close
Full Screen / Esc
Printer-friendly Version
Interactive Discussion
Discussion
P
a
per
|
Dis
cussion
P
a
per
|
Discussion
P
a
per
|
Discussio
n
P
a
per
|
Table 4.Mean SMB computed from field observations for Antarctica, and for the eastern and western parts of Antarctica. Note that these SMB averages are only for areas with observation, and do not represent a mean SMB for the whole continent.
“A” rated data Full database
Antarctica
(Grounded area: 12.2 106km2)
1463(1444) 177 (159)
East Antarctica1
(Grounded area: 8.5 106km2)
139 (132) 142 (122)
West Antarctica2
(Grounded area: 3.7 106km2)
168 (159) 228 (244)
1More precisely, for the 0◦E–180◦E sector of Antarctica.
2More precisely, for the 0◦W–180◦W sector of Antarctica.
3Mean SMB value, assuming that each observation has the same weight. 4We first computed the average SMB for each 15
TCD
6, 3667–3702, 2012An updated and quality controlled surface mass balance dataset for Antarctica
V. Favier et al.
Title Page
Abstract Introduction
Conclusions References
Tables Figures
◭ ◮
◭ ◮
Back Close
Full Screen / Esc
Printer-friendly Version
Interactive Discussion
Discussion
P
a
per
|
Dis
cussion
P
a
per
|
Discussion
P
a
per
|
Discussio
n
P
a
per
Table 5. Description of selected datasets in low elevation areas for comparison with ERA-Interim reanalysis.
Name Location No. of No. of cells Time coverage Mean elevation Mean SMB observations 15×15 km∗ (start-end) (m a.s.l.) (mm w.e. a−1
)
Byrd Byrd 143 15 1955–1994 700 100
CHINARE Zhongshan – Dome A 249 40 1994–2008 2216 120
DDU-DC Dumont d’Urville – Dome C 27 18 1955–2009 1815 298
DML Dronning Maud Land 22 21 1948–1999 1385 200
GS Glacioclim-SAMBA 90 11 2004–2010 990 357
LD Law Dome 29 9 1973–1986 1207 704
MNR-VTK Mirny – Vostok 9 8 1955–1998 2215 215
MWS-LBw Mawson – Lambert West 249 40 1990–1995 2531 100
Peninsula Antarctic Peninsula 26 22 1953–1986 1212 546
SHW-DF Showa – Dome Fuji 245 37 1955–2010 2068 106
∗Number of 15
TCD
6, 3667–3702, 2012An updated and quality controlled surface mass balance dataset for Antarctica
V. Favier et al.
Title Page
Abstract Introduction
Conclusions References
Tables Figures
◭ ◮
◭ ◮
Back Close
Full Screen / Esc
Printer-friendly Version
Interactive Discussion
Discussion
P
a
per
|
Dis
cussion
P
a
per
|
Discussion
P
a
per
|
Discussio
n
P
a
per
|
TCD
6, 3667–3702, 2012An updated and quality controlled surface mass balance dataset for Antarctica
V. Favier et al.
Title Page
Abstract Introduction
Conclusions References
Tables Figures
◭ ◮
◭ ◮
Back Close
Full Screen / Esc
Printer-friendly Version
Interactive Discussion
Discussion
P
a
per
|
Dis
cussion
P
a
per
|
Discussion
P
a
per
|
Discussio
n
P
a
per
|
TCD
6, 3667–3702, 2012An updated and quality controlled surface mass balance dataset for Antarctica
V. Favier et al.
Title Page
Abstract Introduction
Conclusions References
Tables Figures
◭ ◮
◭ ◮
Back Close
Full Screen / Esc
Printer-friendly Version
Interactive Discussion
Discussion
P
a
per
|
Dis
cussion
P
a
per
|
Discussion
P
a
per
|
Discussio
n
P
a
per
Fig. 4.Main characteristics of reliable SMB data.(a)Comparison between distribution of eleva-tion in the database (blue histograms) and distribueleva-tion of surface elevaeleva-tion of Antarctica (white histograms). Elevation are deduced from Bamber et al. (2009) DEM,(b) number of observa-tions as a function of SMB values,(c)number of observations as a function of time coverage,
TCD
6, 3667–3702, 2012An updated and quality controlled surface mass balance dataset for Antarctica
V. Favier et al.
Title Page
Abstract Introduction
Conclusions References
Tables Figures
◭ ◮
◭ ◮
Back Close
Full Screen / Esc
Printer-friendly Version
Interactive Discussion
Discussion
P
a
per
|
Dis
cussion
P
a
per
|
Discussion
P
a
per
|
Discussio
n
P
a
per
|