TCD
8, 2573–2610, 2014Elevation changes of Inylchek Glacier during 1974–2007
D. Shangguan et al.
Title Page
Abstract Introduction
Conclusions References
Tables Figures
◭ ◮
◭ ◮
Back Close
Full Screen / Esc
Printer-friendly Version Interactive Discussion
Discussion
P
a
per
|
Discus
sion
P
a
per
|
Discussion
P
a
per
|
Discussion
P
a
per
|
The Cryosphere Discuss., 8, 2573–2610, 2014 www.the-cryosphere-discuss.net/8/2573/2014/ doi:10.5194/tcd-8-2573-2014
© Author(s) 2014. CC Attribution 3.0 License.
This discussion paper is/has been under review for the journal The Cryosphere (TC). Please refer to the corresponding final paper in TC if available.
Elevation changes of Inylchek Glacier
during 1974–2007, Central Tian Shan,
Kyrgyzstan derived from remote sensing
data
D. Shangguan1,2, T. Bolch2,3, Y. Ding1, M. Kröhnert3, T. Pieczonka3, H.-U. Wetzel4, and S. Liu1
1
State Key Laboratory of Cryospheric Science, Cold & Arid Regions Environmental & Engineering Research Institute, Chinese Academy of Sciences, Lanzhou 730000, China
2
Department of Geography, University of Zurich, Zurich, Switzerland
3
Institute for Cartography, Technische Universität Dresden, 01069 Dresden, Germany
4
GFZ German Research Centre for Geosciences, Potsdam, Germany
Received: 31 March 2014 – Accepted: 30 April 2014 – Published: 21 May 2014
Correspondence to: D. Shangguan ([email protected])
TCD
8, 2573–2610, 2014Elevation changes of Inylchek Glacier during 1974–2007
D. Shangguan et al.
Title Page
Abstract Introduction
Conclusions References
Tables Figures
◭ ◮
◭ ◮
Back Close
Full Screen / Esc
Printer-friendly Version Interactive Discussion
Discussion
P
a
per
|
Discus
sion
P
a
per
|
Discussion
P
a
per
|
Discussion
P
a
per
|
Abstract
Glacier melt is an important source of fresh water for the arid regions surrounding the Tian Shan. Inylchek Glacier (650 km2) is the largest glacier in Tian Shan consisting of two branches (northern Inylchek glacier and southern Inylchek glacier) separated by the regularly draining Lake Merzbacher. However, little is known about volume and
5
mass changes of the last decades. In this study, we investigated the changes of glacier area and glacier surface elevation from 1974 until 2007 and the surface velocity be-tween 2003 and 2011 using multi-temporal remote-sensing data. The main flow direc-tion of Southern Inylchek Glacier tongue showed strong velocities of∼100 m a−1with
a slight decreasing tendency between 2002/03 and 2010/11. The end of the tongue
10
however, is likely stagnant as the main flow is directed towards Lake Merzbacher. The total glacier area increased by 1.3±0.1 km2(∼0.2 %) within the studies period though
southern Inylchek Glacier shrank consecutive since 1974. The overall area gain was caused by the strong increase of northern Inylchek Glacier of 3.7±0.3 km2 between
1990–1999. A comparison of glacier surface elevation using multi-temporal digital
el-15
evation models derived from KH9-Hexagon (1974), SRTM (1999), ALOS (2006) and SPOT5-HRG (2007) revealed an overall elevation difference of Inylchek Glacier of
−0.5±0.1 m a−1for the period of 1974–2007. The northern glacier branch showed on
average no significant surface elevation change (0.1±0.1 m a−1) during 1974 and 2007
while a significant lowering of 0.7±0.1 m a−1 was observed for the southern branch. 20
The overall negative values are mainly due to the period 1974–1999. A possible thick-ening of 0.5±0.5 m a−1 occurred between 1999 and 2007 where a clear thickening
was measured in the accumulation area of the southern branch. We also identified the thickening with a maximum of about∼150 m close to the end of the northern Inylchek
Glacier tongue for the period 1974–1999. This is possibly due to a surge event which
25
TCD
8, 2573–2610, 2014Elevation changes of Inylchek Glacier during 1974–2007
D. Shangguan et al.
Title Page
Abstract Introduction
Conclusions References
Tables Figures
◭ ◮
◭ ◮
Back Close
Full Screen / Esc
Printer-friendly Version Interactive Discussion
Discussion
P
a
per
|
Discus
sion
P
a
per
|
Discussion
P
a
per
|
Discussion
P
a
per
|
1 Introduction
Meltwater from snow and ice is an important fresh water resource for the arid regions surrounding the Tian Shan (Sorg et al., 2012). This is especially true for the Tarim Basin in Xinjiang/Northwest China where current estimates report that about 40 % of the overall discharge of the Tarim River, the main artery for the very arid basin, is from
5
glacier melt water (Aizen et al., 2007; Sorg et al., 2012), while the transboundary Asku River (named Sary-Djaz in Krygyzstan), originating in Central Tian Shan, contributes about 75 % to the overall run-off of Tarim River. On average, glaciers shrank also in this central region of Tian Shan but with lower rates than in the outer ranges (Sorg et al., 2012). Reported shrinkage rates vary between∼3.7 % for the entire Sary-Djaz 10
Basin during 1990–2010 (Osmonov et al., 2013), and∼8.7 % for the neighbouring
Ak-Shirak Range during 1977–2003 (Aizen et al., 2006). However, area changes show only indirect, filtered and delayed signals of climate change (Paterson, 1994). In addi-tion, glaciers in Central Tian Shan are polythermal or even part of cold glaciers which have a lower mass turn over than temperate glaciers and, hence, lower changes in
15
area than for temperate glaciers are typical. Only changes in ice thickness and mass balance can be more directly linked to climate and allow, taking the glacier area into ac-count, direct comparisons with the climate reactions of other glaciers and regions and relate the changes directly to run-off. Glacier mass balance is traditionally measured in-situ. As this work is laborious and most of the glaciers are located in remote and hardly
20
accessible terrain, measurements can only be conducted for few glaciers. Several stud-ies have shown that remote-sensing derived geodetic mass balances are promising to extend the in-situ measurements and cover larger regions (e.g. Berthier et al., 2010; Gardelle et al., 2013; Paul and Haeberli, 2008). Most of these studies compare recent digital elevation models with the SRTM DEM from February 2000, while declassified
25
TCD
8, 2573–2610, 2014Elevation changes of Inylchek Glacier during 1974–2007
D. Shangguan et al.
Title Page
Abstract Introduction
Conclusions References
Tables Figures
◭ ◮
◭ ◮
Back Close
Full Screen / Esc
Printer-friendly Version Interactive Discussion
Discussion
P
a
per
|
Discus
sion
P
a
per
|
Discussion
P
a
per
|
Discussion
P
a
per
|
By using 1 : 25 000 scale topographic maps representing the glacier of the year 1977 and the SRTM DEM Aizen et al. (2006) presented an annual surface lowering of 0.69±
0.37 m a−1for the Ak-Shyrak Massif while Pieczonka et al. (2013) found a mass loss of 0.43±0.23 m a−1using 1976 KH-9 data and the SRTM DEM for several debris-covered
glaciers south of Jengish Chogsu (Pik Pobeda in Russian/Tomür Feng in Chinese). The
5
loss was possibly lower in the period 1999–2009. Both clean-ice and debris-covered glaciers showed significant volume and mass losses. However, there is some spatial variability and even some rapid advancing and surging glaciers were found (Osmonov et al., 2013; Pieczonka et al., 2013; Aizen et al., 2006). Inylchek Glacier (IG), the largest glacier in Tian Shan which is investigated in this study is heavily debris covered at the
10
tongue which alters both rates and spatial patterns of melting. IG was investigated both in the field (e.g. with ablation measurements, Hagg et al., 2008) and by remote sensing (especially for velocity measurements, e.g. Li et al., 2013). However, no information about the volume and mass changes are available until present.
In this work, we use 1974 KH9 Hexagon, 2006 ALOS, and 2008 SPOT5_HRG and
15
the 2000 SRTM DEM to assess the volume change of IG by generating multi-temporal DEMs. In addition, we investigate area changes and the glacier flow using Landsat TM/ETM+and Terra ASTER images.
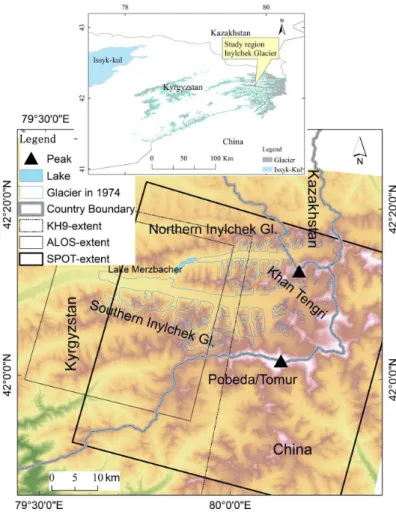
2 Study region
Inylchek Glacier is located at the headwater of the Aksu-Tarim River catchment in the
20
border triangle of Kyrgyzstan, Kazakhstan and China between Jengish Chogsu (Peak Pobeda/Tomur Feng, 7439 m a.s.l.) and Khan Tengri (6995 m a.s.l.), the highest peaks of the Tian Shan (Fig. 1). The glacier is stretching about 60.5 km with an area of ap-prox. 650 km2. It is the largest glacier of the Tian Shan and accounts for ∼32 % of
the total glacier area of the Sary-Djaz river basin (total ice cover: 2055 km2 Ozmonov
25
TCD
8, 2573–2610, 2014Elevation changes of Inylchek Glacier during 1974–2007
D. Shangguan et al.
Title Page
Abstract Introduction
Conclusions References
Tables Figures
◭ ◮
◭ ◮
Back Close
Full Screen / Esc
Printer-friendly Version Interactive Discussion
Discussion
P
a
per
|
Discus
sion
P
a
per
|
Discussion
P
a
per
|
Discussion
P
a
per
|
by Lake Merzbacher which was formed due to the retreat of northern IG while the ice of southern IG forms and ice-barrier dams the meltwater (Häusler et al., 2011). Lake Merzbacher drains almost annually in summer/autumn causing an outburst flood which can well be measured 150 km downstream at the discharge measurement 1500 m3s−1∼2000 m3s−1 in Xiehela hydrological station within Xinjiang/China (Ng 5
et al., 2007; Glazirin, 2010). Existing velocity measurements of southern IG show surface velocities of about 100 m a−1 for the middle part of the tongue of Southern IG. Interestingly the glacier flow is mainly directed towards Merzbacker Lake (Mayer et al., 2008; Nobakht et al., 2014).
13 % of the annual runoff during 1957–2006 in Aksu River was due to the glacier
10
imbalance (Shen et al., 2009) and river runoffitself has likely changed as well (Li et al., 2008; Piao et al., 2012; Liu et al., 2006). Consequently, glacier-fed streamflow regimes have direct implications on freshwater supply, irrigation and hydropower potential which have brought serious problems to socio-economic development (Ng et al., 2007; Shen et al., 2009).
15
The area under investigation is characterized by a semi-continental climate. Pre-cipitation recorded at Tian Shan station (1960–1997) (78.2◦N, 41.9◦E, 3614 m a.s.l.)
and Koilu station (1960–1990) (70.0◦E, 42.2◦N, 2800 m a.s.l.) was 279 mm a−1 and 311 mm a−1, respectively (Reyers et al., 2013) with about 75 % occurring during sum-mer. Hence, IG is mostly of summer-accumulation type (Osmonov et al., 2013). No
20
longer-term precipitation measurement exists on the glacier itself and no information is available for the higher elevations. However, it can be estimated that the precipitation in the accumulation region is significantly higher than the measured values at these weather stations. The mean annual temperature is about−7.7◦C with January being
TCD
8, 2573–2610, 2014Elevation changes of Inylchek Glacier during 1974–2007
D. Shangguan et al.
Title Page
Abstract Introduction
Conclusions References
Tables Figures
◭ ◮
◭ ◮
Back Close
Full Screen / Esc
Printer-friendly Version Interactive Discussion
Discussion
P
a
per
|
Discus
sion
P
a
per
|
Discussion
P
a
per
|
Discussion
P
a
per
|
3 Data and methods
3.1 Remote sensing datasets
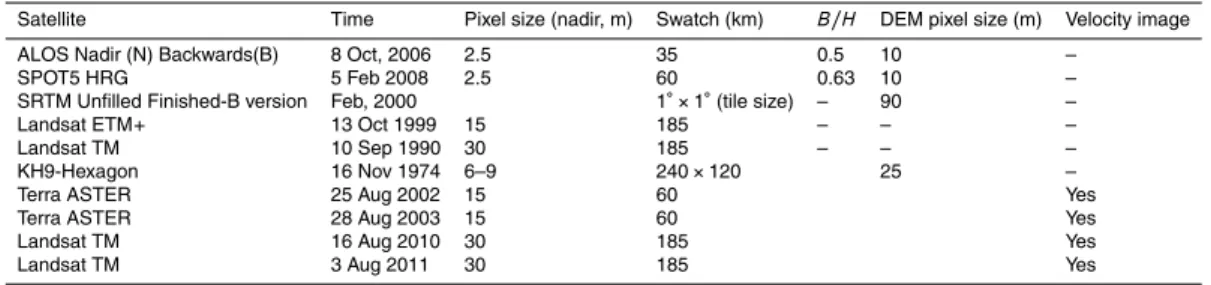
Declassified Hexagon KH-9, SRTM Unfilled Finished-B version, SPOT5-HRV, ALOS PRSIM, Terra ASTER and Landsat TM/ETM+ data were used to obtain information about the surface elevation, surface velocity and area extent of IG for different periods
5
(Table 1). The utilized data shall shortly be introduced in the following.
The KH9-Hexagon mission was part of the US keyhole reconaissance satellite pro-gram whose images were declassified in 2002 (Phil, 2013). The employed frame cam-era system was used on a total of 12 missions between 1973 and 1980. Each scene is characterized by a spatial resolution of about 20–30 feet (6–9 m) with 240 km×120 km 10
ground coverage. Due to the frame camera design (comparable to that of a Large Format Camera) Hexagon images are characterized by four fiducial marks and 1081 reseau crosses, which can be used to restore the image geometry at the time of image acquisition. For the KH9 missions the same film as for the KH4 mission with a film res-olution of about 85 line pairs mm−1was used. In our study we used Hexagon images
15
from mission 1209 flown in November 1974.
During the Shuttle Radar Topography Mission (SRTM) the Earth‘s surface was mea-sured by the use of two C-Band radar antennas in the period 11–22 February 2000. The SRTM data is available for free with a resolution of 3 arc-second (approximately 90 m). Yang et al. (2011) and Shortridge et al. (2011) reported an absolute vertical
20
accuracy of the final DEM is about 10 m. However, the accuracy in mountain terrain is likely worse (Gorokhovich et al., 2006). The original SRTM dataset has some data voids especially at high elevation, mountainous regions due to radar shadow and lay-over effects. Thus, large parts of the accumulation region are not covered by the SRTM DEM. Meanwhile the gaps in the SRTM4 data were filled with auxiliary data. However,
25
TCD
8, 2573–2610, 2014Elevation changes of Inylchek Glacier during 1974–2007
D. Shangguan et al.
Title Page
Abstract Introduction
Conclusions References
Tables Figures
◭ ◮
◭ ◮
Back Close
Full Screen / Esc
Printer-friendly Version Interactive Discussion
Discussion
P
a
per
|
Discus
sion
P
a
per
|
Discussion
P
a
per
|
Discussion
P
a
per
|
1999. The penetration of the C-band radar waves which will be 1–2 m on exposed ice, but can reach values up to 10 m on dry, cold firn (Rignot et al., 2001) needs to be taken into account.
SPOT5 was launched in May 2002 and is equipped with a High Resolution Stere-oscopy (HRS) instrument and two High Resolution Geometrical (HRG) instruments.
5
The HRS on SPOT5 offers the forward and backward view of the satellite in an along-track mode, provides panchromatic images with a ground sampling distance (GSD) of 10 m across and 5 m along the flight. The SPOT5-HRG instruments offer across-track stereo images with the viewing angle being adjustable through±27◦from two different
orbits (Toutin, 2006). Due to the precise onboard measurements of satellite positions
10
and attitudes of the SPOT5 orbit, each pixel in a SPOT5 image can be located on the ground with an accuracy of ±25 m on the 66 % confidence level without any ground
control points (GCPs) (Bouillon et al., 2006; Berthier et al., 2007). We used images ac-quired on 5 February 2008 with an incidence angle of−9.79◦and 24.94◦offering aB/H
about 0.63, which is suitable for DEM generation in high mountain areas (Toutin, 2009)
15
(Table 1). SPOT 5 HRG has a smallerB/H and GSD than SPOT 5 HRS. Thus, SPOT 5 HRG is more suitable than the HRS for the extraction of DEM in the study area. The contrast on the glacier of the utilized imagery is suitable for DEM generation. Glacier surfaces represent almost the end of ablation period of 2007 due to the acquisition in February 2008, a similar seasonal acquisition time to the SRTM DEM.
20
ALOS was launched in January 2006, carrying the PRISM optical sensor with the capability to observe the Earth surface with a spatial resolution of 2.5 m. The sensor operated in a triplet mode, i.e. three independent optical sensors acquire 35 km wide images in forward, nadir and backward views in along-track direction (Takaku et al., 2004). The viewing angle of the forward and backward sensors have an inclination
25
of±23.8◦ from nadir to realize aB/H-ratio of 1.0 while the B/H-ratio of forward and
TCD
8, 2573–2610, 2014Elevation changes of Inylchek Glacier during 1974–2007
D. Shangguan et al.
Title Page
Abstract Introduction
Conclusions References
Tables Figures
◭ ◮
◭ ◮
Back Close
Full Screen / Esc
Printer-friendly Version Interactive Discussion
Discussion
P
a
per
|
Discus
sion
P
a
per
|
Discussion
P
a
per
|
Discussion
P
a
per
|
information) can achieve an accuracy of better than 6.0 m (or 7.5 m in horizontal direc-tion and 2.5 m in vertical direcdirec-tion) without any GCPs (Takaku et al., 2004; Uchiyama et al., 2008). This high accuracy can even be further improved by using precise GCPs. In addition to the above mentioned imageries we used Landsat TM/ETM+and Terra ASTER to investigate the changes in glacier extent and to observe the glacier flow
5
(Table 1). Unfortunately only the southern branch was covered by the utilized ASTER scenes.
3.2 Glacier boundary
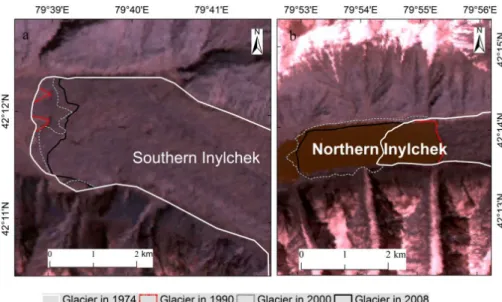
The glacier boundaries had to be delineated manually as both SPOT5 and KH9 are panchromatic images. Debris cover on the tongue of south IG made the accurate
iden-10
tification of the glacier margin difficult. However, water outlets from the southern IG tongue and the traces left after the river flow around the tongue are visible in the im-ages. We identified the lines of demarcation of the traces surrounding the debris cov-ered ice as glacier terminus boundary (Fig. 3a). For the northern IG terminus boundary the line of demarcation between the water and debris was used as the terminus
bound-15
ary of ice (Fig. 3b). A hillshade calculated based on the SRTM DEM provided additional information to detect the glacier boundary. The accuracy of the glacier outlines is dif-ficult to assess as appropriate reference data is not available for this glacier. Debris cover and spatial resolution are two key causes of uncertainty (Paul et al., 2013). We estimated the uncertainty using a buffer of 10 m for the Hexagon image (cf. Bolch et al.,
20
2010) and half a pixel for Landsat TM/ETM+. This led to an uncertainty of the mapped northern IG area of about 2.7 %, 1.8 %, 1.3 %, 0.5 % and southern IG area of 1.9 %, 1.3 %, 0.9 %, 0.3 % for the Landsat TM, KH-9, Landsat ETM+and SPOT5 images. The uncertainty of glacier area change is also evaluated considering the absolute change by using the buffer method (cf. Bolch et al., 2010). However, this uncertainty is probably
25
TCD
8, 2573–2610, 2014Elevation changes of Inylchek Glacier during 1974–2007
D. Shangguan et al.
Title Page
Abstract Introduction
Conclusions References
Tables Figures
◭ ◮
◭ ◮
Back Close
Full Screen / Esc
Printer-friendly Version Interactive Discussion
Discussion
P
a
per
|
Discus
sion
P
a
per
|
Discussion
P
a
per
|
Discussion
P
a
per
|
1974–2007. The uncertainty is largest between 1999–2007 (21.4 %) due to the little absolute change in area.
3.3 Flow velocity of southern Inylchek Glacier
To investigate the dynamic behaviour of southern IG, we measured glacier velocity rates using optical satellite imagery covering a time span of about one year. Using the
5
EXELIS VIS ENVI Add-on COSI-Corr a frequency based feature tracking (phase cor-relation) was performed in order to get the horizontal offset of corresponding image points. The relative offsets of the co-registered images feature the phase difference of the previously Fourier transformed input data and can be estimated by the correla-tion maximum (Leprince et al., 2007). For the 2010/2011 observacorrela-tion period offsets in
10
north-south- and east-west-direction were measured with an accuracy of 1/7 px us-ing quasi coregistered Landsat TM (L1T) data. For time period 2002/2003 we achieved a precision of 1/4 px based on 1/25 px-coregistered ASTER (L1A) data. As a final step a sound accuracy assessment has been performed. Uncertain classifications caused by clouds, topography and less image contrast have been removed from the
match-15
ing result. This resulted in a threshold of significance of 0.25 m a−1for 2002/2003 and 0.47 m a−1for 2010/2011.
3.4 DEM generation and data coverage
Both ALOS PRISM and the SPOT5 HRG were processed using Leica Photogrammetric Suite (LPS), vers. 2011 with the UTM WGS84 reference system. Four GCPs in both
20
ALOS and SPOT images were used to improve the accuracy of the exterior orientation. The reports of GCPs residuals are listed in Table 2. The automatically generated tie points (TPs) were visually checked to ensure accuracy. Overall, 120 TPs were used. The spatial resolution of the ALOS and SPOT5 DEM was chosen with 10 m.
Large parts of the accumulation region and more than 90 % of the glacier terrain with
25
TCD
8, 2573–2610, 2014Elevation changes of Inylchek Glacier during 1974–2007
D. Shangguan et al.
Title Page
Abstract Introduction
Conclusions References
Tables Figures
◭ ◮
◭ ◮
Back Close
Full Screen / Esc
Printer-friendly Version Interactive Discussion
Discussion
P
a
per
|
Discus
sion
P
a
per
|
Discussion
P
a
per
|
Discussion
P
a
per
|
also have only about 7 % in the accumulation region. Considering that the accuracy of the DEMs on plane surfaces (slopes smaller 15◦) is better than in mountain terrains evaluated by the State Bureau of Surveying and Mapping in China (SBSM, 2007), we only selected those region where slope is less than 15◦as the study region. In addition, regions in SPOT5 DEM influenced by cast shadows were also eliminated from the
5
final DEM. Considering the data gap in the accumulation region, it was not possible to properly calculate the mass balance of the glacier, but results on volume and elevation changes of the covered parts provide important insights into the glacier behaviour.
3.5 DEM postprocessing
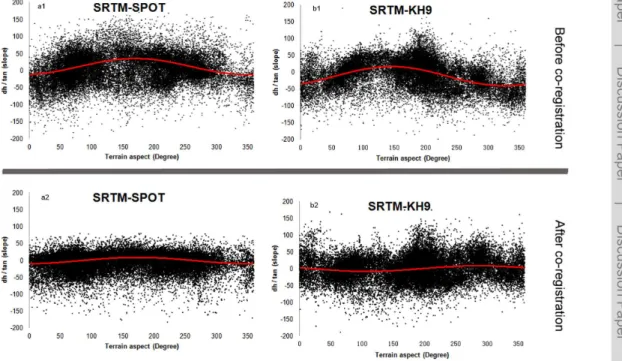
Important for the calculation of the glacier volume changes based on two different
10
DEMs is that they match relatively well to each other, hence possible horizontal shifts or vertical offsets are minimized (Nuth and Kääb, 2011; Pieczonka et al., 2013). Previ-ous studies have shown that the bias of two DEMs of the same terrain surface has a si-nusoidal relationship between elevation difference and aspect (Nuth and Kääb, 2011). We used the analytical method for co-registration based on the elevation difference and
15
aspect developed by Nuth and Kääb (2011) which has been proven to provide robust results and is computational effective (Paul et al., 2014). All DEMs were bilinearly re-sampled to the same cell size of 30 m. The resolution is a compromise between the possible higher resolution of Hexagon and SPOT5 DEMs and the lower resolution of the SRTM DEM. The shift vectors were calculated based on selected ice free sample
20
regions (Fig. 2). The resulting horizontal shifts were in the order of 1 pixel and the z-offsets varied between few meters and almost 20 m (Table 3).
3.6 Glacier elevation change and DEM uncertainty
The different DEMs were subtracted from each other to calculate the elevation dif-ferences (Fig. 4). Outliers identified by elevation difference values larger than 3σ are
25
TCD
8, 2573–2610, 2014Elevation changes of Inylchek Glacier during 1974–2007
D. Shangguan et al.
Title Page
Abstract Introduction
Conclusions References
Tables Figures
◭ ◮
◭ ◮
Back Close
Full Screen / Esc
Printer-friendly Version Interactive Discussion
Discussion
P
a
per
|
Discus
sion
P
a
per
|
Discussion
P
a
per
|
Discussion
P
a
per
|
2013) between 1999 and 2007. For the northern IG between 1974 and 1999 and be-tween 1974 and 2007, outliers were defined and excluded as follows: all values larger than the sum of the maximum elevation difference (which is larger than 3σ) in the surging region, standard deviation and mean of the elevation difference (Table 3). The biases of different DEMs in stable and no-glacierized regions after co-registration are
5
shown in Table 3.
In order to consider the penetration of the SRTM C band signal, we compared the DEMs derived from the SRTM-C-band and SRTM-X- Band Synthetic Aperture Radar which both cover the IG. The result showed that the mean penetration depth varies between 1.7 m in the lower but debris-free ablation area and about 4.3 m in the higher
10
accumulation area. We assume that there is no penetration in the debris-covered part of the glacier. The uncertainty of the radar penetration (erp) was estimated to be 1.9 m. The uncertainty of the DEM differencing was estimated by the normalized median absolute deviation (NMAD) in the ice free terrain which is assumed to be stable over time. Hence, the uncertainty of the DEM differencing will be calculated according to
15
Eq. (1).
e=
q
NMAD2+erp2 (1)
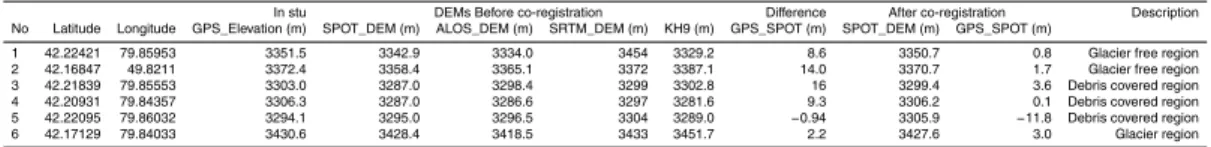
In order to verify the accuracy of the DEMs, we also randomly collected six GPS points by using Uni-Strong GPS-RTK in situ surveys in 2010. Among the GPS points, three
20
are in the debris covered region, 2 are in the glacier free region and one is in the glacier region (Table 4). The mean difference between GPS and SPOT DEM is−8.2 m
with standard deviation 6.6 m before co-registration. After co-registration, it is −0.4 m
with standard deviation 5.7 m. However, we cannot evaluate the bias of ablation in the debris covered region and the glacierized region between 2008 and 2010 and we also
25
TCD
8, 2573–2610, 2014Elevation changes of Inylchek Glacier during 1974–2007
D. Shangguan et al.
Title Page
Abstract Introduction
Conclusions References
Tables Figures
◭ ◮
◭ ◮
Back Close
Full Screen / Esc
Printer-friendly Version Interactive Discussion
Discussion
P
a
per
|
Discus
sion
P
a
per
|
Discussion
P
a
per
|
Discussion
P
a
per
|
3.6 m. This uncertainty included the glacier melt and glacier elevation changes between 2006 and 2007.
The elevation change from DEM differences was calculated based on the area-weighted average per 100 m elevation zone (cf. Xu et al., 2013; Fomula 2).
∆hgl=
Pn
i=belt1∆hi×si
sall zones
(2)
5
wherei is the number of zones,∆hi is mean glacier elevation change in i zone after considering the radar penetration, si is the area of i zone, n is the total number of zones, andsall zonesis the area of overall zones. The distal part of the tongue of south IG which is not covered by the SPOT5 DEM (Fig. 1) was filled with the ALOS DEM. We
10
used the elevation change per year as ALOS and SPOT5 were acquired at a different time.
4 Results
4.1 Glacier flow
We noticed high velocities with an average of about 120 m a−1 for the southern IG
to-15
wards the Merzbacher Lake while the remaining part of the debris-covered tongue below the lake has significantly lower velocities with decreasing rates and is even partly stagnant (Fig. 3). Hence, the main flow direction of the tongue is towards Lake Merzbacher and not to the end of the glacier tongue. Most tributaries have active flow until the confluence of the glacier with velocities varying typically between 30 and
20
60 m a−1. The general patterns and velocities are similar for both investigated
TCD
8, 2573–2610, 2014Elevation changes of Inylchek Glacier during 1974–2007
D. Shangguan et al.
Title Page
Abstract Introduction
Conclusions References
Tables Figures
◭ ◮
◭ ◮
Back Close
Full Screen / Esc
Printer-friendly Version Interactive Discussion
Discussion
P
a
per
|
Discus
sion
P
a
per
|
Discussion
P
a
per
|
Discussion
P
a
per
|
4.2 Glacier area change
Southern IG shrank continuously by about 0.1 km2, 0.5 km2 and 0.2 km2 during the periods 1974–1990, 1990–1999, and 1999–2007. The overall area loss of southern IG was 0.8±0.1 km2 during 1974 and 2007, accounting for ∼0.2 % of its area in 1974.
Northern IG lost an area of 1.2±0.1 km2during the period 1974–1990 followed by an 5
increase in area of 3.7±0.3 km2 (1990–1999). During this period the glacier showed
a strong advance of about 3.5 km. The glacier shrank again by 0.4±0.1 km2 in the
consecutive period (1999–2007). Overall, the area of northern IG increased by 2.0±
0.1 km2during 1974–2007, accounting for∼1.3 % of its area in 1974 (Fig. 4; Table 5).
Consequently, the area of the two branches of IG increased by 1.3±0.1 km2(∼0.2 %) 10
between 1974 and 2007.
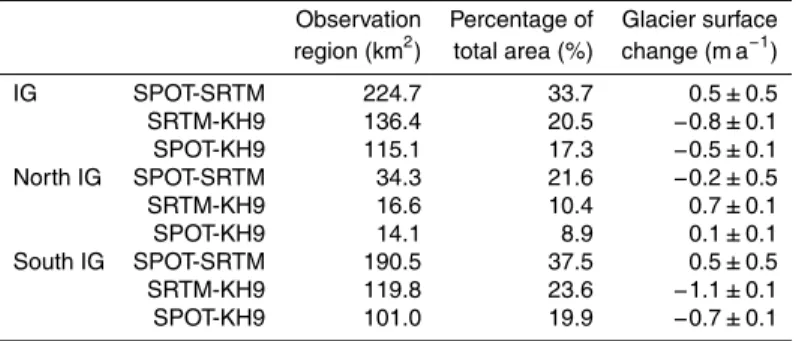
4.3 Glacier elevation change
On average, the investigated parts of IG thinned by−0.5±0.1 m a−1 during 1974 and
2007 (Table 6). However, for the recent period (1999–2007) we found a slight thicken-ing of 0.6±0.5 m a−1. The overall thickening is mainly due to a thickening in the higher 15
elevations above 4000 m a.s.l. in the accumulation zone while there was a slight low-ering at the distal parts of the tongue (Fig. 6). Between 1974 and 1999 a significant surface lowering was observed by−0.8±0.1 m a−1. Northern IG showed on average
no significant surface elevation change (0.1±0.1 m a−1) during 1974 and 2007 while
a significant lowering of 0.7±0.1 m a−1 was observed for southern IG. The significant 20
difference is due to the period 1974 to 1999 when a strong thickening of 0.7±0.1 m a−1
of northern IG was observed (Table 5). Taken the strong advance between 1990 and 1999, it can, hence, be assumed that northern IG was surging during this period. After 1999 a slight thinning by 0.2±0.5 m a−1was measured for the northern IG while
south-ern IG showed thickening by 0.5±0.5 m a−1. However, both northern and southern IG 25
TCD
8, 2573–2610, 2014Elevation changes of Inylchek Glacier during 1974–2007
D. Shangguan et al.
Title Page
Abstract Introduction
Conclusions References
Tables Figures
◭ ◮
◭ ◮
Back Close
Full Screen / Esc
Printer-friendly Version Interactive Discussion
Discussion
P
a
per
|
Discus
sion
P
a
per
|
Discussion
P
a
per
|
Discussion
P
a
per
|
The analysis of the vertical changes (Fig. 6) in different elevation zones and along the main flow line (Fig. 7) for southern IG and northern IG allow more detailed insights into the characteristics of the behaviour of the glacier. Almost all parts of southern IG tongue which is covered by the DEMs showed a surface lowering for the periods 1974– 1999 and 1974–2007 while there was no significant elevation change in the upper
5
parts of the glacier for 1999–2007 (close to point a, Fig. 7). Interestingly, there are large amplitudes in elevation change between point c and point b (Fig. 7) which is the heavily debris-covered part below Lake Merzbacher with low flow velocities (Fig. 4). On average, the elevation change was 0.4±0.1–0.6±0.1 m a−1 below an altitude of
3200 m a.s.l. for the period 1974–1999 and 0.5±0.1–0.6±0.1 m a−1below an altitude of 10
3400 m a.s.l. for the period 1974–2007 (Fig. 6). Between point b and a, a clear surface lowering could be observed for 1974–1999 and 1974–2007 while no significant surface elevation changes or even a slight increase could be measured considering the 1999– 2007 period only (Figs. 5–7); between the altitude of 3400–4000 m elevation thinning varied between 0.2±0.1 and 1.4±0.1 m a−1 m for the period 1974–1999 and 0.3± 15
0.1–1.2±0.1 m a−1 for the period 1974–2007. This phenomena is similar with West
Qongterang Glacier where a surface lowering occurred in the upper part of the ablation region (Pieczonka et al., 2013). We also identified that most of the elevation changes are positive above altitude∼4000 m (point a) for 1999–2007 (Fig. 6). Above this altitude
a surface lowering was measured for the period 1974–1999 (Fig. 6) while an elevation
20
increase was measured for the period 1999–2007. However, the overall trend is still negative for the entire investigation period.
Northern IG showed a different behaviour. A clear thickening of more than 100 m was observed at the glacier tongue for the period before 1999 while a slight thinning of∼
15 m was measured thereafter. We noticed a maximum thickening of∼150 m between 25
3300 and 3600 m a.s.l. in the period 1974–1999 (Figs. 6 and 7), while a section of the upper part (∼9 km from the terminus) has clearly lost mass. The upper part is not
TCD
8, 2573–2610, 2014Elevation changes of Inylchek Glacier during 1974–2007
D. Shangguan et al.
Title Page
Abstract Introduction
Conclusions References
Tables Figures
◭ ◮
◭ ◮
Back Close
Full Screen / Esc
Printer-friendly Version Interactive Discussion
Discussion
P
a
per
|
Discus
sion
P
a
per
|
Discussion
P
a
per
|
Discussion
P
a
per
|
and 2007 the covered part of the glacier tongue showed a mean thinning of 1.7±
0.5 m a−1(Fig. 7) while a thickening is visible∼18 km from the terminus above 3900 m
elevation zones (Figs. 5–7).
5 Discussion
Osmonov et al. (2013) reported an average shrinkage of 3.7±2.7 % from 1990 to 5
2010 with 10 advancing glaciers in the upper of Aksu catchment. The glacier retreat in adjacent regions during the last decades varied between 3.3 % to∼30 % (Bolch et al.,
2007; Aizen et al., 2006; Liu et al., 2006) with highest shrinkage rates in the outer and more humid ranges and the lowest in the inner and drier ranges (Sorg et al., 2012; Narama et al., 2010). In western China including the Chinese Part of the Tian Shan
10
more than 80 % of the glaciers were in retreat with some glaciers in an advancing phase (Ding et al., 2006). Our study revealed only a slight retreat of southern IG for 1974 and 2007 while a strong advance for northern IG between 1990 and 2000 could be identified. Our result is in tendency in agreement with Osmonov et al. (2013). However, the authors considered southern and northern IG including Lake Merzbacher as one
15
glacier, the overall value was different and the surge was not detected.
Our observed flow characteristics of southern IG is in good agreement with the existing information (Nobakht et al., 2014; Li et al., 2013) for similar years. The ob-served velocity of ∼120 m a−1 for the main tongue is close to the measurements by
Nobakht et al. (2014) who reported values of 0.3–0.4 m day−1 (∼100–150 m a−1)
cal-20
culated based on ASTER and Landsat data but larger than 0.2 m day−1 (∼75 m a−1)
as obtained by Li et al., 2013) based on ALOS PALSAR data. Mayer et al. (2008) also measured velocity rates of up to 80–90 m a−1
closer to the lake in the period 2003/2004 which is in good correspondence with our velocity measurements of 75–90 m a−1(0.2– 0.4 m day−1) in the observation period 2002/2003 for the similar area. High velocities
25
TCD
8, 2573–2610, 2014Elevation changes of Inylchek Glacier during 1974–2007
D. Shangguan et al.
Title Page
Abstract Introduction
Conclusions References
Tables Figures
◭ ◮
◭ ◮
Back Close
Full Screen / Esc
Printer-friendly Version Interactive Discussion
Discussion
P
a
per
|
Discus
sion
P
a
per
|
Discussion
P
a
per
|
Discussion
P
a
per
|
(Fig. 7) for 1999–2007. Glacier calving could be observed for southern IG with mean velocities of up to 0.4 m day−1 between 2009 and 2010 (cf. Fig. 5c) (Nobakht et al., 2014). This means that the presence of glacier dammed lakes is influencing the ice dynamics (cf. Mayer et al., 2008) and the mass change of a glacier.
Existing in-situ mass balance measurements in the Tian Shan showed clearly
nega-5
tive values since the beginning of the measurements in the 1960s (WGMS 2013; Sorg et al., 2012) and studies based on GRACE and ICESat laser altimetry data (Jacob et al., 2012; Gardner et al., 2013) pointed out that on average glaciers in the Tian Shan underwent clear mass loss between 2003–2009 but with a lower rate compared to the observed in-situ data. Geodetic mass balance measurements of 12 mainly
debris-10
covered glaciers south of Pik Pobeda/Tomur Peak close to our study area revealed that most of the glaciers have been losing mass with rates between−0.08±0.15 m w.e. a−1
and −0.80±0.15 m w.e. a−1 for the time period 1976–2009. However, two glaciers
gained mass and one glacier (Qingbingtan Glaicer No.74) showed signs of a surge similar to northern IG (Pieczonka et al., 2013). The mass loss was lower during the
15
last decade (1999–2009) than during 1974 and 1999. This tendency is in line with our results for IG where a glacier thinning was found during 1974–1999 with strong thick-ening between 4400 and 5300 m a.s.l. followed by non-significant elevation changes between 1999 and 2007 (Fig. 5). Unfortunately, the data coverage above an altitude larger than 4000 m a.s.l. is less than 10 % of the glacier area for the periods 1974–
20
1999 and 1974–2007 due to Hexagon KH-9 coverage which hampered to investigate the overall glacier’s elevation change and assess the glaciers mass balance. In order to estimate the mass change of entire southern IG mass balance we assumed different scenarios to fill the data gaps: on the one hand no elevation change and on the other hand a thickening of the mean elevation change value of the covered parts of the
accu-25
mulation region (13 m) for period 1999–2007. The mass balance values vary between 0.28 and 0.60 m w.e. a−1assuming a density of 850±60 kg m−3for the conversion of the
TCD
8, 2573–2610, 2014Elevation changes of Inylchek Glacier during 1974–2007
D. Shangguan et al.
Title Page
Abstract Introduction
Conclusions References
Tables Figures
◭ ◮
◭ ◮
Back Close
Full Screen / Esc
Printer-friendly Version Interactive Discussion
Discussion
P
a
per
|
Discus
sion
P
a
per
|
Discussion
P
a
per
|
Discussion
P
a
per
|
was clearly negative. Even assuming a large span of possible elevation changes in the non-covered areas between−20 and 20 m would not significantly alter the mass
bud-get: the values are between−0.60 and−0.42 m w.e. a−1for the period 1974–2007 and −0.73 and−1.00 m w.e. a−1for 1974–1999. The data gaps are even larger for northern
IG so that a suitable mass balance estimate is not possible. However, the obtained
5
characteristics for the surface elevation change with a clear thickening at the tongue and a lowering in higher reaches (Fig. 6) together with the data of area and length change are a clear indicator for a surge event that happened between 1990 and 1999 Surging glaciers in the Tian Shan were also reported by Narama et al. (2010), Os-monov et al. (2013), Pieczonka et al. (2013) and, for earlier times, by Dolgushin and
10
Osipova (1975), hence this phenomenon is also in the Tien Shan not infrequent. The surge event of northern IG described by Mavlyudov (1998) probably happened in late 1996 with an advance of about two kilometres (Häusler et al., 2011). However, it was a non-typical surging event due to the lack of surge characteristics such as areas of stretched ogives, erosion scars, transverse crevasses or breaching structures; Hodkins
15
et al. (2009) described this phenomenon as partial surges. Cuffey and Paterson (2010) pointed out that mass displacement down-glacier is an important signal that occurs before a glacier surge. This result also showed that glacier surging will re-distribute the glacier mass.
Both of parts of ablation regions of southern IG and northern IG are covered by
20
debris below∼3500 m a.s.l. The surface of southern IG showed considerable lowering
rates but also great variability for the time period of 1974–1999 and 1974–2007. The surface lowering is higher at the frontal part of southern IG where low flow velocity is measured. This is in line with several other studies which found significant mass loss despite thick debris cover (Bolch et al., 2011; Kääb et al., 2012; Nuimura et al., 2012;
25
TCD
8, 2573–2610, 2014Elevation changes of Inylchek Glacier during 1974–2007
D. Shangguan et al.
Title Page
Abstract Introduction
Conclusions References
Tables Figures
◭ ◮
◭ ◮
Back Close
Full Screen / Esc
Printer-friendly Version Interactive Discussion
Discussion
P
a
per
|
Discus
sion
P
a
per
|
Discussion
P
a
per
|
Discussion
P
a
per
|
tongue below the Lake Merzbacher indicates that there was little mass supplied from upstream. Therefore, the significant mass loss can be explained by the influence of backwasting at ice cliffs and melting at supraglacial ponds (Fujita and Sakai, 2010; Han et al., 2010; Juen et al., 2014) but likely also due to reduced glacier flow from the accumulation region and englacial conduits (Quincey et al., 2009; Schomacker, 2008;
5
Benn et al., 2012).
Measurements at the Tian Shan station (3614 m a.s.l.) located 120 km west of IG suggested that both increasing temperature and decreasing precipitation were de-tected during the ablation season (May–September) for the period 1970–1996; and a decreasing temperature and slight decreasing precipitation was found also in the
ab-10
lation season for the period of 1997–2009 (Osmonov et al., 2013). Hence, the observed glacier thinning between 1974 and 1999 is most likely a consequence of the ablation season warming and precipitation decreasing which led to an accelerated melting and decelerated accumulation. Reduced mass loss or even the possible balanced condition between 1999 and 2007 could be explained by the temperature decrease.
15
6 Conclusion
We investigated the velocity, glacier area and surface elevation changes of Inylchek Glacier from 1974 to 2007 based on various space-borne data such as KH9 Hexagon, Landsat and SPOT5 HRG data. Our results show that southern IG has a velocity of about 100 m a−1 for large parts of the tongue with a main flow direction towards
20
Lake Merzbacher and low velocity with stagnancy at the terminus below the lake. The glacier shrank slightly during the time of 1974, 1990, 1999 and 2007; while northern IG was surging between 1990 and 1999 which caused an overall area increase of both branches of IG of 1.3±0.1 km2(∼0.2 %) between 1974 and 2007 despite a shrinking
of northern IG before 1990 and after 1999. The generated DEMs from 1974 and 2007
25
TCD
8, 2573–2610, 2014Elevation changes of Inylchek Glacier during 1974–2007
D. Shangguan et al.
Title Page
Abstract Introduction
Conclusions References
Tables Figures
◭ ◮
◭ ◮
Back Close
Full Screen / Esc
Printer-friendly Version Interactive Discussion
Discussion
P
a
per
|
Discus
sion
P
a
per
|
Discussion
P
a
per
|
Discussion
P
a
per
|
were covered hindering to assess the mass balance for the entire IG. The tendency is clear nevertheless: a thinning of southern IG of −0.8±0.1 m a−1 for the period of
1974–1999 was followed by a possible thickening of 0.5±0.5 m a−1for 1999–2007 with
an overall elevation difference of −0.5±0.1 m a−1 for the entire period of 1974–2007
despite thick debris cover. The lowering is highest at the distal part of the tongue with
5
low velocity. A clear thickening of up to ∼150 m was found for northern IG. An
out-burst flood from Lake Merzbacher occurs almost every year and ice from southern IG is collapsing into the lake. Thus, glacier thinning and glacier flow close to the dam was influence by Lake Merzbacher and more detailed investigations are needed to under-stand the influence of this lake to the glaciers mass balance besides debris cover and
10
climate change.
Acknowledgements. This work was supported by the Ministry of Science and Technology of the People’s Republic of China (Grant 2013CBA01808); State Key Laboratory of Cryospheric Sciences (SKLCS-ZZ-2012–00-02); the National Natural Science Foundation of China (Grant: 41271082 and 41030527); the CAS Strategic Priority Research Program-Climate Change:
Car-15
bon Budget and Relevant Issue (Grant No. XDA05090302), German Research Foundation (Deutsche Forschungsgemeinschaft, DFG, code BO 3199/2-1) and the German Ministry of Education and Science (BMBF: Code 01 LL 0918 B). China Scholarship Council supported the research stay of the first author at University of Zurich. We also thank the groups of Bolot Moldobekov from Central-Asia Institute for Applied Geosciences (CAIAG) for supporting our
20
field work in 2010 and 2012. ASTER GDEM and SRTM is a product of METI and NASA. We thanks DLR for allowing free access to SRTM X-band data and USGS for SRTM C-band data, Landsat archive.
References
Aizen, V. B., Aizen, E. M., Melack, J. M., and Dozier, J.: Climatic and Hydrologic Changes in
25
TCD
8, 2573–2610, 2014Elevation changes of Inylchek Glacier during 1974–2007
D. Shangguan et al.
Title Page
Abstract Introduction
Conclusions References
Tables Figures
◭ ◮
◭ ◮
Back Close
Full Screen / Esc
Printer-friendly Version Interactive Discussion
Discussion
P
a
per
|
Discus
sion
P
a
per
|
Discussion
P
a
per
|
Discussion
P
a
per
|
Aizen, V. B., Kuzmichenok, V. A., Surazakov, A. B., and Aizen, E. M.: Glacier changes in the central and northern Tien Shan during the last 140 years based on surface and remote-sensing data, Ann. Glaciol., 43, 202–213, 2006.
Aizen, V. B., Aizen, E. M., and Kuzmichonok, V. A.: Glaciers and hydrological changes in the Tien Shan: simulation and prediction, Environ. Res. Lett., 2, 045019,
doi:10.1088/1748-5
9326/2/4/045019, 2007.
Benn, D. I., Bolch, T., Hands, K., Gulley, J., Luckman, A., Nicholson, L. I., Quincey, D., Thomp-son, S., Toumi, R., and Wiseman, S.: Response of debris-covered glaciers in the Mount Everest region to recent warming, and implications for outburst flood hazards, Earth-Sci. Rev., 114, 156–174, doi:10.1016/j.earscirev.2012.03.008, 2012.
10
Berthier, E., Arnaud, Y., Kumar, R., Ahmad, S., Wagnon, P., and Chevallier, P.: Remote sensing estimates of glacier mass balances in the Himachal Pradesh (Western Himalaya, India), Remote Sens. Environ., 108, 327–338, doi:10.1016/j.rse.2006.11.017, 2007.
Berthier, E., Schiefer, E., Clarke, G. K. C., Menounos, B., and Remy, F.: Contribution of Alaskan glaciers to sea-level rise derived from satellite imagery, Nat. Geosci., 3, 92–95,
15
doi:10.1038/NGEO737, 2010.
Bolch, T.: Climate change and glacier retreat in northern Tien Shan (Kazakhstan/Kyrgyzstan) using remote sensing data, Glob. Planet. Change, 56, 1–12, 2007.
Bolch, T., Buchroithner, M., Pieczonka, T., and Kunert, A.: Planimetric and volumetric glacier changes in the Khumbu Himal, Nepal, since 1962 using Corona, Landsat TM and ASTER
20
data, J. Glaciol., 54, 592–600, doi:10.3189/002214308786570782, 2008.
Bolch, T., Menounos, B., and Wheate, R.: Landsat-based inventory of glaciers in western Canada, 1985–2005, Remote Sens. Environ., 114, 127–137, 2010.
Bolch, T., Pieczonka, T., and Benn, D. I.: Multi-decadal mass loss of glaciers in the Everest area (Nepal Himalaya) derived from stereo imagery, The Cryosphere, 5, 349–358,
doi:10.5194/tc-25
5-349-2011, 2011.
Bouillon, A., Bernard, M., Gigord, P., Orsoni, A., Rudowski, V., and Baudoin, A.: SPOT 5 HRS geometric performances: using block adjustment as a key issue to improve quality of DEM generation, ISPRS J. Photogramm., 60, 134–146, doi:10.1016/j.isprsjprs.2006.03.002, 2006.
30
TCD
8, 2573–2610, 2014Elevation changes of Inylchek Glacier during 1974–2007
D. Shangguan et al.
Title Page
Abstract Introduction
Conclusions References
Tables Figures
◭ ◮
◭ ◮
Back Close
Full Screen / Esc
Printer-friendly Version Interactive Discussion
Discussion
P
a
per
|
Discus
sion
P
a
per
|
Discussion
P
a
per
|
Discussion
P
a
per
|
Ding, Y., Liu, S., Li, J., and Shangguan, D.: The retreat of glaciers in response to recent climate warming in western China, Ann. Glaciol., 43, 97–105, 2006.
Gardelle, J., Berthier, E., Arnaud, Y., and Kääb, A.: Region-wide glacier mass balances over the Pamir-Karakoram-Himalaya during 1999–2011, The Cryosphere, 7, 1263–1286, doi:10.5194/tc-7-1263-2013, 2013.
5
Gardner, A. S., Moholdt, G., Cogley, J. G., Wouters, B., Arendt, A. A., Wahr, J., Berthier, E., Hock, R., Pfeffer, W. T., Kaser, G., Ligtenberg, S. R. M., Bolch, T., Sharp, M. J., Hagen, J. O., van den Broeke, M. R., and Paul, F.: A reconciled estimate of glacier contributions to sea level rise: 2003 to 2009, Science, 340, 852–857, doi:10.1126/science.1234532, 2013. Glazirin, G. E.: A century of investigations on outbursts of the ice-dammed lake Merzbacher
10
(central Tien Shan), Austrian Journal of Earth Sciences, 103, 171–178, 2010.
Gorokhovich, Y. and Voustianiouk, A.: Accuracy assessment of the processed SRTM-based elevation data by CGIAR using field data from USA and Thailand and its relation to the terrain characteristics, Remote Sens. Environ., 104, 409–415, doi:10.1016/j.rse.2006.05.012, 2006. Hagg, W., Mayer, C., Lambrecht, A., and Helm, A.: Sub-debris melt rates on southern Inylchek
15
Glacier, Central Tian Shan., Geogr. Ann. A, 90, 55–63, 2008.
Han, H., Wang, J., Wei, J., and Liu, S.: Backwasting rate on debris-covered Koxkar glacier, Tuo-muer mountain, China, J. Glaciol., 56, 287–296, doi:10.3189/002214310791968430, 2010. Hausler, H., Scheibz, J., Leber, B., Kopecny, A., Echtler, H., Wetzel, H.-U., and Moldobekov, B.:
Results from the 2009 geoscientific expedition to the Inylchek glacier, Central Tien Shan
20
(Kyrgyzstan), Austrian Journal of Earth Sciences, 104, 47–57, 2011.
Hodgkins, R., Fox, A., and Nuttall, A.-M.: Geometry change between 1990 and 2003 at Finster-walderbreen a Svalbard surge-type glacier, from GPS profiling, Ann. Glaciol., 46, 131–135, 2007.
Huss, M.: Density assumptions for converting geodetic glacier volume change to mass change,
25
The Cryosphere, 7, 877–887, doi:10.5194/tc-7-877-2013, 2013.
Jacob, T., Wahr, J., Pfeffer, W. T., and Swenson, S.: Recent contributions of glaciers and ice caps to sea level rise, Nature, 482, 514–518, doi:10.1038/nature10847, 2012.
Leprince, S., Barbot, S., Ayoub, F., and Avouac, J. P.: Automatic and precise orthorectification, coregistration, and subpixel correlation of satellite images, application to ground deformation
30
TCD
8, 2573–2610, 2014Elevation changes of Inylchek Glacier during 1974–2007
D. Shangguan et al.
Title Page
Abstract Introduction
Conclusions References
Tables Figures
◭ ◮
◭ ◮
Back Close
Full Screen / Esc
Printer-friendly Version Interactive Discussion
Discussion
P
a
per
|
Discus
sion
P
a
per
|
Discussion
P
a
per
|
Discussion
P
a
per
|
Li Jia, L. Z.-W., Wang, C.-C., Zhu, J.-J., and Ding, X.-L.: Using SAR offset-tracking approach to estimate surface motion of the South Inylchek Glacier in Tianshan, Chinese J. Geophys., 56, 1226–1236, 2013.
Li, X., Cheng, G., Jin, H., Kang, E., Che, T., Jin, R., Wu, L., Nan, Z., Wang, J., and Shen, Y.: Cryospheric change in China, Glob. Planet. Change, 62, 210–218,
5
doi:10.1016/j.gloplacha.2008.02.001, 2008.
Liu, S. Y., Ding, Y. J., Shangguan, D. H., Zhang, Y., Li, J., Han, H. D., Wang, J., and Xie, C. W.: Glacier retreat as a result of climate warming and increased precipitation in the Tarim river basin, northwest China, Ann. Glaciol., 43, 91–96, 2006.
Mayer, C., Hagg, W., Lambrecht, A., Helm, A. and Scharrer, K.: Post-drainage ice dam response
10
at Lake Merzbacher, Inylchek glacier, Kyrgyzstan, Geograf. Ann., 90, 87–96, 2008.
Narama, C., Kääb, A., Duishonakunov, M., and Abdrakhmatov, K.: Spatial variability of recent glacier area changes in the Tien Shan Mountains, Central Asia, using Corona (∼1970), Landsat (∼2000), and ALOS (∼2007) satellite data, Glob. Planet. Change, 71, 42–54, doi:10.1016/j.gloplacha.2009.08.002, 2010.
15
Ng, F., Liu, S., Mavlyudov, B., and Wang, Y.: Climateic control on the peak discharge of glacier outburst floods, Geophys. Res. Lett., 34, L21503, doi:10.1029/2007GL031426, 2007. Nobakht, M., Motagh, M., Wetzel, H.-U., Roessner, S., and Kaufmann, H.: The Inylchek Glacier
in Kyrgyzstan, Central Asia: insight on surface kinematics from optical remote sensing im-agery, Remote Sensing, 6, 841–856, 2014.
20
Nuimura, T., Fujita, K., Yamaguchi, S., and Sharma, R. R.: Elevation changes of glaciers re-vealed by multitemporal digital elevation models calibrated by GPS survey in the Khumbu region, Nepal Himalaya, 1992–2008, J. Glaciol., 58, 648–656, doi:10.3189/2012JoG11J061, 2012.
Nuth, C. and Kääb, A.: Co-registration and bias corrections of satellite elevation data sets for
25
quantifying glacier thickness change, The Cryosphere, 5, 271–290, doi:10.5194/tc-5-271-2011, 2011.
Osmonov, A., Bolch, T., Xi, C., Kurban, A., and Guo, W.: Glacier characteristics and changes in the Sary-Jaz River Basin (Central Tien Shan, Kyrgyzstan) – 1990–2010, Remote Sensing Letters, 4, 725–734, doi:10.1080/2150704x.2013.789146, 2013.
30
TCD
8, 2573–2610, 2014Elevation changes of Inylchek Glacier during 1974–2007
D. Shangguan et al.
Title Page
Abstract Introduction
Conclusions References
Tables Figures
◭ ◮
◭ ◮
Back Close
Full Screen / Esc
Printer-friendly Version Interactive Discussion
Discussion
P
a
per
|
Discus
sion
P
a
per
|
Discussion
P
a
per
|
Discussion
P
a
per
|
Paul, F., Kääb, A., Maisch, M., Kellenberger, T., and Haeberli, W.: Rapid disintegra-tion of Alpine glaciers observed with satellite data, Geophys. Res. Lett., 31, L21402, doi:10.1029/2004gl020816, 2004.
Paul, F., Barrand, N. E., Berthier, E., Bolch, T., Casey, K., Frey, H., Joshi, S. P., Konovalov, V., Bris, P. L., Molg, N., NOsenko, G., Nuth, C., Pope, A., Racoviteanu, A., Rastner, P., Raup, B.,
5
and Scharrer, K.: On the accuracy of glacier outlines derived from remote-sensing data, Ann. Glaciol., 54, 171–182, doi:10.3189/2013AoG63A296, 2013.
Paul, F., Bolch, T., Kääb, A., Nagler, T., Nuth, C., Scharrer, K., Shepherd, A., Strozzi, T., Tic-coni, F., Bhambri, R., Berthier, E., Bevan, S., Gourmelen, N., Heid, T., Jeong, S., Kunz, M., Lauknes, T. R., Luckman, A., Merryman, J., Moholdt, G., Muir, A., Neelmeijer, J., Rankl, M.,
10
VanLooy, J., and Van Niel, T.: The glaciers climate change initiative: methods for creat-ing glacier area, elevation change and velocity products, Remote Sens. Environ., in press, doi:10.1016/j.rse.2013.07.043, 2014.
Piao, S., Ciais, P., Huang, Y., Shen, Z., Peng, S., Li, J., Zhou, L., Liu, H., Ma, Y., Ding, Y., Friedlingstein, P., Liu, C., Tan, K., Yu, Y., Zhang, T., and Fang, J.: The
im-15
pacts of climate change on water resources and agriculture in China, Nature, 467, 43–51, doi:10.1038/nature09364, 2010.
Pieczonka, T., Bolch, T., Junfeng, W., and Shiyin, L.: Heterogeneous mass loss of glaciers in the Aksu-Tarim Catchment (Central Tien Shan) revealed by 1976 KH-9 Hexagon and 2009 SPOT-5 stereo imagery, Remote Sens. Environ., 130, 233–244, 2013.
20
Pressel, P.: Meeting the Challenge: The Hexagon KH-9 Reconnaissance Satellite, American Institute of Aeronautics and Astronautics, Inc., Reston, Virginia, 2013.
Quincey, D. J., Copland, L., Mayer, C., Bishop, M., Luckman, A., and Belo, M.: Ice velocity and climate variations for Baltora Glacier, Pakistan, J. Glaciol., 55, 1061–1071, 2009.
Reyers, M., Pinto, J. G., and Paeth, H.: Statistical–dynamical downscaling of present day and
fu-25
ture precipitation regimes in the Aksu river catchment in Central Asia, Glob. Planet. Change, 107, 36–49, doi:10.1016/j.gloplacha.2013.04.003, 2013.
Rignot, E., Echelmeyer, K., and Krabill, W.: Penetration depth of interferometric synthetic-aperture radar signals in snow and ice, Geophys. Res. Lett., 28, 3501–3504, doi:10.1029/2000gl012484, 2001.
30
TCD
8, 2573–2610, 2014Elevation changes of Inylchek Glacier during 1974–2007
D. Shangguan et al.
Title Page
Abstract Introduction
Conclusions References
Tables Figures
◭ ◮
◭ ◮
Back Close
Full Screen / Esc
Printer-friendly Version Interactive Discussion
Discussion
P
a
per
|
Discus
sion
P
a
per
|
Discussion
P
a
per
|
Discussion
P
a
per
|
Shen, Y. P., Wang, G. Y., Ding, Y. J., Mao, W. Y., Liu, S. Y., Wang, S. D., and Mamatkanov, D. M.: Changes in glacier mass balance in watershed of sary Jaz-Kumarik Rivers of Tianshan Mountains in 1957–2006 and their impact on water resources and trend to end of the 21th century, J. Glaciol. Geocryol., 31, 792–801, 2009 (in Chinese with English abstract).
Shortridge, A. and Messina, J.: Spatial structure and landscape associations of SRTM error,
5
Remote Sens. Environ., 115, 1576–1587, doi:10.1016/j.rse.2011.02.017, 2011.
Shukla, A., Arora, M. K., and Gupta, R. P.: Synergistic approach for mapping debris-covered glaciers using optical-thermal remote sensing data with inputs from geomorphometric pa-rameters, Remote Sens. Environ., 114, 1378–1387, 2010.
Sorg, A., Bolch, T., Stoffel, M., Solomina, O., and Beniston, M.: Climate change impacts
10
on glaciers and runoff in Tien Shan (Central Asia), Nature Climate Change, 2, 725–731, doi:10.1038/nclimate1592, 2012.
State Bureau of Surveying and Mapping (SBSM): Technical rules for producing digital prod-ucts of 1 : 10 000 1 : 50 000 fundamental geographic information, CH/T 1015.1-2007, State Bureau of Surveying and Mapping, Beijing, 2007.
15
Takaku, J., Futamura, N., Iijima, T., Tadono, T., Shimada, M., and Shibasaki, R.: High resolution DEM generation from ALOS PRISM data – simulation and evaluation, Geoscience and Re-mote Sensing Symposium, 2004. IGARSS ’04. Proceedings 2004, IEEE International, vol. 4547, 4548–4551, 20–24 September 2004.
Toutin, T.: Generation of DSMs from SPOT-5 in-track HRS and across-track HRG stereo
20
data using spatiotriangulation and autocalibration, ISPRS J. Photogramm., 60, 170–181, doi:10.1016/j.isprsjprs.2006.02.003, 2006.
Uchiyama, Y., Honda, M., Mizuta, Y., Otsuka, K., Ishizeki, T., Okatani, T., and Tamura, E.: Re-vising 1 : 25 000-Scale topographic maps using ALOS/PRISM Imagery, Bulletin of the Geo-graphical Survey Institute, 56, 1–15, 2008.
25
USGS: Shuttle Radar Topography Mission, 3 Arc Second scene, Unfilled finished B, Global Land Cover Facility, University of Maryland, College Park, Maryland, February 2000, 2006. WGMS: Fluctuations of Glaciers Database, World Glacier Monitoring Service, Zurich,
Switzer-land, doi:10.5904/wgms-fog-2013-11, 2013.
Xu, J., Liu, S., Zhang, S., Guo, W., and Wang, J.: Recent changes in glacial area and
30
TCD
8, 2573–2610, 2014Elevation changes of Inylchek Glacier during 1974–2007
D. Shangguan et al.
Title Page
Abstract Introduction
Conclusions References
Tables Figures
◭ ◮
◭ ◮
Back Close
Full Screen / Esc
Printer-friendly Version Interactive Discussion
Discussion
P
a
per
|
Discus
sion
P
a
per
|
Discussion
P
a
per
|
Discussion
P
a
per
|
Table 1.List of applied satellite images and data sources.
Satellite Time Pixel size (nadir, m) Swatch (km) B/H DEM pixel size (m) Velocity image ALOS Nadir (N) Backwards(B) 8 Oct, 2006 2.5 35 0.5 10 –
SPOT5 HRG 5 Feb 2008 2.5 60 0.63 10 – SRTM Unfilled Finished-B version Feb, 2000 1◦
×1◦(tile size) – 90 –
TCD
8, 2573–2610, 2014Elevation changes of Inylchek Glacier during 1974–2007
D. Shangguan et al.
Title Page
Abstract Introduction
Conclusions References
Tables Figures
◭ ◮
◭ ◮
Back Close
Full Screen / Esc
Printer-friendly Version Interactive Discussion
Discussion
P
a
per
|
Discus
sion
P
a
per
|
Discussion
P
a
per
|
Discussion
P
a
per
|
Table 2.RMSE for GCPs of ALOS and SPOT5 data.
ALOS SPOT5
No.GCPs 4 4
RMSEx 0.99 m 1.4 m
RMSEy 2.15 m 1.3 m
TCD
8, 2573–2610, 2014Elevation changes of Inylchek Glacier during 1974–2007
D. Shangguan et al.
Title Page
Abstract Introduction
Conclusions References
Tables Figures
◭ ◮
◭ ◮
Back Close
Full Screen / Esc
Printer-friendly Version Interactive Discussion
Discussion
P
a
per
|
Discus
sion
P
a
per
|
Discussion
P
a
per
|
Discussion
P
a
per
|
Table 3.Shift vectors inx,yandzdirection and DEM uncertainty.
Shift vectors in Before co-registration After Normalized median Uncertainty
x,yandzdirection with glacier free co-registation absolute deviation (m) (m)
X Y Z Mean elevation Standard Mean elevation Standard
(m) (m) (m) difference (m) deviation (STD) (m) difference (m) deviation (m)
SRTM->SPOT 18.7 −46.5 1.3 6.8 20.8 0.4 13.0 1.0 2.1
SRTM->KH9 34.3 27.3 −5.3 −2.0 18.1 −1.0 15.3 0.5 2.0
SPOT->KH9 −3.8 22.4 −6.3 −7.7 15.9 −1.4 15.9 1.1 1.1
SRTM->ALOS 23.5 −51.2 6 −6.5 22.3 2.5 10.1 2.1 2.8
TCD
8, 2573–2610, 2014Elevation changes of Inylchek Glacier during 1974–2007
D. Shangguan et al.
Title Page
Abstract Introduction
Conclusions References
Tables Figures
◭ ◮
◭ ◮
Back Close
Full Screen / Esc
Printer-friendly Version Interactive Discussion
Discussion
P
a
per
|
Discus
sion
P
a
per
|
Discussion
P
a
per
|
Discussion
P
a
per
|
Table 4.Comparison with GPS and DEMs before and after co-registration.
In stu DEMs Before co-registration Difference After co-registration Description No Latitude Longitude GPS_Elevation (m) SPOT_DEM (m) ALOS_DEM (m) SRTM_DEM (m) KH9 (m) GPS_SPOT (m) SPOT_DEM (m) GPS_SPOT (m)
TCD
8, 2573–2610, 2014Elevation changes of Inylchek Glacier during 1974–2007
D. Shangguan et al.
Title Page
Abstract Introduction
Conclusions References
Tables Figures
◭ ◮
◭ ◮
Back Close
Full Screen / Esc
Printer-friendly Version Interactive Discussion
Discussion
P
a
per
|
Discus
sion
P
a
per
|
Discussion
P
a
per
|
Discussion
P
a
per
|
Table 5.The Southern IG and Northern IG area change betweeen 1974 and 2007.
Area (km2) Area change
1974 1990 1999 2007 1974–1990 1990–1999 1999–2007 1974–2007
km2 % km2 % km2 % km2 %
Southern IG 508.4±6.6 508.3±9.7 507.8±4.6 507.6±2.5 −0.1±0.1 – −0.5±0.0 −0.1 −0.2±0.0 – −0.8±0.0 −0.2
Northern IG 156.6±2.8 155.3±4.2 159.0±2.1 158.6±0.5 −1.2±0.1 −0.8 3.7±0.3 2.4 −0.4±0.1 −0.3 2.0±0.1 1.3
TCD
8, 2573–2610, 2014Elevation changes of Inylchek Glacier during 1974–2007
D. Shangguan et al.
Title Page
Abstract Introduction
Conclusions References
Tables Figures
◭ ◮
◭ ◮
Back Close
Full Screen / Esc
Printer-friendly Version Interactive Discussion
Discussion
P
a
per
|
Discus
sion
P
a
per
|
Discussion
P
a
per
|
Discussion
P
a
per
|
Table 6.Glacier surface change for period 1974–2007.
Observation Percentage of Glacier surface region (km2) total area (%) change (m a−1)
IG SPOT-SRTM 224.7 33.7 0.5±0.5
SRTM-KH9 136.4 20.5 −0.8±0.1
SPOT-KH9 115.1 17.3 −0.5±0.1
North IG SPOT-SRTM 34.3 21.6 −0.2±0.5
SRTM-KH9 16.6 10.4 0.7±0.1
SPOT-KH9 14.1 8.9 0.1±0.1
South IG SPOT-SRTM 190.5 37.5 0.5±0.5
SRTM-KH9 119.8 23.6 −1.1±0.1
TCD
8, 2573–2610, 2014Elevation changes of Inylchek Glacier during 1974–2007
D. Shangguan et al.
Title Page
Abstract Introduction
Conclusions References
Tables Figures
◭ ◮
◭ ◮
Back Close
Full Screen / Esc
Printer-friendly Version Interactive Discussion
Discussion
P
a
per
|
Discus
sion
P
a
per
|
Discussion
P
a
per
|
Discussion
P
a
per
|
2


![Figure 3. Flow direction and velocity of southern IG [m a −1 ] between 2002 and 2003 (above) and 2010 and 2011 (below).](https://thumb-eu.123doks.com/thumbv2/123dok_br/18264286.343769/34.918.166.543.58.544/figure-flow-direction-velocity-southern-ig-m.webp)